Author: AiPlot Research Institute
Focus: RWA / Digital Assets / In-depth Analysis of Financial Infrastructure
Website: https://aiplot.com/?utm_source=aicoin
The RWA market is undergoing a change that is easy to overlook: on-chain users do not necessarily prioritize long-term holding of tokenized stocks or commodities; instead, they may be more inclined to trade perpetual contracts related to the price fluctuations of these real-world assets.
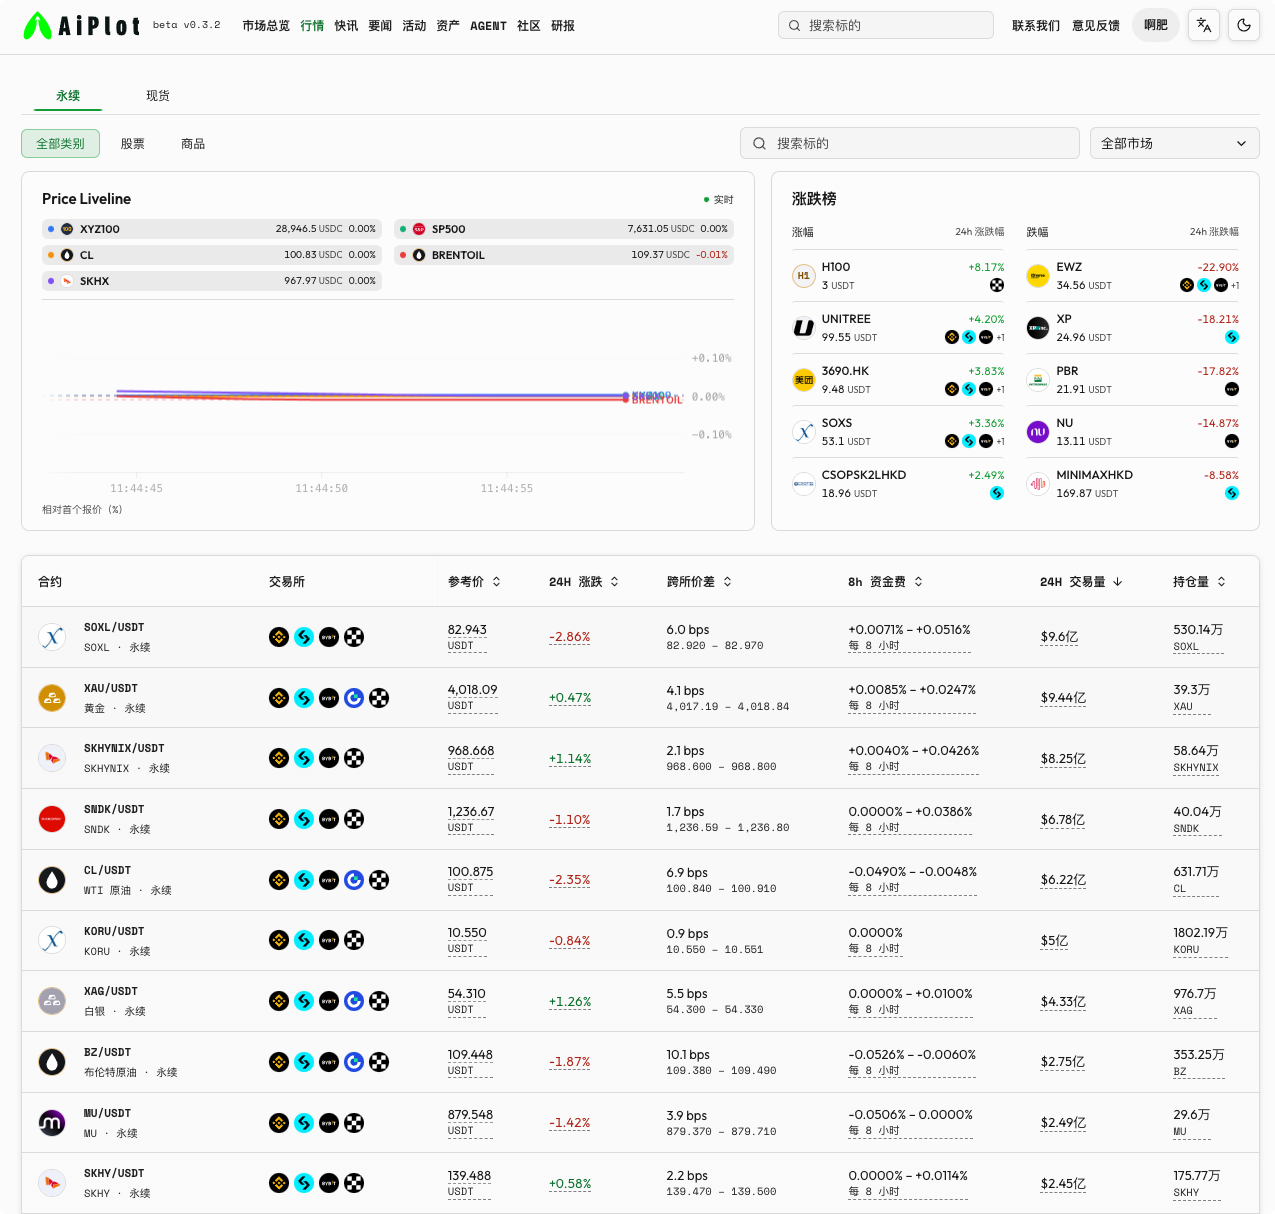
The AiPlot Markets page shows that the perpetual contracts with the highest position sizes are concentrated in assets such as semiconductor stocks, gold, silver, crude oil, and Brent crude oil. The nominal position size of the top ten contracts totals approximately 5.33 billion USD, with the top three being gold XAU, WTI crude oil CL, and SK Hynix, together accounting for about 2.59 billion USD, nearly half of the total size of the top ten.
The core value of this data is not to tell us which assets have risen the most, but to reveal the asset preferences, funding structures, and risk concentrations that are forming in the on-chain derivatives market.
More accurately, the current on-chain demand for RWA has split into two paths: one is the spot holding of tokenized assets, and the other is perpetual contracts that use stablecoins as collateral and establish long and short positions around real assets.
I. First, let's look at the total: The top ten contracts have approximately 5.3 billion USD in nominal positions
The data includes reference prices, 24-hour price changes, cross-platform price differentials, 8-hour funding rates, 24-hour trading volumes, and position sizes. The position sizes are shown in terms of the quantity of the underlying assets, rather than directly in USD.
Therefore, to estimate the nominal position value of each contract, the reference price must be multiplied by the position quantity. Based on the data in the screenshot, the nominal positions of the top ten contracts are approximately as follows:
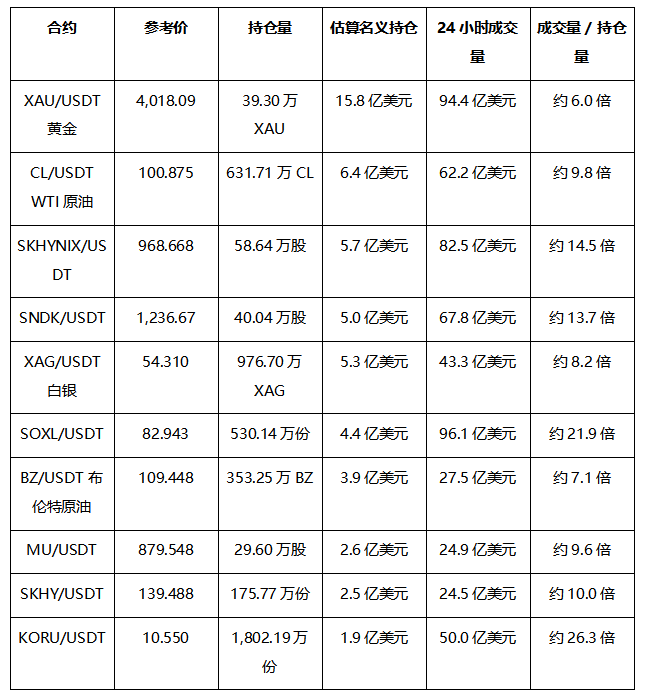
This table first reveals a structural fact: the contract with the highest position size is not necessarily the one with the largest nominal funding size.
For example, SOXL has a position size of about 5.3 million contracts, but due to its relatively low price per contract, the nominal position is about 440 million USD; gold has only about 393,000 units, but due to a unit price exceeding 4,000 USDT, it forms a nominal position of about 1.58 billion USD, becoming the largest single contract in the top ten.
Thus, when analyzing the RWA perpetual market, one cannot simply look at the “position size ranking”. At least, one should also consider asset prices, contract multipliers, nominal positions, trading volumes, and funding rates simultaneously.
II. Gold remains the most mature macro asset in on-chain RWA
XAU/USDT ranks first in nominal position size in the screenshot, with an estimated position of about 1.58 billion USD and a 24-hour trading volume of about 9.44 billion USD. Its position size is not the highest in the top ten, but its nominal size is significantly leading over other assets.
The advantages of gold are clear: it has a globally unified macro perception, and traders do not need to understand the financial reports, supply chains, or governance structures of specific companies to form trading judgments based on interest rates, the dollar, inflation, and geopolitical factors.
Gold is also suitable for the around-the-clock trading model of on-chain perpetual contracts. The traditional gold market has trading hours and settlement times, but on-chain users can directly use stablecoins to establish long and short positions. This makes XAU/USDT more like a global macro trading entry point, rather than just a commodity token.
Gold rose by about 0.47% in 24 hours, with a positive 8-hour funding rate ranging approximately +0.0085% to +0.0247%. A positive funding rate typically indicates that long positions pay funding costs to short positions, showing stronger market demand from longs, but cannot alone prove that prices will continue to rise.
Gold's trading volume is about six times its nominal position, indicating active market turnover, but it is not as extreme as SOXL or KORU. It is closer to a core macro variety with a significant existing position and stable trading demand.
III. Crude Oil: Large position size, but risks differ completely from gold
CL/USDT and BZ/USDT represent WTI crude oil and Brent crude oil, respectively. Together, they have a nominal position of about 1.03 billion USD, accounting for about one-fifth of the total size of the top ten.
The inclusion of crude oil in the top ten by position size indicates that on-chain RWA trading demand has surpassed that of stocks and precious metals, beginning to cover the most important global energy benchmark prices.
However, the risks of crude oil perpetual contracts are also more complex. The main pricing variables for gold are interest rates, the dollar, and risk tolerance; for crude oil, they are also influenced by inventories, production, transportation, refining profits, geopolitics, and futures curves. WTI and Brent are not the same asset; their prices, delivery points, supply structures, and market participants differ.
CL/USDT fell by about 2.35% in 24 hours, with a cross-platform price differential of about 6.9 basis points and a negative funding rate ranging from -0.0490% to -0.0048%. A negative funding rate usually implies that short positions are more crowded, or that longs are willing to pay lower costs to maintain positions. Combined with price declines, this suggests a market state where short-term short pressure is rising.
BZ/USDT dropped by about 1.87% in 24 hours, with an expanded cross-platform price differential of about 10.1 basis points, and its funding rate is also negative. Compared to CL, BZ's spread is wider, indicating that the synchronization and liquidity of quotes across different platforms may be weaker.
These two varieties illustrate that the competition for RWA perpetual contracts is not just about "moving assets on-chain", but also about addressing issues such as market closures, oracle delays, differing benchmark prices, and inconsistencies in cross-platform liquidity.
IV. Semiconductor stocks have become the most important equity RWA trading theme
SK Hynix, SanDisk, Micron, and SOXL all appear in the top ten. If these four contract types are combined, the estimated nominal position is about 1.91 billion USD, accounting for approximately 35.8% of the total size of the top ten.
This is more meaningful than simply observing any single stock token. It indicates that on-chain traders are not focusing on "any stock being moved on-chain," but rather on equity assets that have high volatility, high attention, and clear industry narratives.
The semiconductor sector meets these three conditions:
First, AI capital expenditure and storage cycles generate a continuous news flow. Second, the price volatility of stocks themselves is significant, making them suitable for perpetual contract trading. Third, semiconductor companies are clearly linked to computing power, servers, data centers, and AI infrastructure, making it easier for traders to establish cross-asset industry judgments.
1. SK Hynix: High positions and trading volumes
SKHYNIX/USDT has a reference price of about 968.668 USDT, with a position of about 586,400 shares and an estimated nominal position of about 570 million USD, while the 24-hour trading volume is approximately 8.25 billion USD.
Its trading volume is about 14.5 times its position size, indicating that its trading activity is significantly higher than that of gold. It rose by about 1.14% in 24 hours, with a slightly positive funding rate ranging from +0.0040% to +0.0426%.
This reflects that there is demand from longs, but the range of funding costs is relatively wide, possibly reflecting differences in funding rates across platforms, or that the market has experienced long-short switches at different times.
The on-chain trading logic for SK Hynix is typically related to the prices of storage chips, demand for HBM, capital expenditure on AI servers, and the risk appetite for Asian tech stocks. It is not a low-volatility RWA in the traditional sense, but rather a high-beta stock exposure with strong industrial cycle traits.
2. SanDisk: High trading volume corresponding to a significant position base
SNDK/USDT has a reference price of about 1,236.67 USDT, a position of about 400,400 shares, and an estimated nominal position of about 500 million USD, with a 24-hour trading volume of approximately 6.78 billion USD.
SNDK fell by about 1.10% in 24 hours, with the funding rate close to neutral, ranging from 0.0000% to +0.0386%. Compared to SK Hynix, SNDK's price performance is weaker, but the funding rate does not indicate extreme short crowding.
This usually means that the market has relatively high turnover, but both sides have not formed a clear unilateral structure. For traders, SNDK may simultaneously be impacted by both fundamental changes in the storage industry and changes in on-chain liquidity, making position changes more worth tracking than daily price changes.
3. Micron: Smaller position, but still characterized by high turnover
MU/USDT has a position of about 296,000 shares, with an estimated nominal position of about 260 million USD and a 24-hour trading volume of about 2.49 billion USD. It fell by about 1.42% in 24 hours, with a negative funding rate ranging from -0.0506% to 0.0000%.
A negative funding rate indicates relatively stronger demand for shorts or hedging. MU's position size is lower than those of SK Hynix and SNDK, but its volume/position ratio is about 9.6 times, indicating that it is not a low liquidity marginal variety but rather a semiconductor RWA with high intraday turnover.
4. SOXL: Nominal position not the largest, but the trading efficiency is the highest
SOXL/USDT represents an on-chain perpetual exposure of a threefold long ETF in semiconductors. The screenshot shows its position at about 5.30 million contracts, with a nominal position of about 440 million USD, and a 24-hour trading volume reaching 9.61 billion USD, the highest among the top ten.
Its volume/position ratio is about 21.9 times, only second to KORU. SOXL fell by about 2.86% in 24 hours, with a positive funding rate ranging from +0.0071% to +0.0516%.
This data is noteworthy: despite the price decline, the funding rate is positive, indicating that there is still demand for long leverage in the market. Longs may continue to build or maintain positions during a price drop, or they could be hedging against other semiconductor short risks.
However, SOXL itself is a leveraged ETF, and trading it again in a perpetual contract form on-chain essentially combines the underlying volatility, ETF internal leverage, and perpetual contract margins. Its trading attractiveness is high, but the risks of liquidation and volatility are much higher than those of ordinary stock RWAs.
V. Silver indicates that on-chain commodity trading is expanding from a single safe-haven asset to industrial metals
XAG/USDT has a reference price of about 54.310 USDT, with a position of about 9.767 million units, and an estimated nominal position of about 530 million USD, with a 24-hour trading volume of about 4.33 billion USD.
Silver rose by about 1.26% in 24 hours, and its funding rate is close to neutral, at approximately 0.0000% to +0.0100%. This contrasts with gold: gold has a larger position size and more noticeable funding rate; silver has stronger price volatility, but the long and short funding structures are relatively balanced.
Silver possesses attributes of both precious metals and industrial metals, thus connecting two types of trading logic: one related to the dollar, interest rates, and safe-haven trading, and the other related to manufacturing, solar energy, electronics, and industrial demand trading.
From the RWA perspective, silver is more suitable than gold for observing the intersection between "macro assets" and "industrial assets." If its on-chain demand continues to expand, it reflects that users are not merely trading digital gold, but are hoping to gain broader price exposure to global commodities through on-chain markets.
VI. The high turnover of KORU reminds us that position rankings do not equal liquidity quality
KORU/USDT has a position of about 18.0219 million contracts, but since its unit price is only about 10.55 USDT, its nominal position is about 190 million USD, which is not high among the top ten.
However, its 24-hour trading volume is about 5 billion USD, with a volume/position ratio of approximately 26.3 times, the highest among the top ten. This indicates that KORU has extremely high nominal turnover, but this number alone does not determine its market quality.
High trading volume may come from high-frequency trading, short-term arbitrage, market maker turnover, or from rapid opening and closing of long and short positions. If the position does not grow simultaneously, the trading volume is more likely to be capital repeatedly turning over among the same batch of positions, rather than new long-term capital continuously entering.
Thus, the focus for KORU is not "high trading volume", but it needs to continue to observe whether position sizes continue to increase, whether spreads are narrowing, funding rates are stable, and whether trading volumes can convert into a deeper order book and lower impact costs.
VII. Funding rates provide more valuable market sentiment information than price changes
The funding rates of the top ten contracts in the screenshot are not consistent: SOXL, XAU, SKHYNIX, SNDK, XAG, and SKHY are biased positive, while CL, MU, and BZ are biased negative, with KORU close to zero.
This indicates that the RWA perpetual market is not entirely bullish or bearish, but is diverging by asset category:
For semiconductor-related assets, SOXL and SKHYNIX have positive funding rates, representing strong long leverage demand; MU shows a negative funding rate, indicating clear relative trading and stock differentiation even within the same industry.
In terms of precious metals, gold's funding rate is positive, while silver is close to neutral. Traders may be more willing to pay funding costs for long exposure to gold, but the long and short forces for silver are more balanced.
In energy, both CL and BZ show negative funding rates, and their prices are declining synchronously, indicating a more evident short demand for crude oil assets at that time.
Funding rates cannot alone predict future prices, but they can help evaluate which side bears the holding costs. If prices are falling while the funding rate is positive, there may be risks of "longs passively bearing costs"; if prices are falling and the funding rate is negative, it may indicate that short trading is relatively crowded, and the marginal returns and risks of continuing to go short are changing.
VIII. The most apparent risk in the top ten markets: large trading volume does not imply that the underlying asset liquidity is equally adequate
Most contracts in the screenshot have 24-hour trading volumes reaching several times their nominal positions, with SOXL and KORU exceeding 20 times. This indicates that on-chain perpetual contracts have strong capital turnover capabilities.
However, the trading volume of perpetual contracts can occur without holding equivalent underlying assets. Traders only need stablecoin margin, while platforms provide price exposure through price oracles and cash settlement. Therefore, on-chain nominal trading volume cannot be directly equated to the actual amounts of stocks, gold, or crude oil being purchased.
This brings about four types of risks.
The first is oracle risk. Prices of stocks and commodities come from off-chain markets, while on-chain trading can occur around the clock. During off-hours in the real market, how on-chain prices are updated directly affects the liquidation prices.
The second is cross-platform price differential risk. The cross-platform price differentials in the screenshot range from about 0.9 basis points to 10.1 basis points. BZ has a wider spread, and CL is also significantly higher than SKHYNIX and SNDK. The larger the spread, the more likely traders are to encounter slippage, index deviation, or inconsistencies in liquidation price during volatile conditions.
The third is leverage stacking risk. Leveraged ETFs such as SOXL when combined with perpetual contract mechanisms may amplify gains and losses or forced liquidations within short time frames.
The fourth is position concentration risk. Gold, crude oil, and semiconductor stocks occupy the majority of nominal scale among the top ten contracts. If the dollar, interest rates, AI capital expenditures, or energy geopolitics experience a common shock, multiple RWA markets may fluctuate simultaneously, leading to increased margin pressure across different products.
Conclusion: The first large-scale scenario for RWA may be the on-chain derivatives market for real assets
AiPlot's data for the top ten positions shows that the on-chain RWA perpetual market has formed a relatively clear structure: gold is the largest macro asset, crude oil provides energy trading exposure, silver connects macro and industrial demand, and semiconductor stocks have become the primary trading theme for equity RWA.
The top ten contracts have an estimated nominal position of about 5.33 billion USD, with the top three accounting for about 2.59 billion USD. The total for semiconductor-related contracts is approximately 1.91 billion USD, indicating a strong demand from traders for price exposure in the AI, storage, and computing power industries.
However, this data should not be interpreted as indicating that 5.3 billion USD in stocks, gold, and crude oil has been directly moved on-chain. It more accurately reflects that the on-chain market is bringing the price, leverage, and long-short trading mechanisms of real assets into the stablecoin settlement system.
The next stage for RWA may therefore present two parallel paths: the spot market continues to promote the tokenization of asset ownership and income rights, while the perpetual market prioritizes around-the-clock trading and leveraged price discovery.
For investors and researchers, what needs real attention is not which RWA contract ranks where, but:
Is this position formed by long-term capital accumulation, or is it shaped by high leverage and high-frequency turnover? Is its price derived from a stable real market, or does it rely on fragile oracles and low liquidity quotes?
When AiPlot puts position sizes, trading volumes, funding rates, and cross-platform price differentials on the same page, RWA is no longer just a conceptual label, but begins to present as a real market structure that can be continuously tracked and dissected.
For more data and analysis, please follow Aiplot:
https://aiplot.com/?utm_source=aicoin
📖 Community Communication:
Telegram:
https://t.me/+IIYMcJigBAo4Mjg1
The content of this article represents the author's personal views and does not represent the position of this platform. The opinions, conclusions, and recommendations in the text are for investors' reference only and do not constitute any investment advice related to this platform. The market has risks, and investment should be cautious.
免责声明:本文章仅代表作者个人观点,不代表本平台的立场和观点。本文章仅供信息分享,不构成对任何人的任何投资建议。用户与作者之间的任何争议,与本平台无关。如网页中刊载的文章或图片涉及侵权,请提供相关的权利证明和身份证明发送邮件到[email protected],本平台相关工作人员将会进行核查。