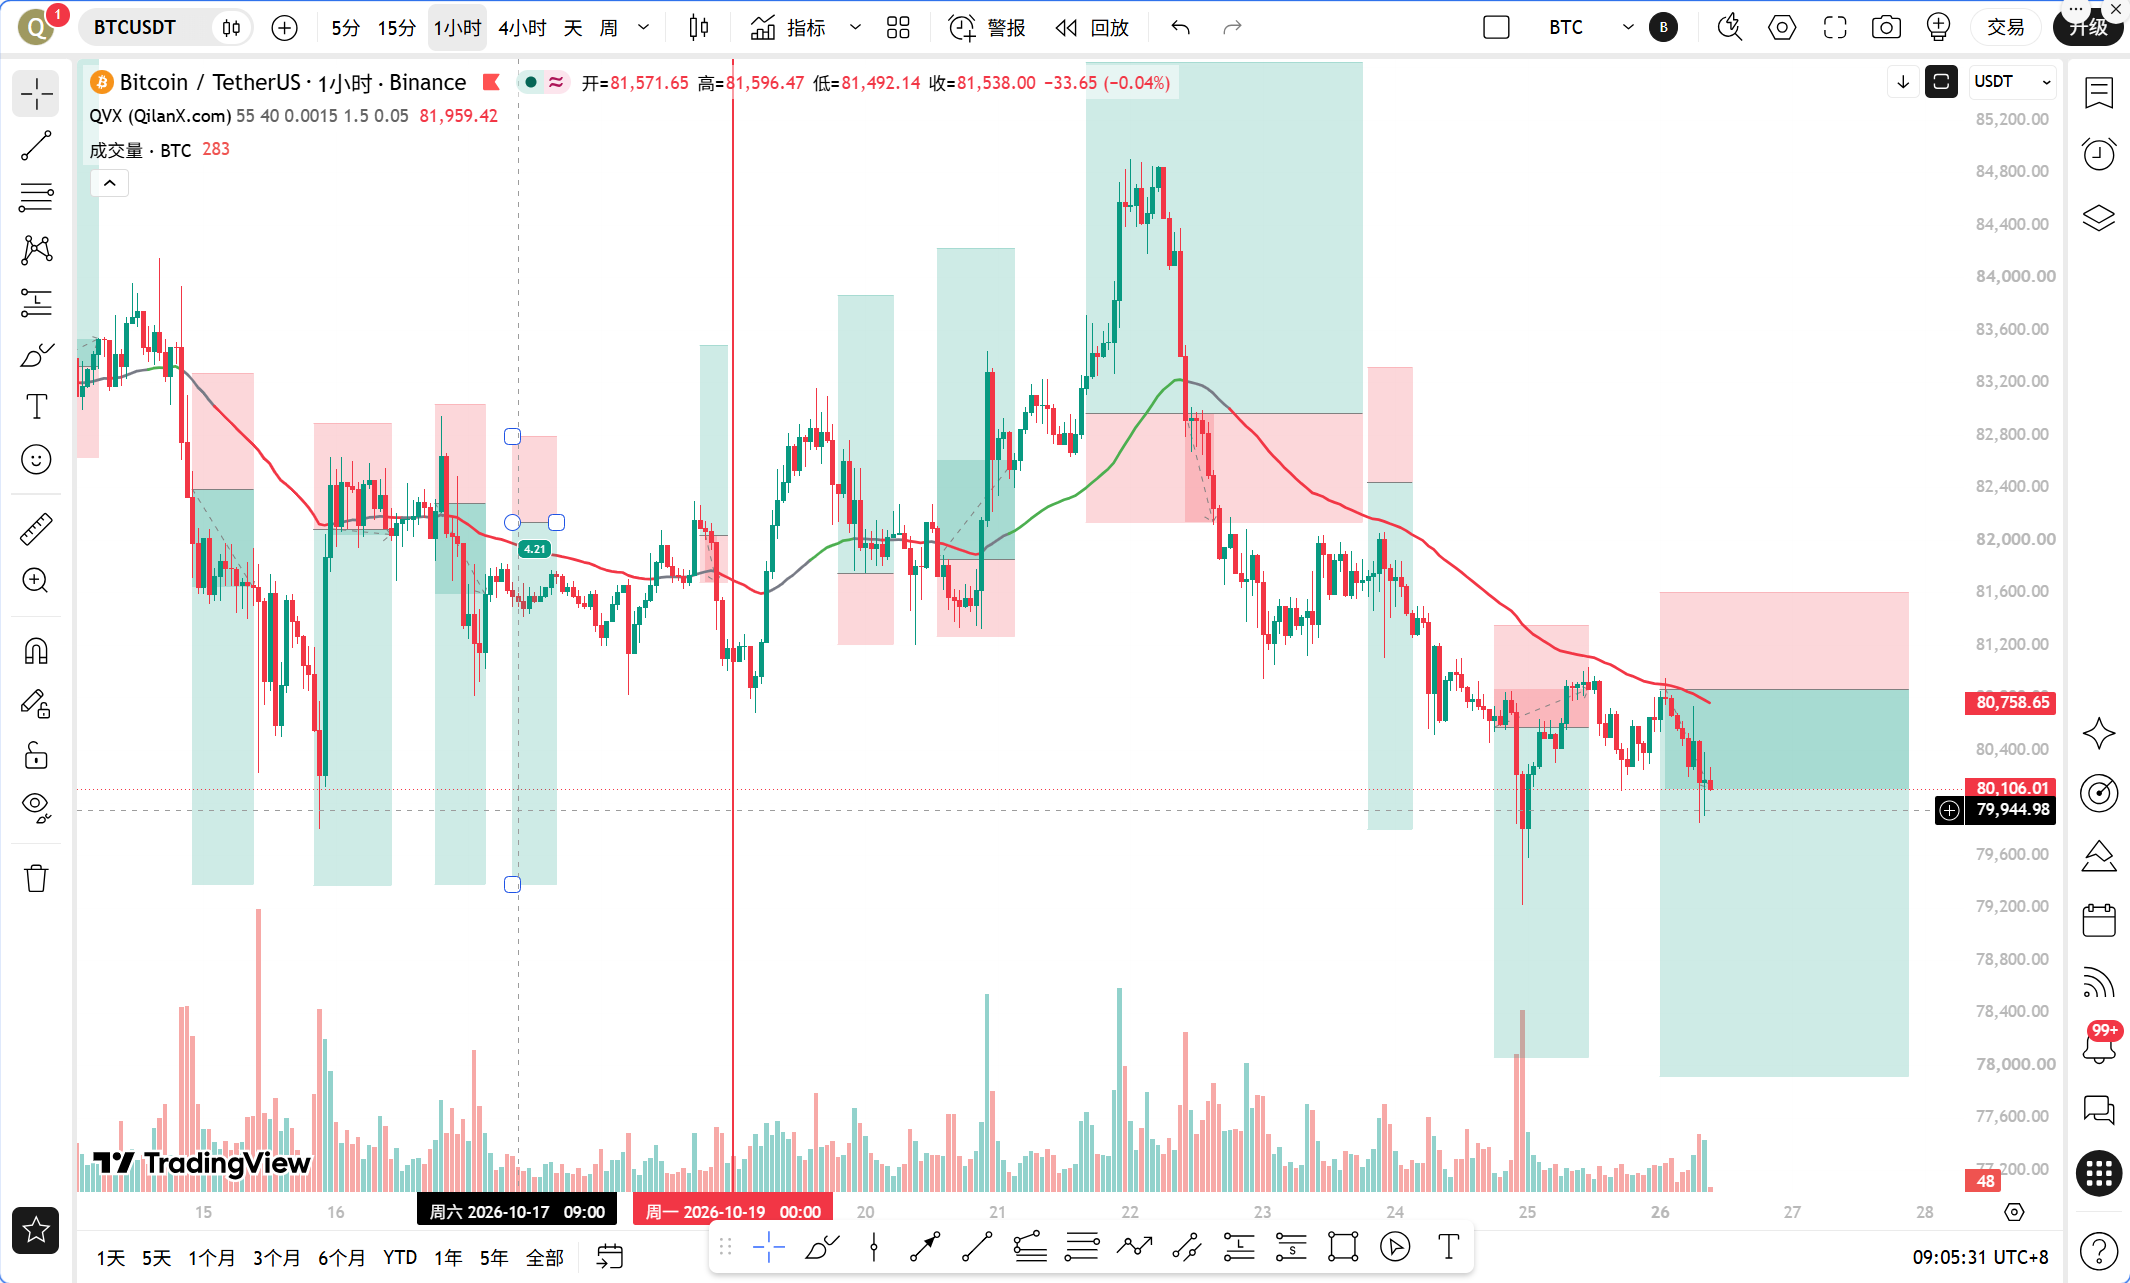
This morning, there are two key points worth noting. The first is that South Korea's cryptocurrency income tax may face a fourth postponement, causing a change in the plan originally set to be implemented in 2027, which directly alleviates the selling pressure in the regional market, a solid positive for Asian market sentiment. The second point is that Circle has minted 250 million USDC on the Solana network, with large issuances of stablecoins often seen as a forward signal for incremental funds entering the market. Together, these events indicate a short-term warming of sentiment. However, I must remind everyone that news is news, and the market is the market. The price of BTC is still pressed below the 1-hour EMA55, and the signals given by the TPV system do not support blind optimism. There’s also a bearish point that’s easily overlooked: as of 2026, price manipulation attacks on DeFi have reached 43, surpassing the total for the entire year of 2022, and the rise in safety risks will weaken confidence in DeFi funds, which is a pressure for altcoins and the DeFi sector. The intertwining of bullish and bearish news precisely tests trading discipline.
Current Price and Time
The current time is October 26, 09:15, with BTC quoted at 79998 USDT, a 24-hour drop of 1%, market share at 60%, and a fear and greed index of 50, which is neutral. The price is exactly stuck near the round number of 80,000; the psychological significance of this position is self-evident, as round numbers have always been battlegrounds for bulls and bears.
Multi-Timeframe Overview
First, let's look at the daily chart. The daily MA5 is at 80729.16, MA10 at 81631.28, and MA30 at 82953.54, with a very clear bearish arrangement of moving averages, and the price operating below all moving averages. The daily MACD shows a DIF of -431.19, DEA of -57.40, and a histogram value of -373.78, with negative bars still expanding, indicating that the downward momentum on the daily level has not yet exhausted. The daily RSI stands at 41.72, leaving space before reaching the oversold zone, which means the daily level is not yet at the point of a full drop.
Next, looking at the 4-hour chart. The 4-hour MA5 is at 80387.33, MA10 at 80465.35, and MA30 at 81586.84, again showing a bearish arrangement. The 4-hour MACD's DIF is -479.99, DEA is -442.65, and the histogram value is -37.35. Although the negative histogram isn't large, both DIF and DEA are below the zero axis, with DIF lower, maintaining a sound bearish structure. The 4-hour RSI is at 31.98, approaching the 30 oversold line, which is the only area for the bulls to pay attention to, indicating a technical need for a recovery at the 4-hour level.
The 1-hour chart is the core timeframe for the TPV system. The 1-hour MA5 is at 80212.29, MA10 at 80439.05, MA30 at 80560.25, with the price of 79998 below all moving averages. The 1-hour EMA55 is at 80683.86, and the current price is 0.85% away from EMA55, sitting below it. The 1-hour MACD's DIF is -127.13, DEA is -75.66, with a histogram value of -51.47, and the negative histogram state continues. The 1-hour RSI is at 34.30, relatively weak but not extreme.
On the 15-minute chart, MA5 is at 80135.37, MA10 at 80155.48, and MA30 at 80412.88, with the price also below the moving averages. The 15-minute MACD's DIF is -125.83, DEA is -99.50, histogram value is -26.32, and signs of narrowing negative bars are not obvious. The 15-minute RSI is at 39.74, with short-term improvement but limited strength.
TPV Signal Verification
Following the rules of the Qinglan TPV system, we compare them one by one. In terms of trend positioning, the current price of 79998 is below the 1-hour EMA55 at 80683.86, clearly in a bearish trend area. The first condition for shorting requires the price to be under pressure below the 1-hour EMA55, needing two consecutive 1-hour closing prices below EMA55, and the oscillation auxiliary data tells us that out of the past 8 1-hour candles, the closing price closed above EMA55 0 times, with 0 crosses, meaning the price has continuously closed below EMA55 for 8 consecutive candles, fully satisfying the first condition. The second condition involves encountering pressure, where the price repeatedly tests the 80 thousand level but fails to break above EMA55, indicating a state of pressure after reaching a valid high. The third condition indicates weakness in the rebound; the 1-hour MACD negative histogram continues, and the RSI is recovering from a low but has not broken above the midpoint of 50, indicating insufficient rebound strength. All three conditions are met simultaneously, and the TPV system gives a clear bearish signal.
Regarding handling oscillating markets, the past 8 1-hour closing prices above EMA55 were 0, which does not fall within the 3 to 5 times oscillation interval, and crossing times were also 0; the price's distance from EMA55 of 0.85% greatly exceeds the threshold of 0.3%, so it currently does not meet the definition of an oscillating market, with the system judging it to be in a unilateral trend state, allowing for a proactive short approach.
On-chain/Fundamentals
The fear and greed index at 50 is neutral, indicating that market sentiment is neither cold nor hot, with no panic selling nor greedy buying happening. BTC's market share is at 60%, and funds continue to concentrate on Bitcoin, putting pressure on altcoins. A 1% drop over 24 hours is considered a moderate decline rather than a sharp drop. Regarding stablecoins, Circle's issuance of 250 million USDC is a positive signal for incremental funds, but the time from minting to actual inflow into buying requires time, reflecting more of a sentiment boost in the short term. The postponement of the South Korean tax burden alleviates regional selling pressure as a mid-term logic, and the short-term market may not reflect it immediately. Overall, the fund situation is slightly neutral to warm, while the technical aspect leans bearish; when the two diverge, prioritize the technical aspect.
Key Support and Resistance Levels
The first resistance level above to watch is the 1-hour EMA55 at 80683.86, which is the dividing line for the TPV system; if the price cannot break above, we can't talk about a bullish trend. The second resistance level lies at the pressure zone formed by the 1-hour MA30 at 80560.25 and the 4-hour MA5 at 80387.33, roughly in the range of 80380 to 80560. The first support level below is the round number of 80,000, which is a psychological defense line; if broken, we look at the previous low area on the daily chart, referencing the gap filling level at 75,000 mentioned by analysts. If the 80,000 level fails, further downside will be opened up, and 75,000 is an important observation point for the mid-term.
Trading Idea
Direction: Bearish. All three shorting conditions of the TPV system are satisfied, and it is in a unilateral trend state; do not go long against the trend.
Entry Conditions: The current price of 79998 is below EMA55, but I do not recommend directly chasing the short. Wait for the price to rebound to the 80380 to 80560 pressure zone, observing for long upper shadows or top formations, and when the 1-hour MACD negative histogram no longer shrinks and the RSI rebounds meet resistance, enter a short position. If the price directly breaks below 79800 and confirms with a 1-hour close, a light position can be followed, but control the position size.
Stop Loss: For short positions, set the stop loss above the 1-hour EMA55, specifically referencing the range of 80700 to 80800, meaning if the price re-establishes itself above EMA55 with two consecutive 1-hour closes above it, indicating the failure of the bearish logic, it is mandatory to exit.
Target Levels: The first target is 79800, the second target is 79000, and the third target looks at the gap filling area at 75000. After reaching the first target, it’s wise to reduce the position by half, and adjust the stop loss to protect profits on the remaining position.
Risk Warning
Positive news may trigger a short-term pulse rebound; strict stop losses are necessary, and do not hold onto positions.
Follow the Qinglan Crypto Classroom to capture more trading opportunities! Welcome to visit the official website www.qinglan.org
📊 Qinglan TPV Trading Strategy Backtesting Reference
🕒 Last Backtest Time 10-26 07:00:01
Total Analysis: 4667 Backtests: 4659 Accuracy Rate: 77.3% (3600/4659)
免责声明:本文章仅代表作者个人观点,不代表本平台的立场和观点。本文章仅供信息分享,不构成对任何人的任何投资建议。用户与作者之间的任何争议,与本平台无关。如网页中刊载的文章或图片涉及侵权,请提供相关的权利证明和身份证明发送邮件到[email protected],本平台相关工作人员将会进行核查。