Cryptocurrency Circle Academician: On the early morning of October 25th, with Ethereum (ETH) wailing on all screens, being on the sidelines waiting is itself the sharpest long position
Brothers, how many people were thrown off the bus in the early morning after that big bearish candle came crashing down yesterday? My own long position around 2350 was also closed today, there's no shame in that. In trading, the worst fear is not losing money, but losing money and still stubbornly fighting against the market. Ethereum slid from 2800 all the way down to just over 2300, and every time it rebounded, someone shouted bottom, but what happened? There’s a basement under the bottom. Today's article doesn’t brag, I’ll just speak the truth with charts, telling you how to look at it next, what to do, and how to save yourself
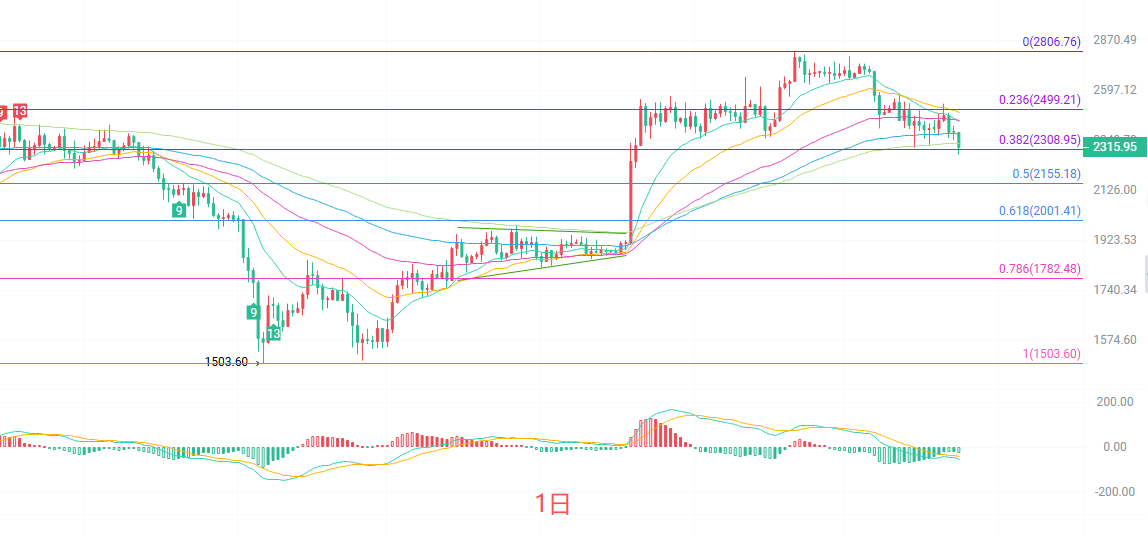
Today’s daily line closed with a large bearish candle with a long lower shadow, opening at 2386 and crashing directly to 2281, hitting a low of 2280 at the lower Bollinger Band before taking a breath, with a daily decline of 3.05%. The moving average system is now struggling around EMA120 at 2335. The bearish momentum on the MACD has not fully released. The TD Sequential on the daily line just showed a 3, indicating that this wave of declining structure at the daily level is not yet finished, so don't rush to catch the bottom
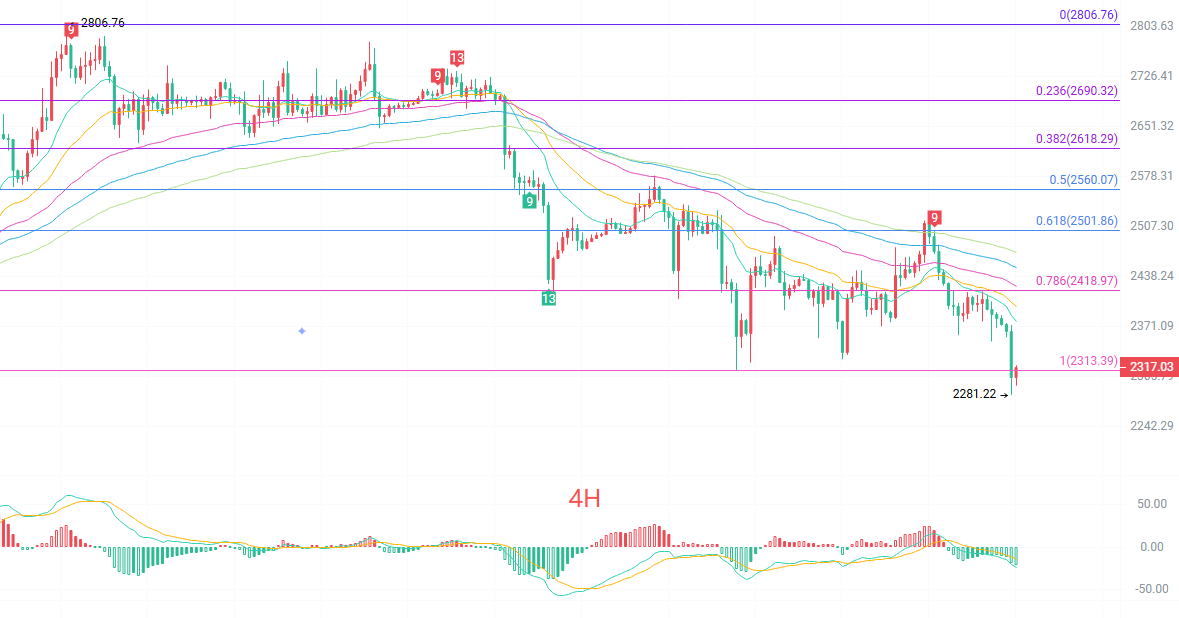
Four-hour K-lines continue to decline, with the last two K-lines forming a double bottom around 2281, currently closing at 2314, standing back at the 2300 integer level. But be cautious, EMA15 is at 2377, and EMA30 is at 2397, the price is still far from the short-term moving averages, which is a typical continuation pullback pattern during a decline. The lower band at 2304 was briefly breached but closed back, with the bandwidth converging. The MACD green bars are beginning to shorten, and there are signs of the DIF turning, with the TD Sequential showing a 7, indicating a need for a short-term rebound at the four-hour level, but the rebound height should first target the 2350-2377 resistance zone
Short-term reference:
Going north from 2280 to 2240 is blocked, stop loss at 30 points, target looking at 2320 to 2380
Going south from 2370 to 2400 is stagnant, stop loss at 30 points, target looking at 2320 to 2270
Specific operations should mainly rely on real-time market data. For more detailed information, please consult the author; there may be delays in article publication, and it is suggested for reference only at your own risk
Friendly reminder: The above content is being updated synchronously on platforms like Binance, OKEX, Huobi, etc. You can follow me and join my fan group
免责声明:本文章仅代表作者个人观点,不代表本平台的立场和观点。本文章仅供信息分享,不构成对任何人的任何投资建议。用户与作者之间的任何争议,与本平台无关。如网页中刊载的文章或图片涉及侵权,请提供相关的权利证明和身份证明发送邮件到[email protected],本平台相关工作人员将会进行核查。