Crypto Circle Scholar: When the Ethereum (ETH) network collectively shouts about breaking through on October 24, it often signals the night before a market reversal.
Writing this analysis, it is very quiet outside, but the K line on the screen is like a roller coaster. Sometimes I wonder, what are we really pursuing as we stare at this number on the screen every day? Is it the fantasy of financial freedom or the thrill of the battle? I chased Ethereum from 1500 up to 2800 and then back down to 2400, with countless lives fluctuating in each K line. All I can do is honestly write down what I see and think for you. If you profit, I am happy for you; if you lose, I will accompany you in reviewing. The road of trading is long, don’t rush, take your time. That’s all for today, see you on the chart tomorrow.
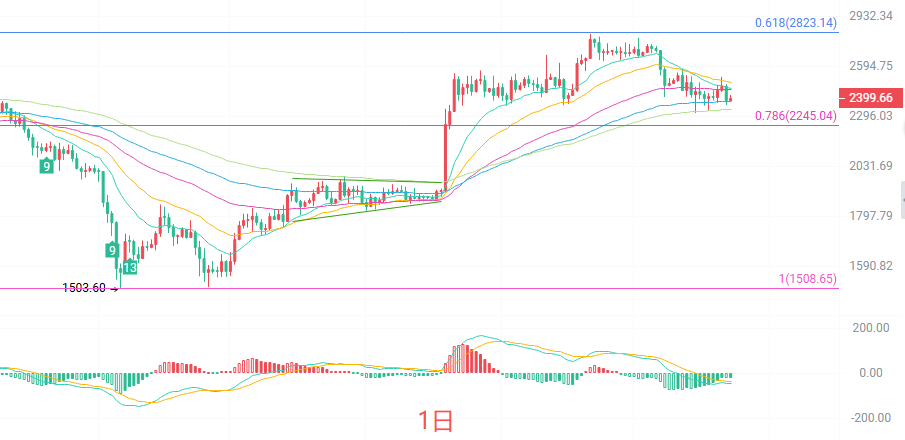
The daily K line sits above EMA90 and EMA120, but is pressed down by EMA15, EMA30, and EMA60, indicating that the medium-term bullish trend is still present, but there is significant resistance from the short-term trapped positions above. The MACD green bars are still increasing, and the bearish momentum has not been completely released. The middle band of the Bollinger Bands at 2493 is the key resistance, while the lower band at 2288 is strong support. The TD nine-count has just appeared with an upward count of 1, which implies that a rebound may begin at the daily level, but whether it can break out depends on whether it can stabilize above the 2450 level.
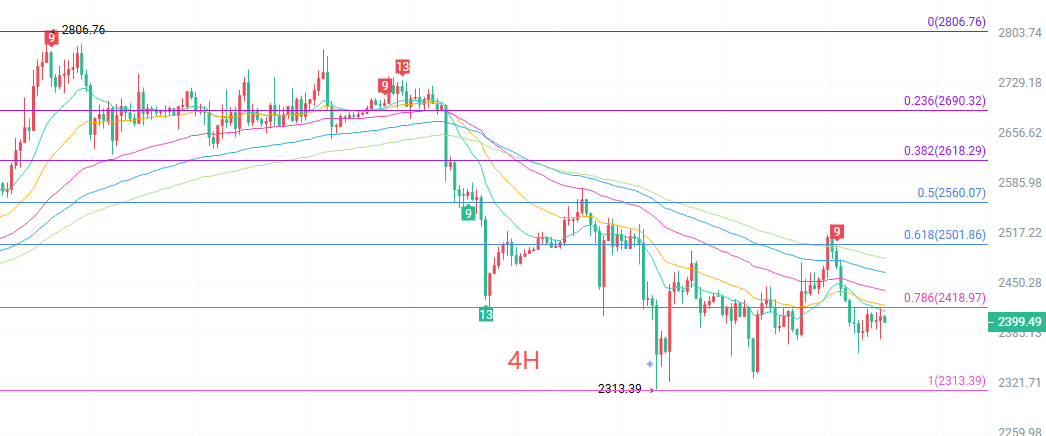
The four-hour K line is just below the middle band of Bollinger Bands at 2431, with EMA15 at 2414, EMA30 at 2421, and EMA60 at 2441, all pressing on top, forming a typical bearish arrangement. Although the MACD green bars are still present, they have narrowed significantly, indicating that the downward momentum at the four-hour level is waning. It is worth noting that the TD nine-count has just shown a downward count of 1, which often suggests that there may be one last potential drop in the short term, but the scope is not large. The previous low of 2313 is the bottom of this adjustment, and the current rebound is around 2400, mainly digesting the profit-taking from the rebound between 2313 and 2551. The Bollinger lower band at 2362 is short-term support; if it breaks down, it will need to retest 2313, and if it retests northwards, it is advisable to increase positions.
Short-term reference:
Going long from 2370 to 2330 faces resistance, stop-loss at 30 points, target looks at 2430 to 2520.
Going short from 2460 to 2500 shows stagnation, stop-loss at 30 points, target looks at 2400 to 2370.
Specific operations should rely on real-time data on the market; for more information, you can consult the author. There may be delays in publishing the article, so it is recommended for reference only, and the risk is self-borne.
Friendly reminder: The above content is synchronized on major trading platforms such as Binance, Ouyi, Huobi, etc. For more content, you can follow me and join my exclusive group chat.
免责声明:本文章仅代表作者个人观点,不代表本平台的立场和观点。本文章仅供信息分享,不构成对任何人的任何投资建议。用户与作者之间的任何争议,与本平台无关。如网页中刊载的文章或图片涉及侵权,请提供相关的权利证明和身份证明发送邮件到[email protected],本平台相关工作人员将会进行核查。