Cryptocurrency Expert: On October 24, Bitcoin (BTC) transitions from short squeeze to bottoming out, market sentiment shifts within a single candlestick.
I have noticed an interesting phenomenon: the more boring the market, the livelier the group chat becomes. Some say the bull market has ended, while others claim a pump is about to happen, and back and forth no one can convince anyone. In fact, the candlestick doesn’t care about your thoughts; it will move as it needs to. That's all for today, place your orders, close the software, and go live your life. The market will come to you; you don’t need to go searching for it.
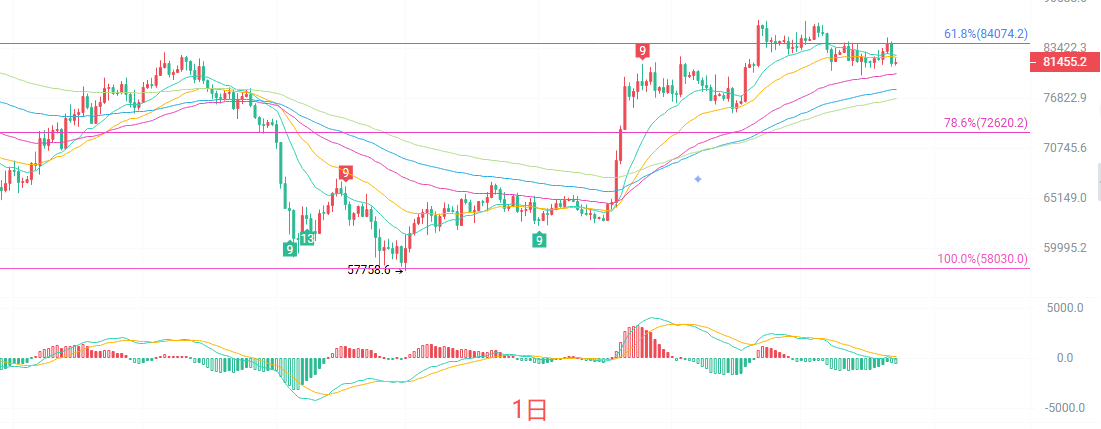
A typical shrinking consolidation pattern on the daily candlestick chart. Prices are currently stuck below EMA15 and EMA30 but are firmly above EMA60, and the mid-term trend line hasn't broken down yet. The middle Bollinger Band at 82890 is the short-term ceiling, and the lower band at 79927 is the bullish defense line. In terms of MACD, DIF has dropped near the zero axis, with the green bars slowly shortening, indicating that the selling pressure from down to 87385 is diminishing, but the bulls haven't really gained momentum yet. The TD Sequential is currently at the second candle and hasn't reached the trend reversal window. Overall assessment: a consolidation repair after a high-level pullback, direction selection still waits for increased volume.
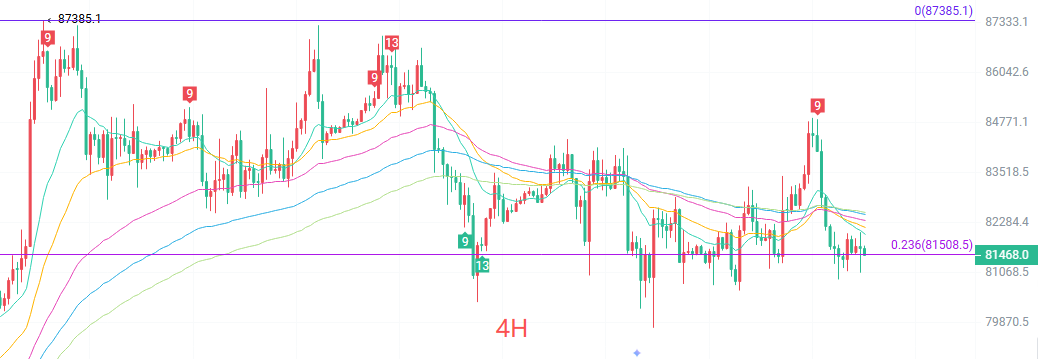
The four-hour candlestick chart tells a different story. It has broken below all five moving averages, and the short and medium-term moving averages are arranged in a bearish structure diverging downwards, which is bearish. MACD continues to show green below the zero axis, indicating that short-term momentum is still in the bears' hands. The Bollinger Band is slightly opening downwards, with the upper band at 84461 being far pressured, and the lower band at 80550 is the nearest support. The previous low of 79732.3 is the lifeline of this adjustment wave. One point to note: the four-hour chart has seen several small doji candlesticks consecutively, indicating a lack of downward movement, which is a stage of bearish exhaustion but without bullish follow-through, making it awkward; chasing shorts can easily get caught, and chasing longs can easily get trapped.
Short-term reference:
Going north, resistance at 80800 to 80300, stop loss 500 points, target 82600 to 83600.
Going south, stagnation at 83200 to 83600, stop loss 500 points, target 82500 to 81600.
Specific operations should be based on real-time market data; for more detailed information, you can consult me. There may be delays in article publishing; suggestions are for reference only, risks are to be borne by the reader.
Warm reminder: The above content is simultaneously updated by the cryptocurrency expert on major platforms like Binance, OKEx, Huobi, etc., and more content can be found by adding me in the exclusive group on Binance Square for more real-time data.
免责声明:本文章仅代表作者个人观点,不代表本平台的立场和观点。本文章仅供信息分享,不构成对任何人的任何投资建议。用户与作者之间的任何争议,与本平台无关。如网页中刊载的文章或图片涉及侵权,请提供相关的权利证明和身份证明发送邮件到[email protected],本平台相关工作人员将会进行核查。