Liying Token Chat: 10.24 Bitcoin (BTC) and Ethereum (ETH) Latest Market Analysis
Dear family! The current price of Bitcoin is 81600, in a position that is neither up nor down. To put it bluntly, the bulls were just trying to catch a breath, while the bears haven't let go yet. It rose from a low of 79732 on October 16 to 84875, an increase of more than five thousand points, and has now pulled back most of that rise. The key question remaining is: Is this pullback an opportunity to get in, or is it a continuation of the decline? The moving averages are in a bearish arrangement, with the price below the short-term moving averages, and the mid-term rebound momentum suppressed. The MACD has just seen the DIF cross above the DEA forming a weak golden cross, the bearish strength is diminishing, but it hasn't turned bullish yet. The Bollinger Bands are narrowing, with the price running between the lower and middle bands, volatility compressed to the extreme, often signaling that a big market movement is approaching. Overall: Short-term rebound demand exists, while the mid-term trend remains bearish.
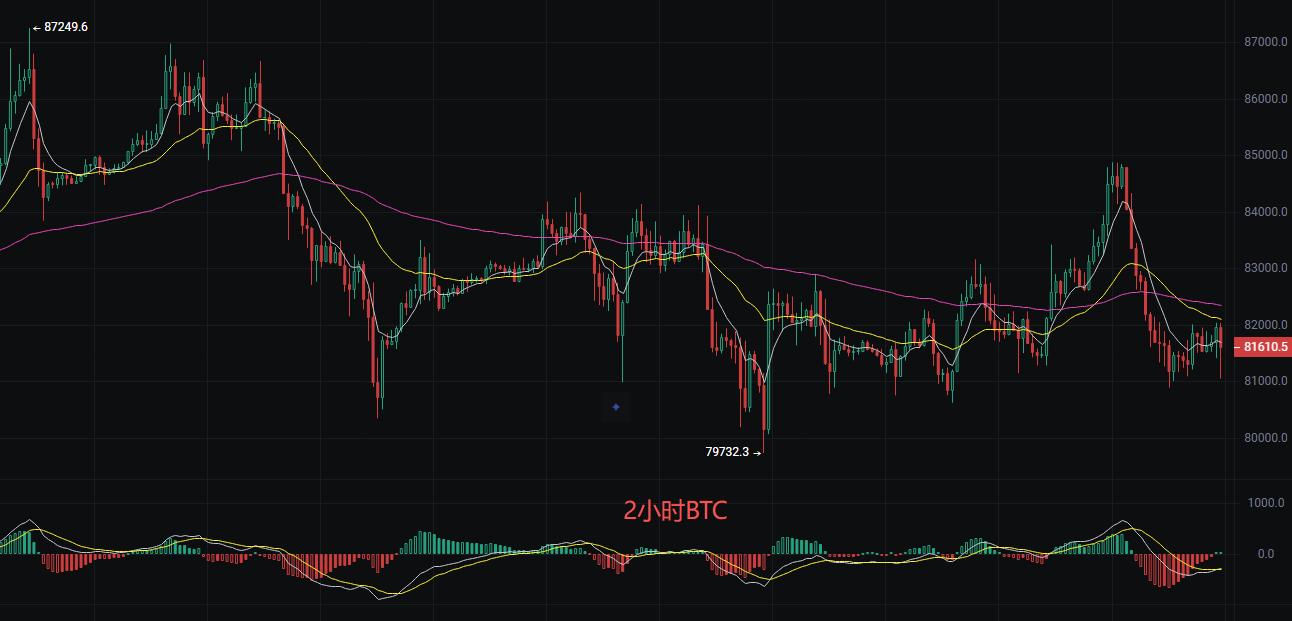
Two operating plans, strict stop-loss
Short positions: Enter short in batches at 82000-82400, stop-loss above 83000, targets at 81000, 80700, break below see 79800
Long positions: Only two entry points. One is to lightly enter at 80700-81000 for a rebound, stop-loss at 80200, target at 81800-82400; the second is to chase long positions if there’s volume stabilization above 82400, stop-loss at 81800, targets at 83000, 84800
Ethereum
Dear family, Ethereum is currently priced at 2404, let’s look at the chart to talk. Ethereum's recent movement has really tested people's patience. It has dropped from a high of 2578, and although there have been several rebounds in between, none have formed a significant trend. The price is now stuck at 2406, hovering near the middle of the Bollinger Bands. To put it simply, the current market is under pressure above and supported below, at a critical point of a potential trend change. The previous sharp drop has washed away much of the panic selling, and the trading volume has declined now, indicating fewer sellers, while buyers are still observing. The short-term moving averages show a desire for a rebound, but the mid-term trend remains under pressure. The price is moving between the middle band 2407 and the lower band 2369, with the lower band 2369 providing strong short-term support. As long as it does not break below the lower band, a bottom structure is brewing.
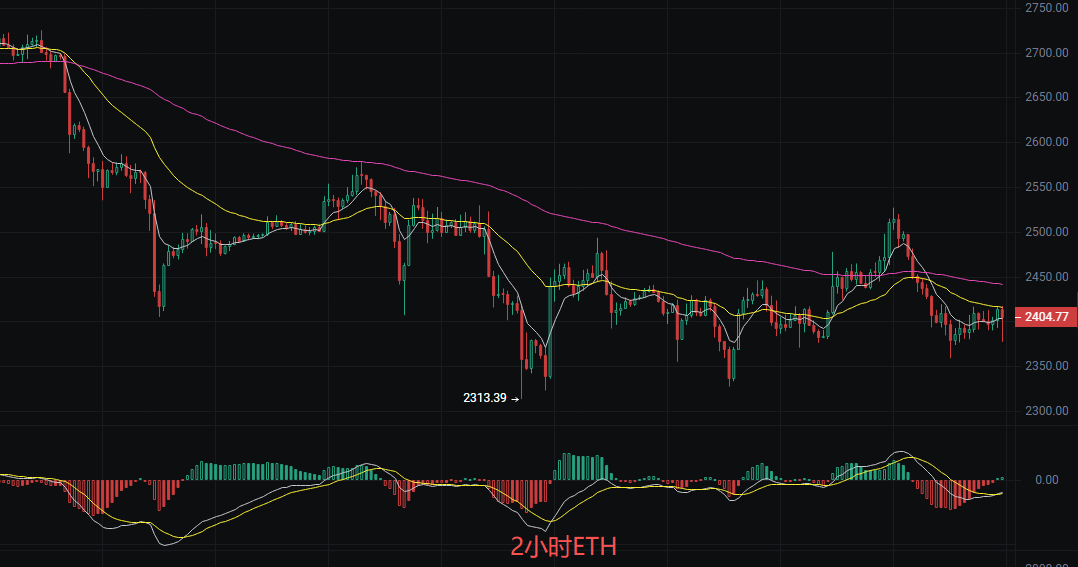
Long and short dual strategy
Long positions: Enter cautiously at 2370-2380 upon support, stop-loss at 2355. Aim for 2440, break above see 2480
Short positions: Enter short at 2445-2455 if faced with resistance during a rebound, stop-loss at 2470. Target back to 2410
Core logic: Relying on the lower Bollinger Band for the best long risk-reward ratio; the upper dense moving average area serves as strong resistance, maintain high selling and low buying until a breakthrough.
The above content is exclusively original by Liying, please indicate the source when reprinting! Article publication review has some delays, market conditions change rapidly, the above suggestions are for reference only, take risks at your own discretion.
Friendly reminder: The above content is only from Liying's official WeChat account: Crypto Training Camp, created by the author. The ads at the end of the article and in the comments section are unrelated to the author, please be cautious and discerning, thank you for reading.
免责声明:本文章仅代表作者个人观点,不代表本平台的立场和观点。本文章仅供信息分享,不构成对任何人的任何投资建议。用户与作者之间的任何争议,与本平台无关。如网页中刊载的文章或图片涉及侵权,请提供相关的权利证明和身份证明发送邮件到[email protected],本平台相关工作人员将会进行核查。