Crypto Circle Academician: On October 23, Ethereum (ETH) daily line broke and the four-hour bottoming is grinding, is Ethereum brewing an unseen trend change?
When I was writing this today, I was a bit stunned myself. Last year at this time, Ethereum was still fluctuating between one to two thousand. In the blink of an eye, it surged to two thousand eight and then fell back to two thousand four. It was more thrilling than a roller coaster ride. After trading for so long, my biggest realization is that the market specializes in all sorts of non-compliance. When you think it’s going to rise, it gives you a big bearish line; when you think it’s going to collapse, it quietly pulls back. Many people lose money not because they lack skills, but because they are too hasty and anxious, daring to go all-in after looking at a five-minute chart, panicking after a three-point drop. Let’s take it slow, there’s no hurry.
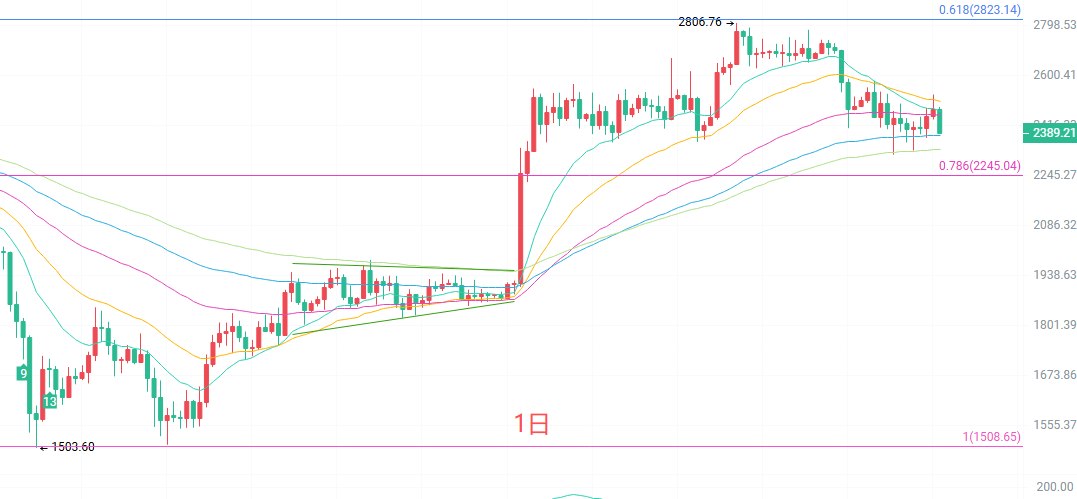
From the daily candlestick perspective regarding the moving average structure, the price has now broken below the EMA15 and EMA30, and the short-term moving averages are turning downwards, favoring the bears. But the good news is that below, EMA90 at 2382 and EMA120 at 2333 are still holding up, indicating that the mid-term trend hasn't completely deteriorated. After the MACD daily line death cross, the green bars continue to enlarge, indicating that the selling pressure hasn’t fully released. The middle line of the Bollinger Bands at 2507 has become resistance, while the lower line at 2291 is the last line of defense below. After this bearish line is completed, we enter a short-term consolidation phase; don’t rush to catch the bottom.
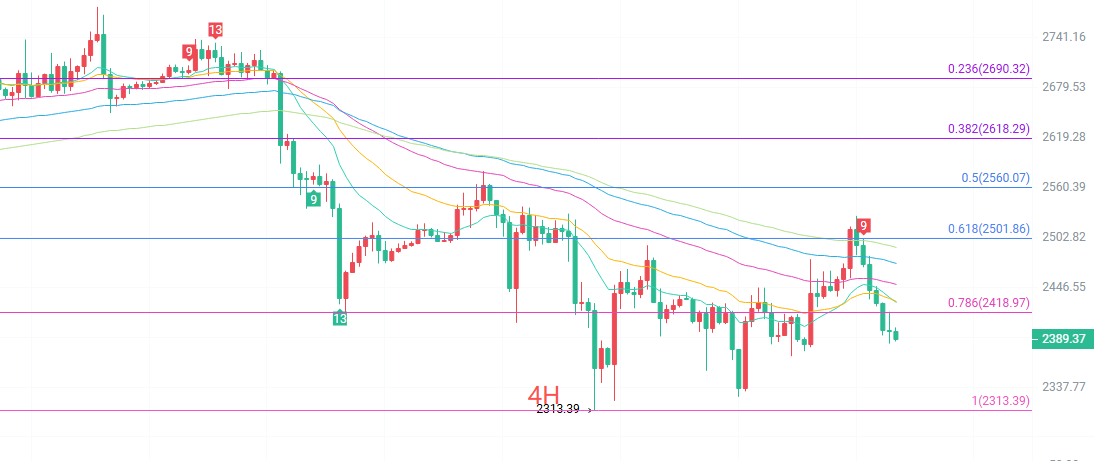
The four-hour candlestick has been trading within the narrow range of 2396 to 2401 for several consecutive candlesticks, with a volatility of only 0.19%, which is typical of a market that has difficulty falling further as it is bottoming. But be cautious, as all five EMAs are pressing down from above, with EMA15 at 2430, EMA30 at 2431, EMA60 at 2449, EMA90 at 2474, and EMA120 at 2492, each layer higher, blocking like stacking blocks above. There is a change on the MACD side, as the green bars are shortening, and the DIF is curling back from a low point, about to stick to the DEA. This is a signal that the downward trend is slowing. The Bollinger Bands have narrowed to between 2359 and 2502, with the middle line at 2430 being a must-reclaim position for bulls. The TD Nine's turn has reached 5; if a few more candlesticks don't make a new low, the rebound window will open. So the opportunity to rise is coming soon, be prepared.
Short-term reference:
Upwards resistance at 2370 to 2330, stop loss at 30 points, target at 2430 to 2520.
Downwards stagnation at 2460 to 2500, stop loss at 30 points, target at 2400 to 2370.
Specific operations should be based on real-time market data. For more detailed information, you can consult the author. There may be delays in article publication; suggestions are for reference only, risk is self-borne.
Warm reminder: The above content from the Crypto Circle Academician is updated simultaneously on major platforms such as Binance and others. More content can be followed on Binance Square, join my group chat.
免责声明:本文章仅代表作者个人观点,不代表本平台的立场和观点。本文章仅供信息分享,不构成对任何人的任何投资建议。用户与作者之间的任何争议,与本平台无关。如网页中刊载的文章或图片涉及侵权,请提供相关的权利证明和身份证明发送邮件到[email protected],本平台相关工作人员将会进行核查。