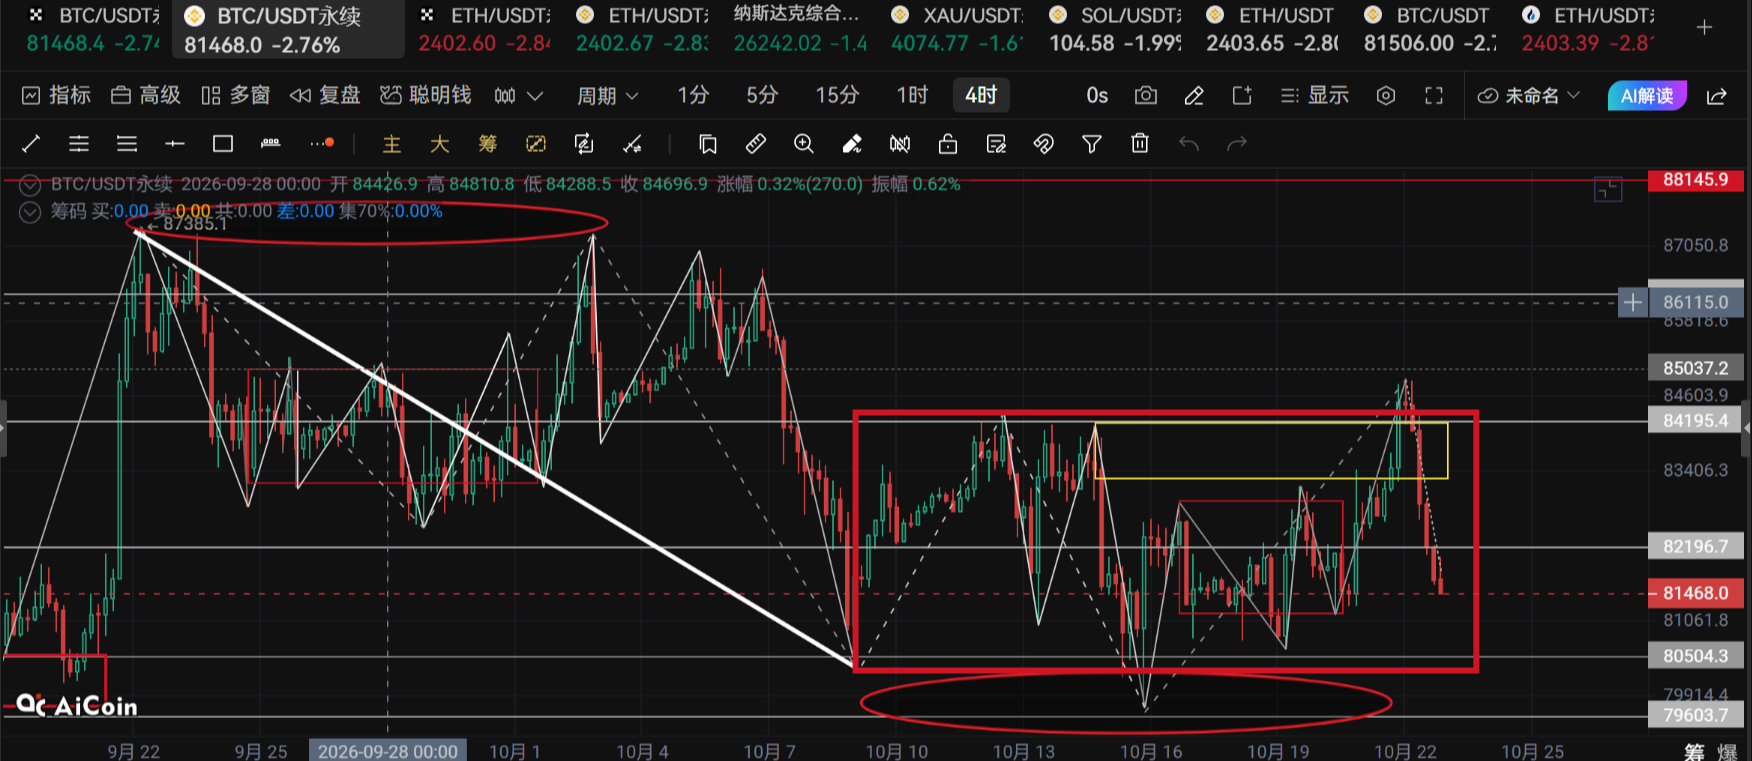
Crypto Circle Scholar: After the profit-taking concentration of Bitcoin (BTC) on October 23, is the market shaking to force retail investors to hand over their chips?
I particularly want to say to the brothers who just entered the market: Don't be scared out of your wits by one big bearish candle. If you look through every major bull market in BTC's history, there have been 20%-30% corrections along the way, and every time someone cries "the bull is dead," but in hindsight, they all turn out to be buying opportunities. On the other hand, I am not saying you should blindly buy the bottom at 80,000; if it truly falls below that meaningfully, it indicates a change in logic, and you still need to exit. My current status is: my position is not heavy, keeping some bullets reserved, with support and stop-loss levels marked on the chart. When the price hits those points, then act; if not, just enjoy your tea and watch the show. We will take our time, no rush.
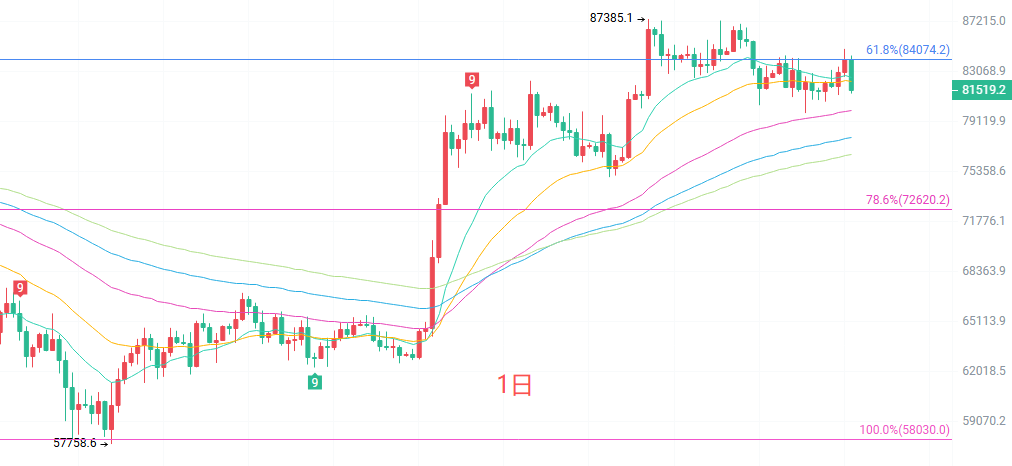
The daily K-line is still firmly above the EMA60 at 79,989. This moving average is the lifeline of the current upward trend, as it has not been effectively broken since the bottom in late June. The lower Bollinger band at 80,084 and EMA60 form strong support resonance near 80,000. Although the MACD has produced a death cross and turned green, both the DIF and DEA are still above the zero axis, indicating a pullback adjustment within a strong market, rather than a trend reversal. The TD count is at 1, and there is indeed some inertia for a short-term dip, but the space will not be too deep. My judgment is: at the daily K-line level, this is an intermediate pullback during an upward trend, and it is highly likely that the area around 80,000 can hold, after which new highs are expected.
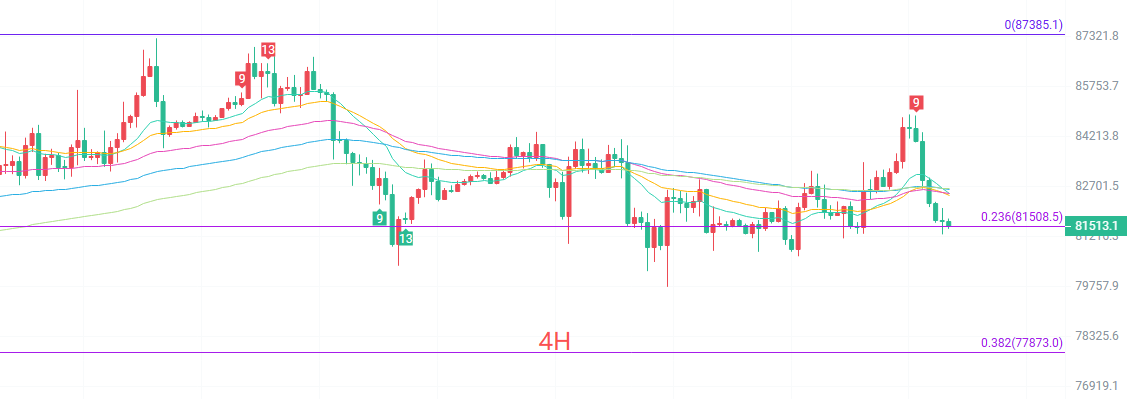
The four-hour K-line TD count is at 5, and technically the short-term overselling is starting to show, getting closer to the low point count for a reversal. The EMA15 and EMA120 clusters are at 82,500 and 82,630; while the price is pressed below, note that this group of moving averages is still diverging upward and has not formed a bearish arrangement, just a short-term larger deviation. The green MACD bars look alarming but have already been consolidating for several K-lines in the small range of 81,200 and 81,700, and the speed of decline has significantly slowed down, indicating that funds are picking up from below. The lower Bollinger band at 80,703 is the bullish defense line at the four-hour level. As long as 80,700 does not break, the four-hour chart could erupt into a rebound at any time, pulling the price back above the moving average cluster, so as long as the market does not break 80,000, it can try to build positions upward.
Short-term reference:
For an upward move from 81,000 to 80,500, obstacle, stop loss at 500 points, target at 82,600 to 83,600.
For a downward move from 83,200 to 83,600, stopped increasing, stop loss at 500 points, target at 82,500 to 81,600.
Specific operations should mainly depend on real-time market data; for more information, you can consult the author. The publication of this article has a time delay, and it is recommended for reference only, risks are borne by yourself.
Warm reminder: The above content is synchronized updated by the Crypto Circle Scholar on Binance, OKEx, and Huobi. For more content, follow Binance, and join the Binance group chat.
免责声明:本文章仅代表作者个人观点,不代表本平台的立场和观点。本文章仅供信息分享,不构成对任何人的任何投资建议。用户与作者之间的任何争议,与本平台无关。如网页中刊载的文章或图片涉及侵权,请提供相关的权利证明和身份证明发送邮件到[email protected],本平台相关工作人员将会进行核查。