Cryptocurrency Scholar: On October 22, Ethereum (ETH) made one bullish candlestick that swallowed three days of decline. Who is really defending the 2500 level?
I wrote this analysis without referencing anyone else's posts; I've just been thinking here. The market repeats the same story every day, just with different price tags: panic when it falls, greed when it rises, and restlessness during consolidation. But those who can actually make money from this market, like me, share a common trait: it’s not about how many times we are right, but rather that we incur less loss when we are wrong. At this level of 2500, I added to my position after going long at 1650; if I’m wrong, I’ll exit immediately, and if I’m right, I’ll continue to add. In trading, it never hurts to be humble.
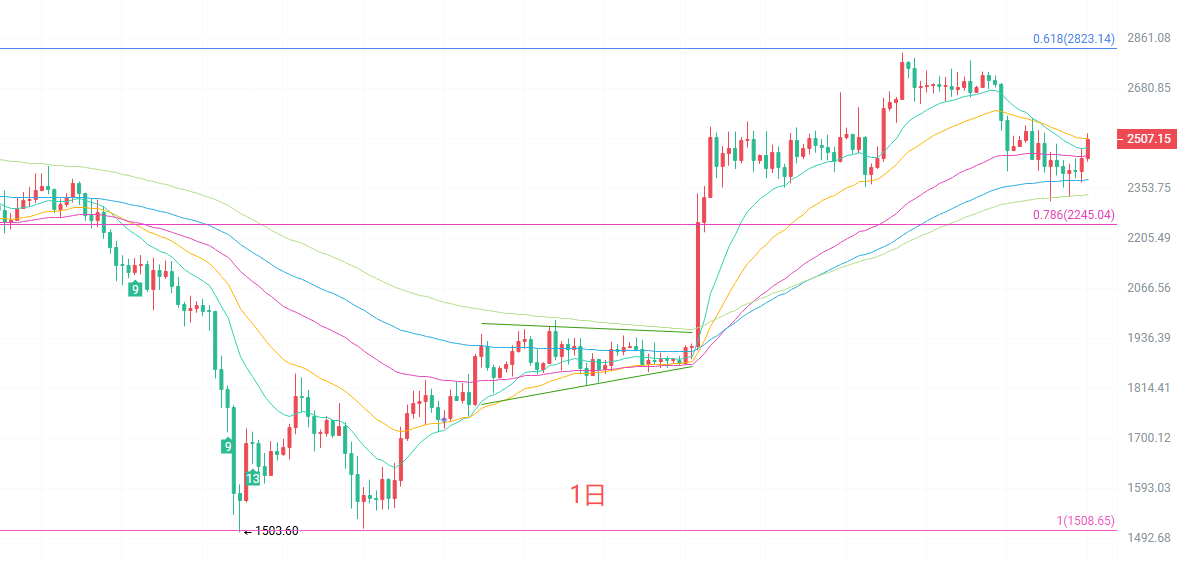
The daily candlestick has directly swallowed half of the previous days’ thinly traded bearish candle. From a structural perspective, the price has regained the EMA15, but it faces resistance at the EMA30 around 2510 and the middle Bollinger band at 2522, indicating a typical rebound to a critical resistance area. The MACD indicates that the DIF is still hovering below the zero line, and the green bars are shrinking consecutively, suggesting that bearish momentum is fading, but bullish reversals haven’t fully materialized yet. In short: the daily chart shows a stop-loss rebound, not a strong reversal. If it can’t push past 2522, this rebound will have to pause.
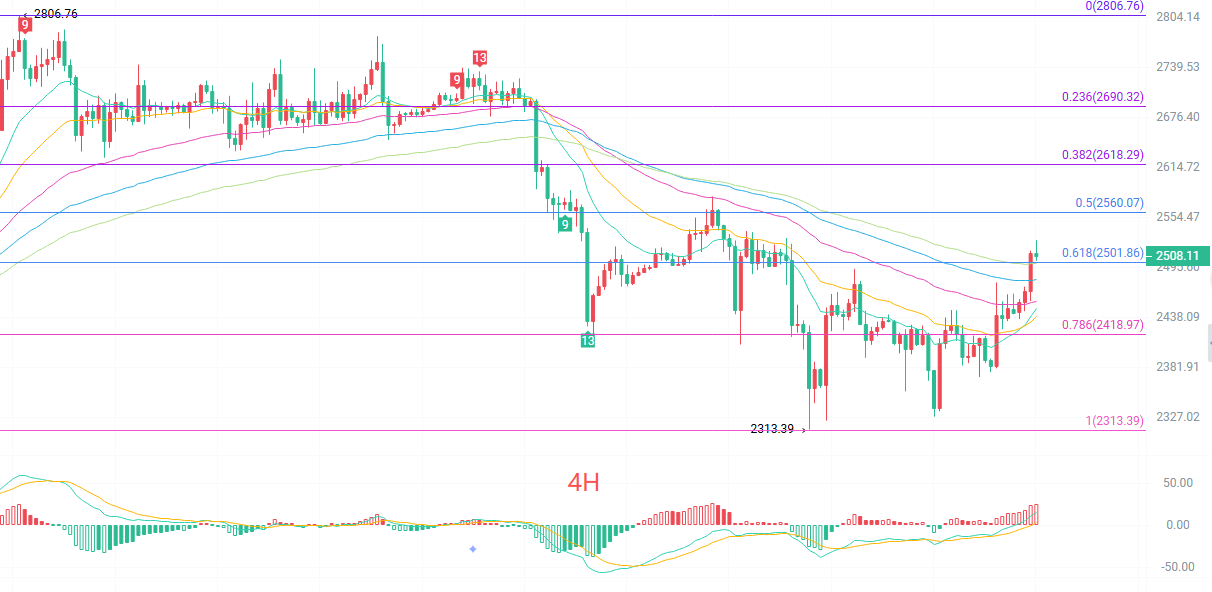
The four-hour chart looks much more optimistic. The price has risen from the low of 2313, breaking through the EMA9 and EMA120 along the way, and now stands firmly above all short to medium-term moving averages, signaling the first sign of strength at the four-hour level. More importantly, the current price of 2504 has already touched the upper Bollinger band at 2506, with the opening expanding, and the MACD red bars lengthening, indicating that bullish momentum is being released. However, let me cool down the enthusiasm: running right next to the upper Bollinger band leaves a short-term need for a pullback to the middle band at 2424, suggesting a small correction may be on the horizon.
Short-term reference:
Going long from 2480 to 2430 met resistance, stop loss at 30 points, target at 2520 to 2550.
Going short from 2520 to 2550 showed stagnation, stop loss at 30 points, target at 2480 to 2460.
Specific operations should primarily depend on real-time market data. For more information, you can consult me. The publication of the article has a time delay; it is suggested for reference only, and the risk is borne by the reader.
Friendly reminder: The above content is synchronously updated by the Cryptocurrency Scholar on Binance, OKEx, and Huobi. For more practical details, you can message me on the platform.
免责声明:本文章仅代表作者个人观点,不代表本平台的立场和观点。本文章仅供信息分享,不构成对任何人的任何投资建议。用户与作者之间的任何争议,与本平台无关。如网页中刊载的文章或图片涉及侵权,请提供相关的权利证明和身份证明发送邮件到[email protected],本平台相关工作人员将会进行核查。