Cryptocurrency Expert: The Consequences of the Large Divergence of Bitcoin (BTC) on 10.22! After this bullish candlestick, how will the market repay its debts?
I often say one thing: the two most expensive words in trading are "I knew early." If I had known to go all in at 81,000 points, if I had known to clear out at 87,000 points — but no one knew early, not you, not me, no one does. What we can do is dare to enter the market when the chart gives a signal and dare to exit when the chart turns bad. I've seen too many people make twenty points on a trend and not take profits, ultimately losing ten points and cutting losses at the bottom. I started reminding everyone to head north before the price dropped below 60,000, but there were people leading the discussion saying it would drop to 30,000.
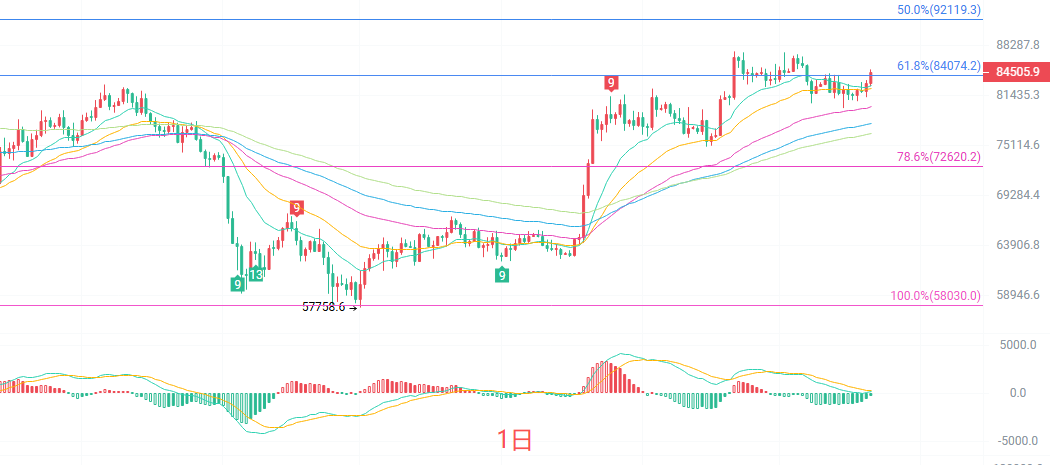
The daily candlestick firmly stands above five moving averages in a bullish arrangement, and the mid-term trend structure has not broken down. The MACD shows green columns which have clearly narrowed, reflecting high-level digestion after retracing from the previous high of 87,385; it is not a death cross indicating a trend reversal. The Bollinger Bands are opening and flattening, with the middle band at 83,224 supporting the price, while the upper band at 86,231 is the first level of resistance this week. The TD Sequential has just recounted to the 2nd candlestick at the bottom, indicating that this main uptrend from 57,758 has not yet given a signal of a top on the daily level, but the short-term deviation has become too large after a continuous rise, making chasing prices not cost-effective.
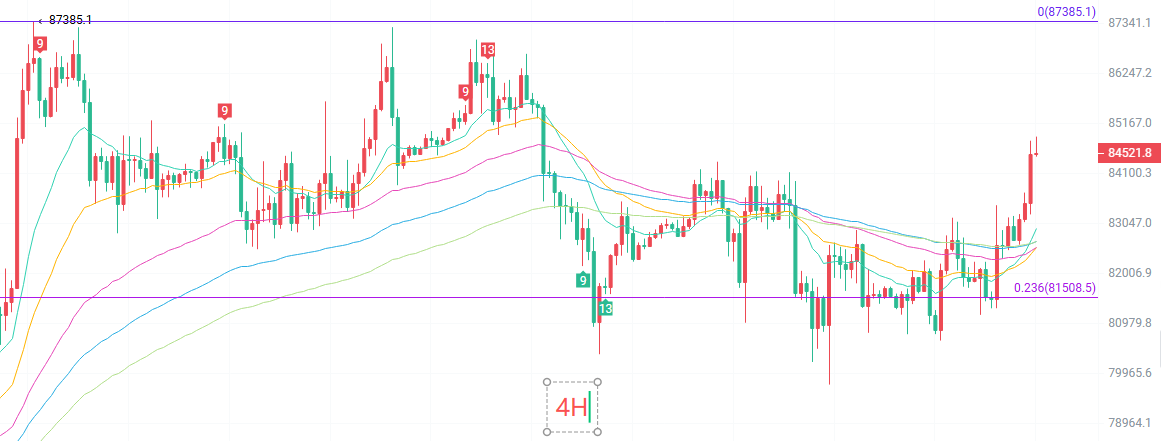
The four-hour candlestick has just broken through the upper Bollinger Band at 84,333. The moment the upper band is breached means short-term bullish momentum is being released again. The MACD shows a golden cross at the four-hour level, with the red columns continuing to expand; this is a typical feature of short-term strength. Moreover, it is noteworthy that the TD Sequential has counted to the 8th candlestick; according to the rules, if the next candlestick continues to close bullish, it will reach 9, and after hitting 9, there is often a pullback for confirmation. The price has recently risen significantly from the bottom of 81,127, consuming nearly 3,000 points in just a few days, and is currently topping out at the lower edge of the previous trading zone of 85,700–86,000.
Short-term reference:
Going north, if blocked at 83,500 to 83,000, stop loss at 500 points, target looking at 85,500 to 86,500.
Going south, if stagnating at 86,000 to 86,500, stop loss at 500 points, target looking at 85,000 to 84,300.
Specific operations are based on real-time market data; for more details, you can consult me. The article is published with a delay; suggestions are for reference only and risks are at your own expense.
Friendly reminder: The above content from Cryptocurrency Expert is synchronized and updated on Binance, OKEx, and Huobi, with more practical details available by private message on various platforms.
免责声明:本文章仅代表作者个人观点,不代表本平台的立场和观点。本文章仅供信息分享,不构成对任何人的任何投资建议。用户与作者之间的任何争议,与本平台无关。如网页中刊载的文章或图片涉及侵权,请提供相关的权利证明和身份证明发送邮件到[email protected],本平台相关工作人员将会进行核查。