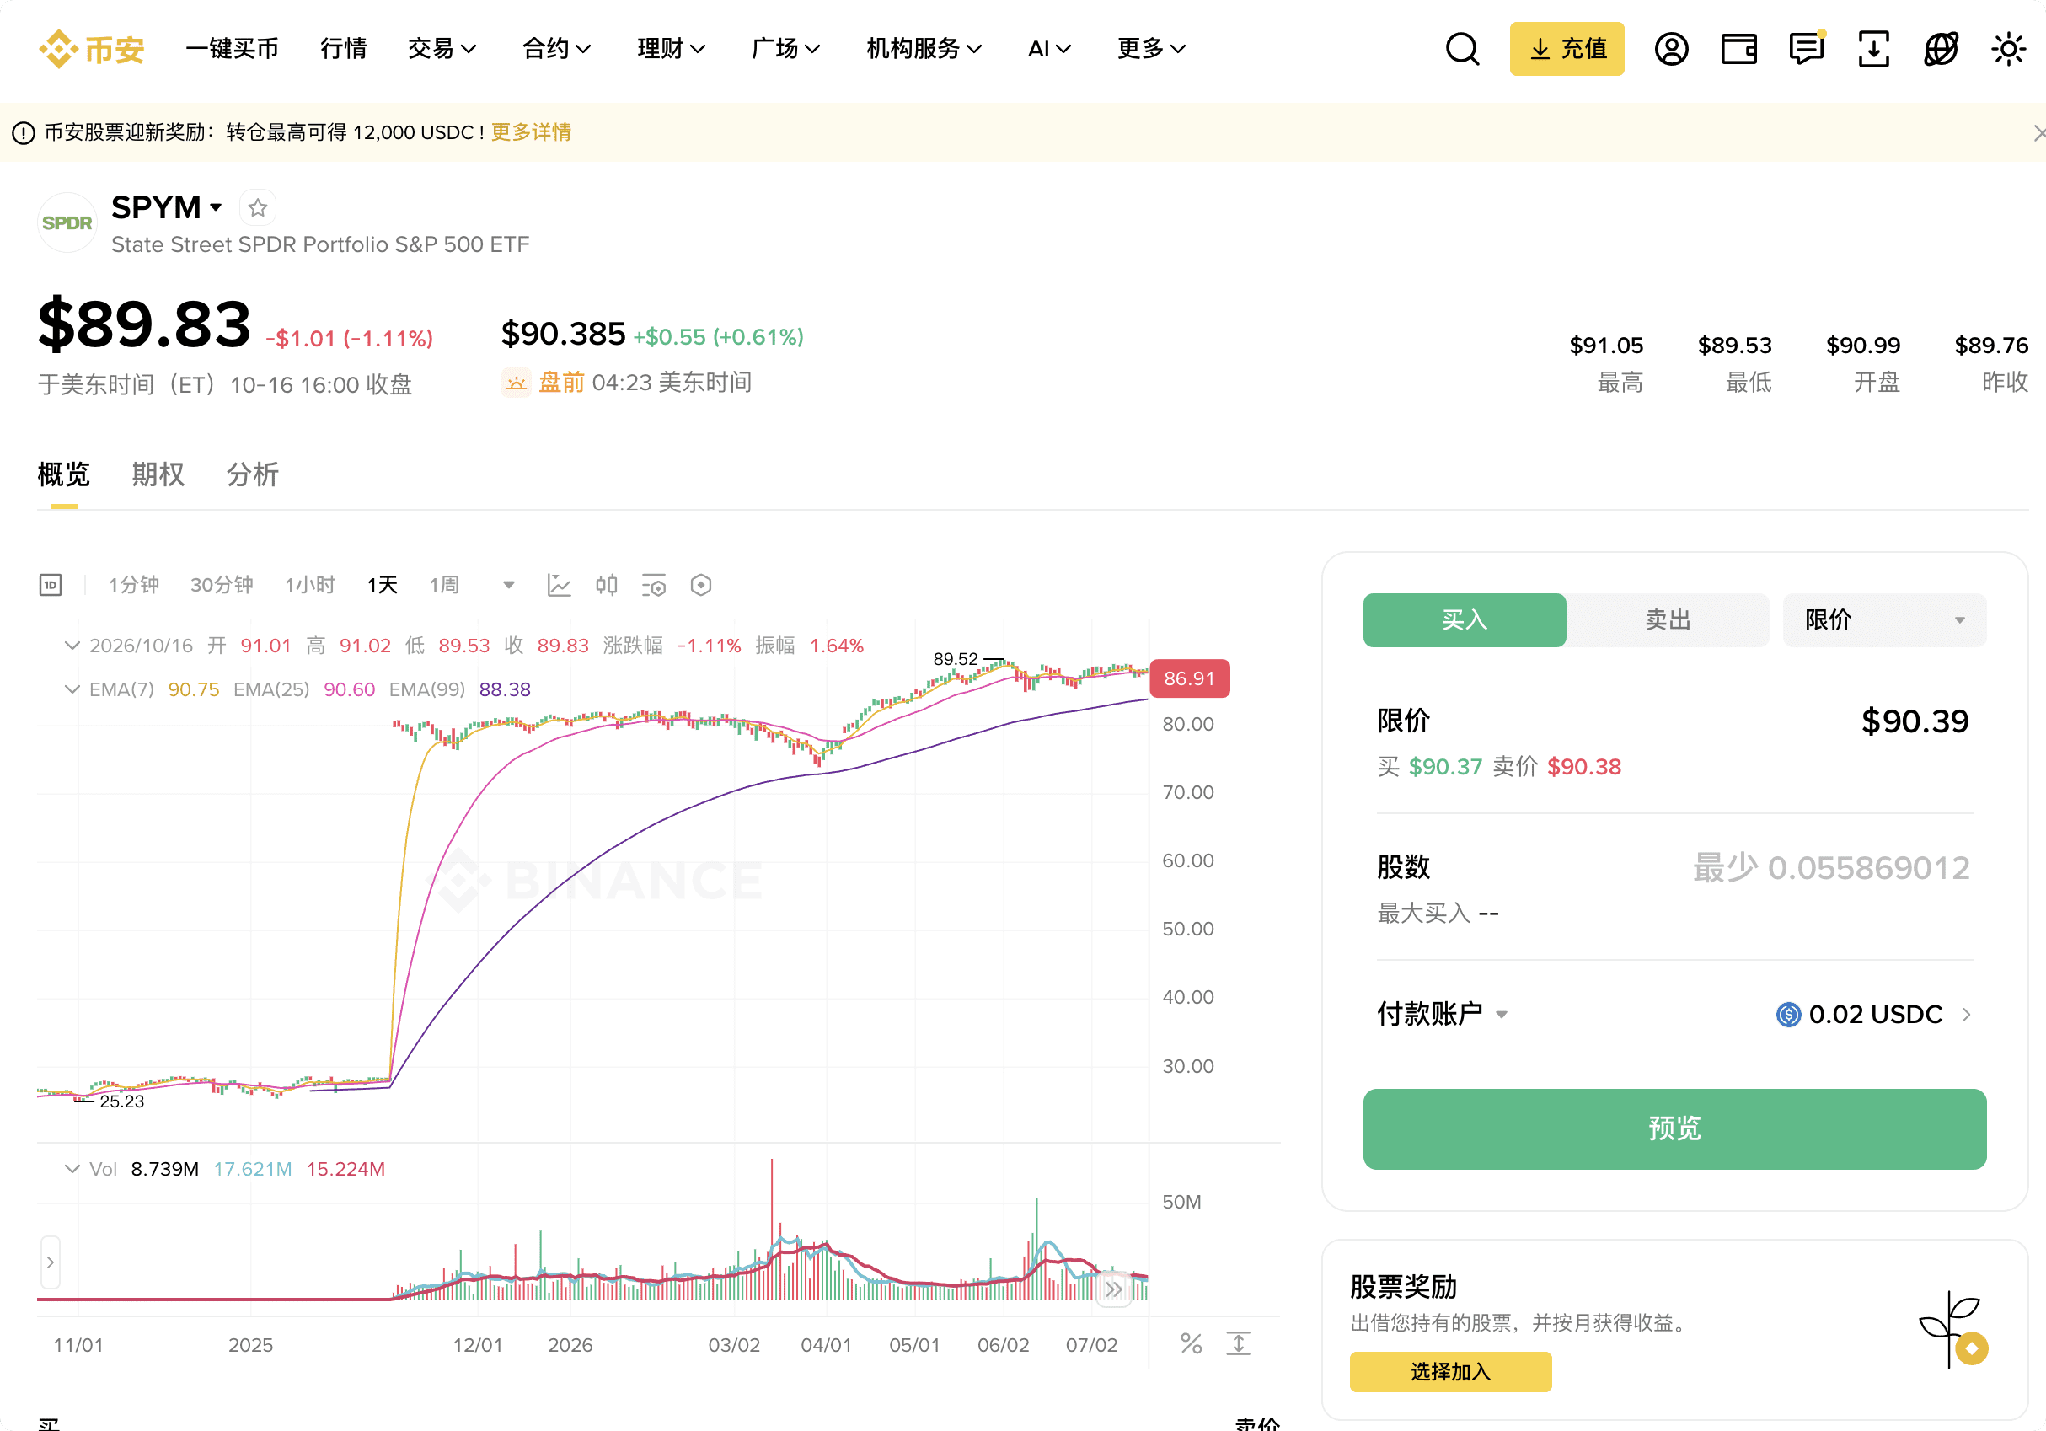
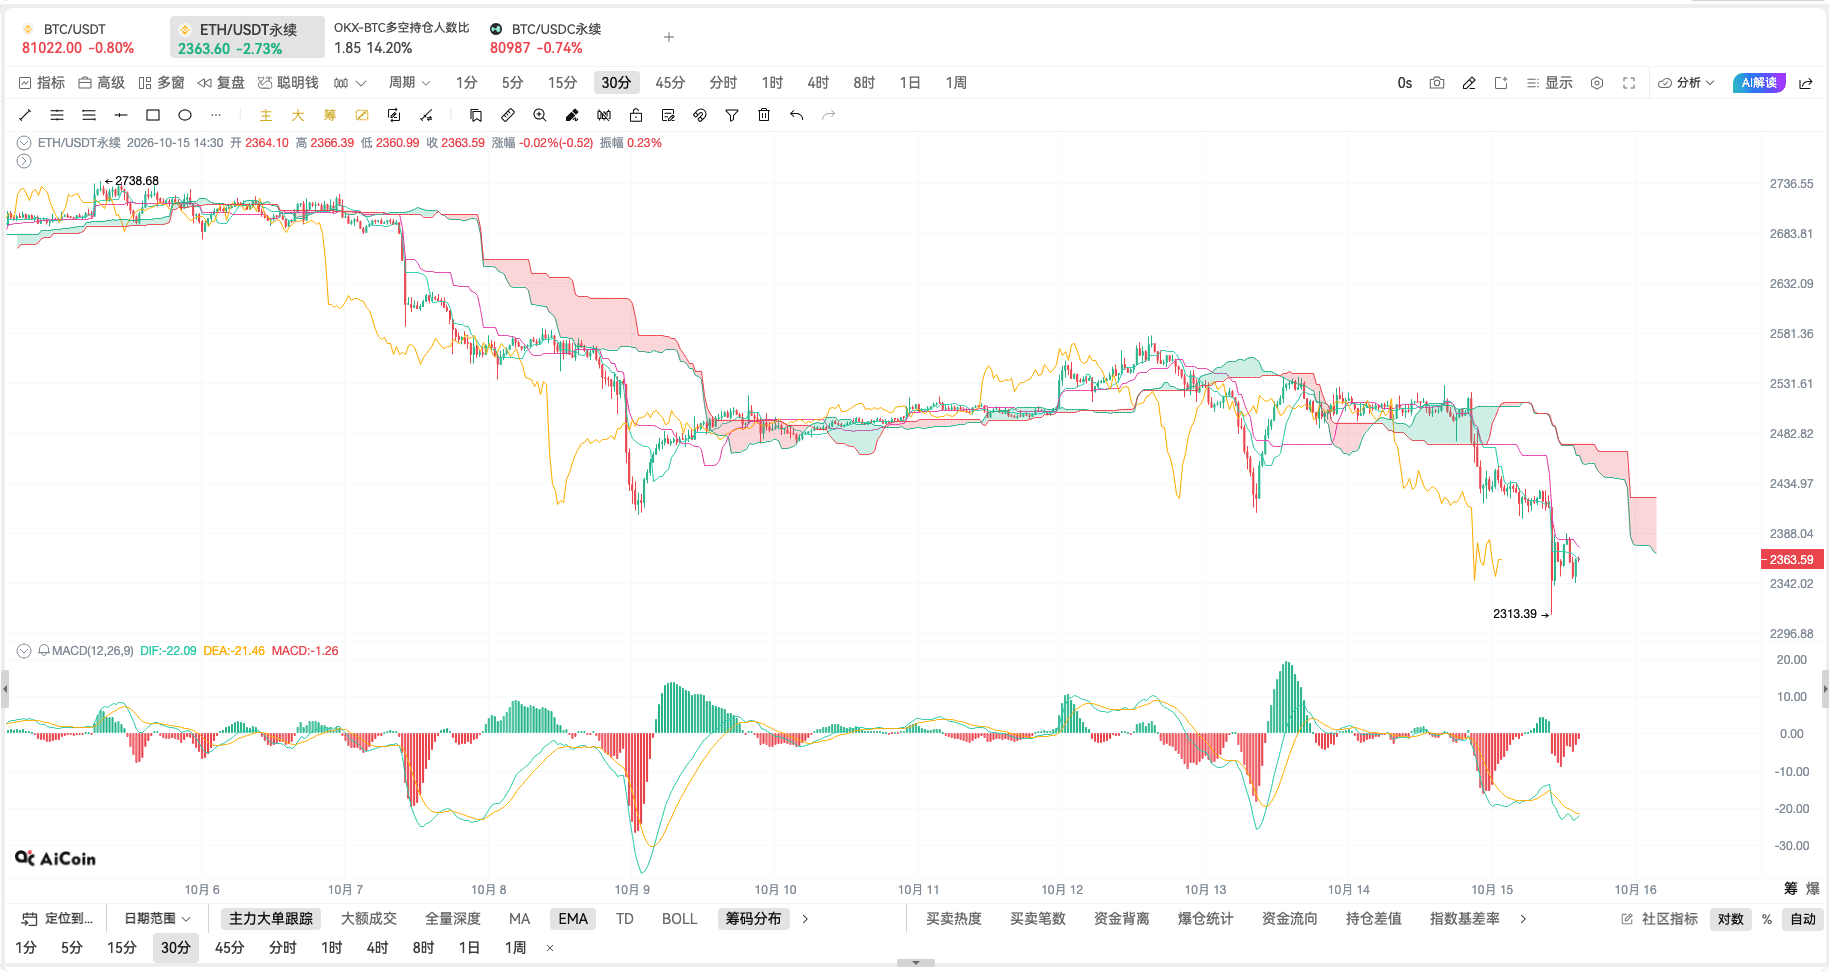
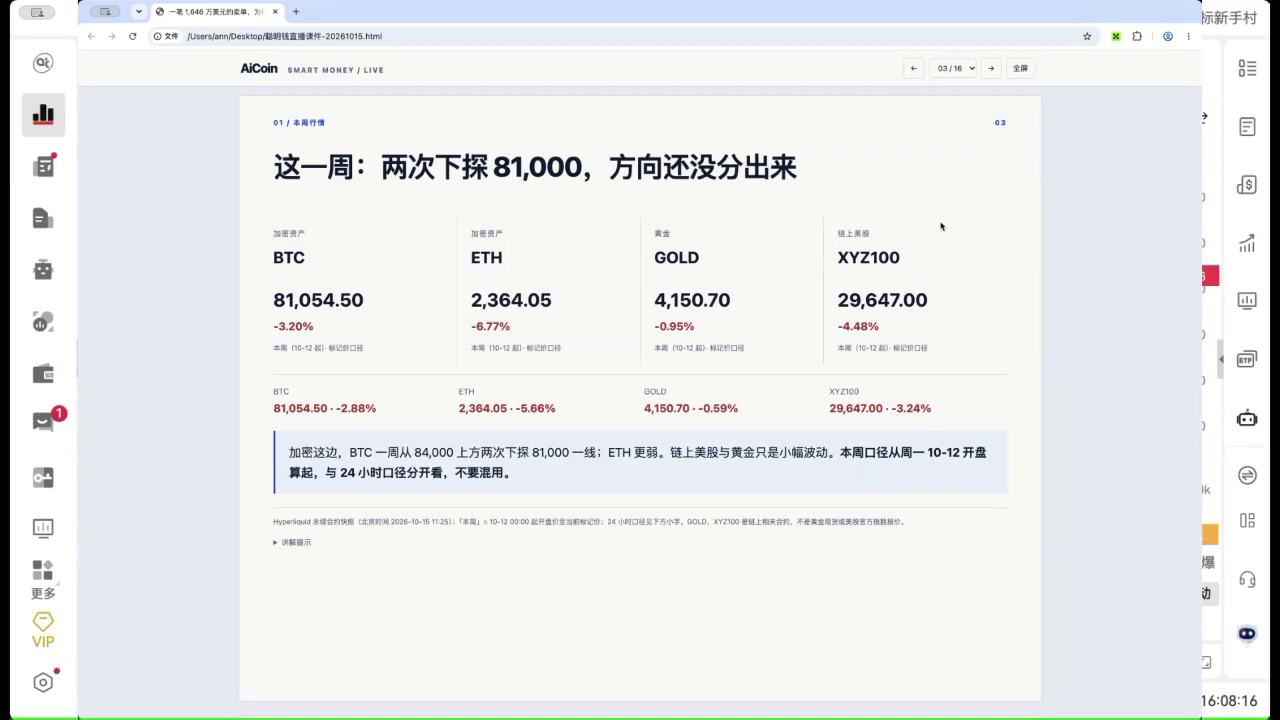
The market is neither rising nor falling, fluctuating back and forth, and manually making a few trades easily leads to chasing highs and cutting losses. At this time, we can change our thinking: instead of rushing to guess where the next K line will go, we can take advantage of the fluctuations within a certain range. Today, let's talk about the grid strategy and see how it executes buying low and selling high, while also clarifying the areas where it can easily incur losses. The market and profit screenshots in this article are historical examples used for this teaching.
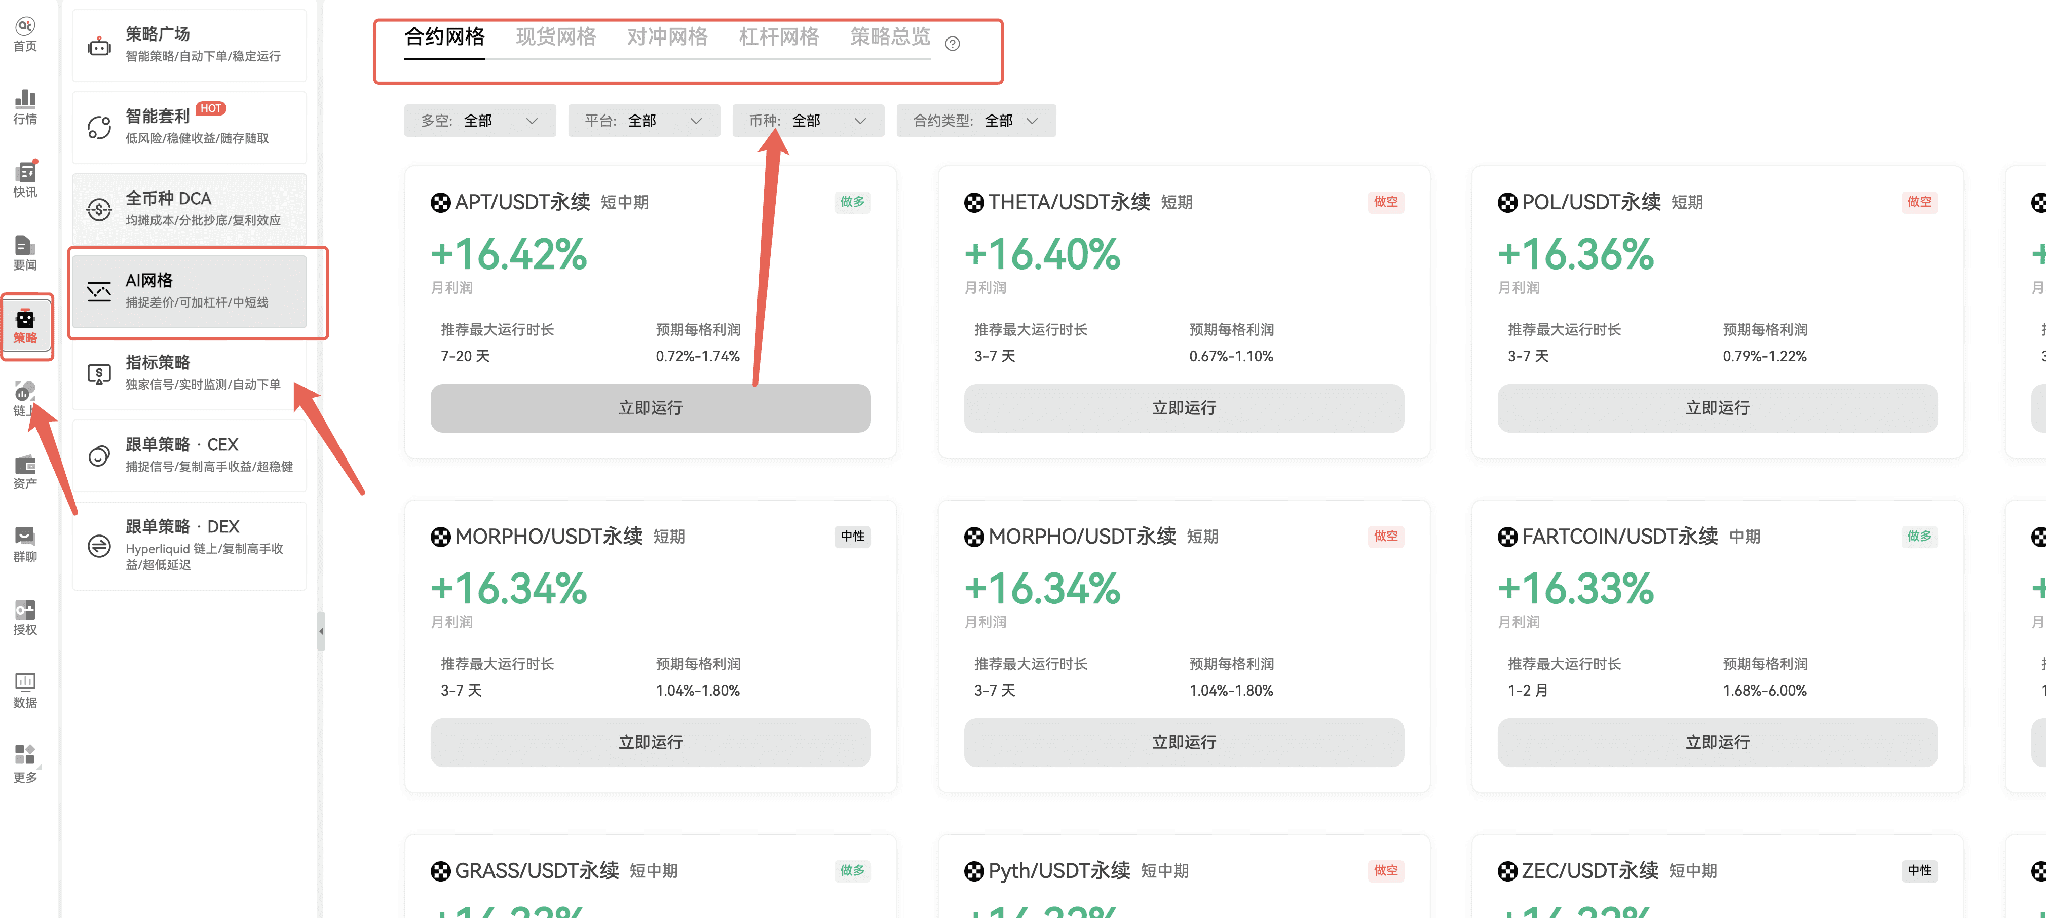
In the product, find "Strategy - AI Grid," and you will see plenty of ready-made templates. The entry is easy to find, and placing orders is convenient, but don't rush to click yet. The automatic execution is only based on the rules we set, and whether the rules are suitable still needs our judgment.
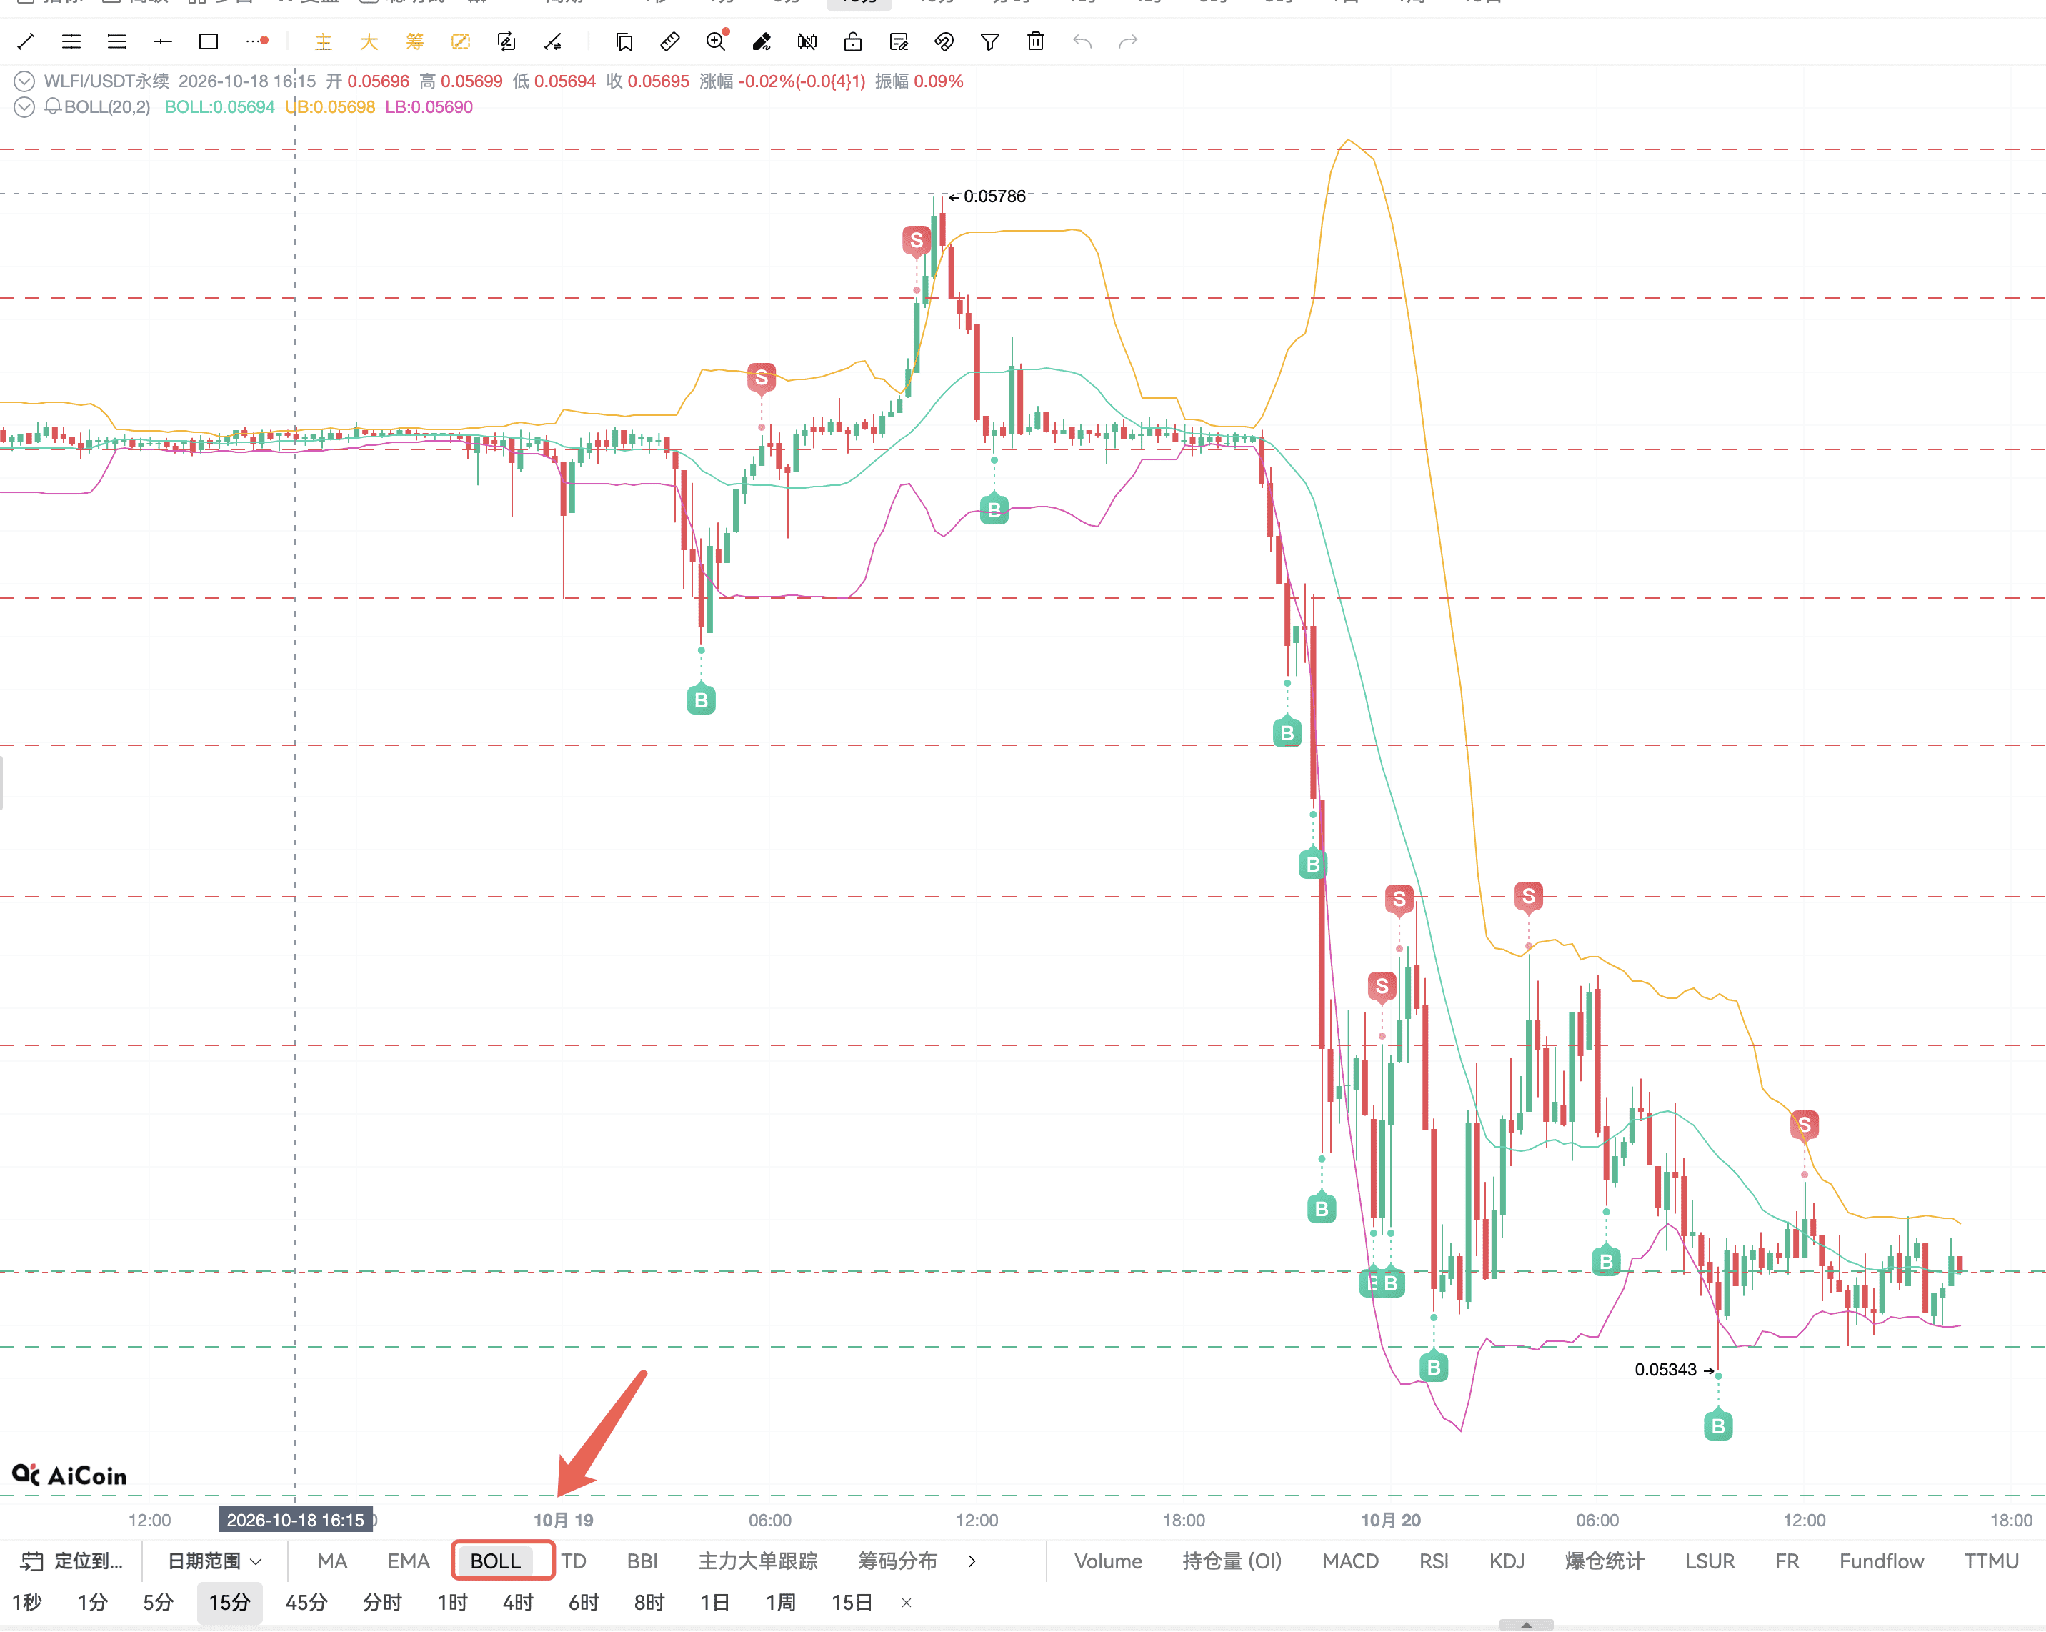
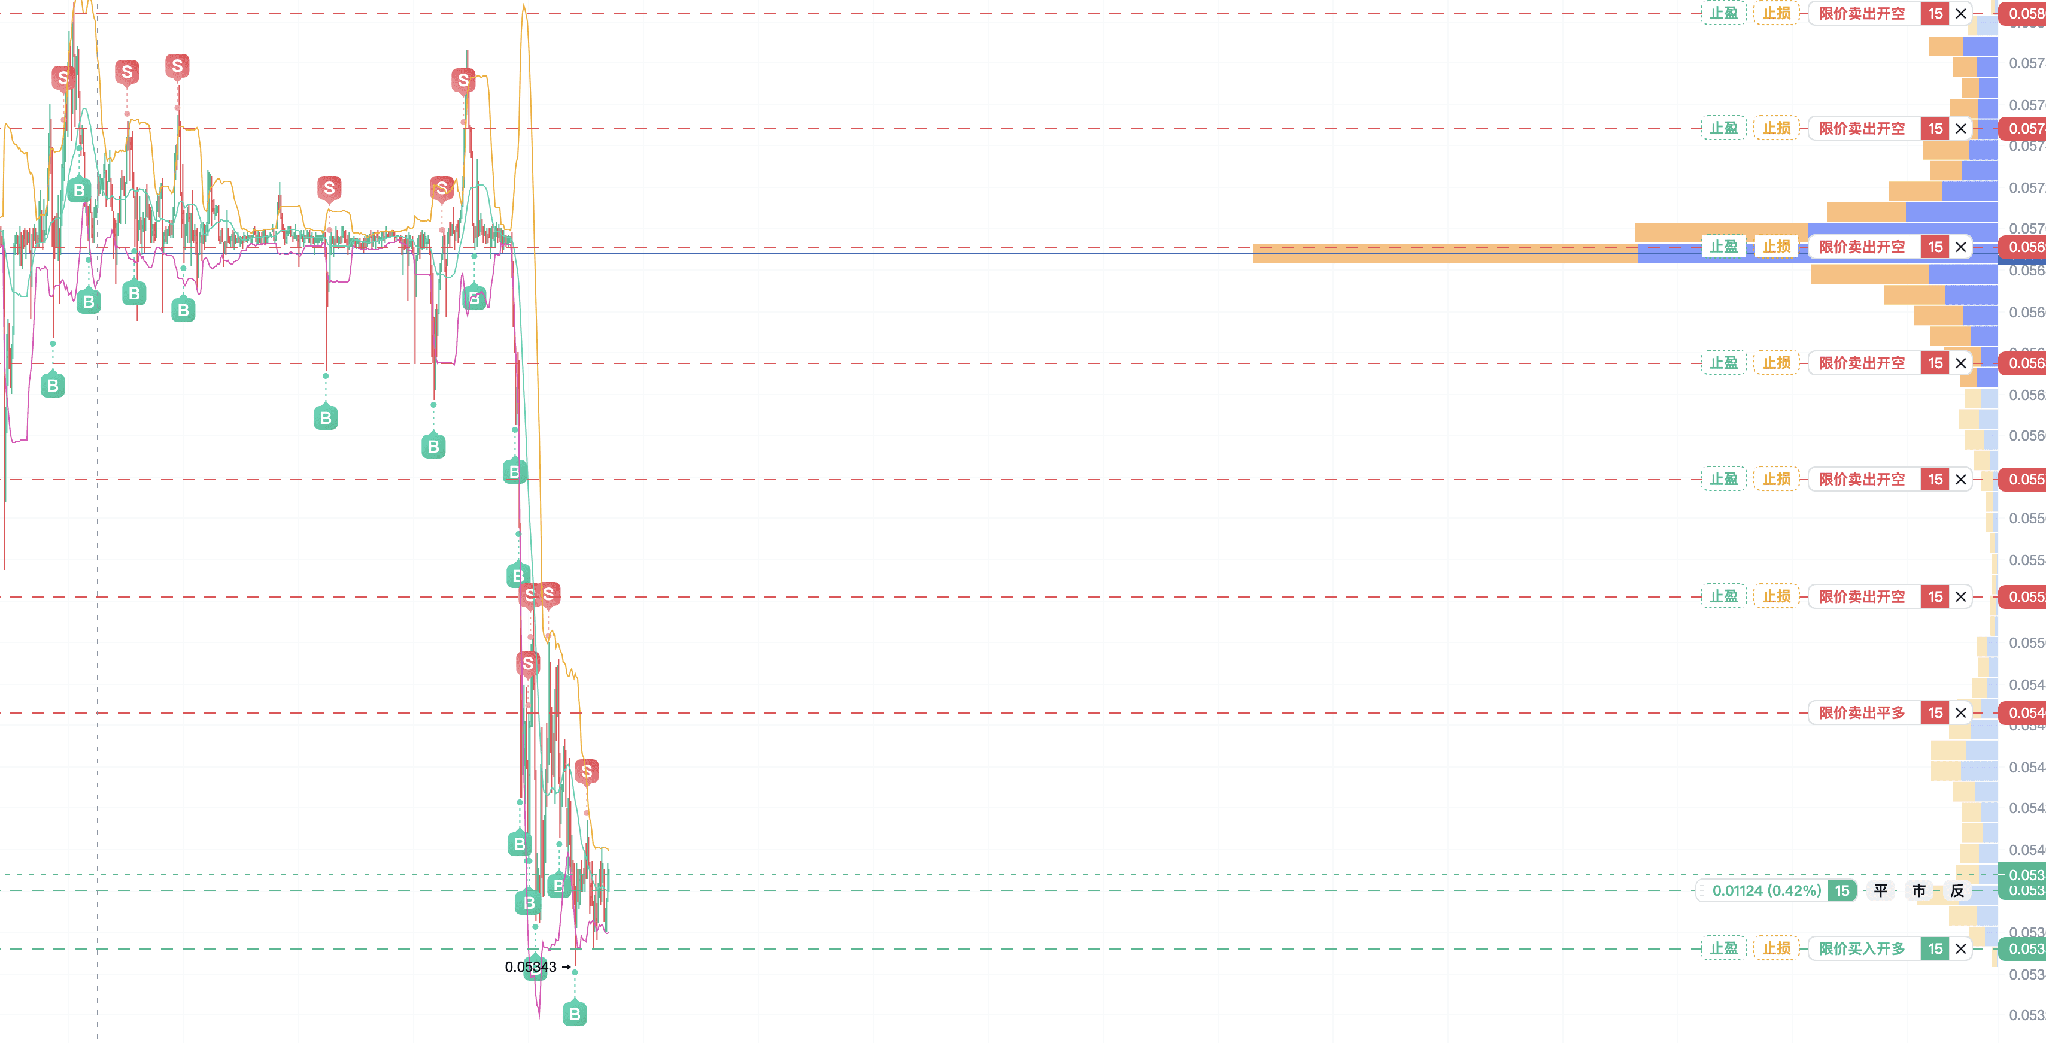
The grid can be understood as an automatic trading program that operates according to price levels. Once you set the range and spacing, it will execute according to the rules without us having to sit at the screen placing orders one by one. Looking at a grid I used before, the additional horizontal dashed lines on the K-line chart represent the grid lines.
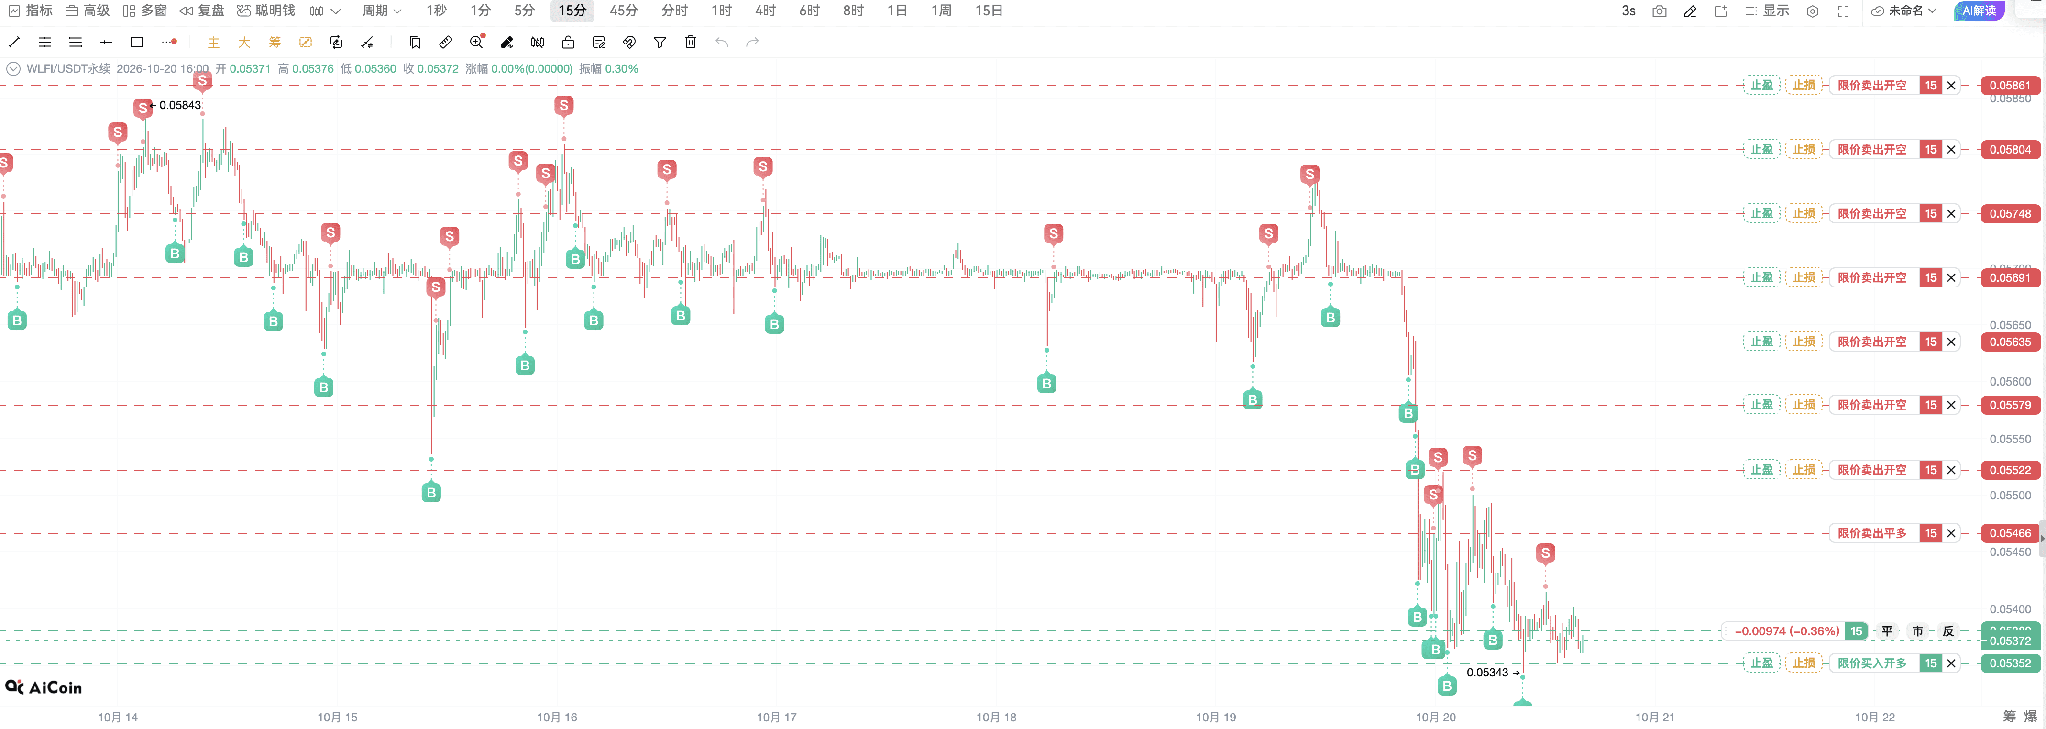
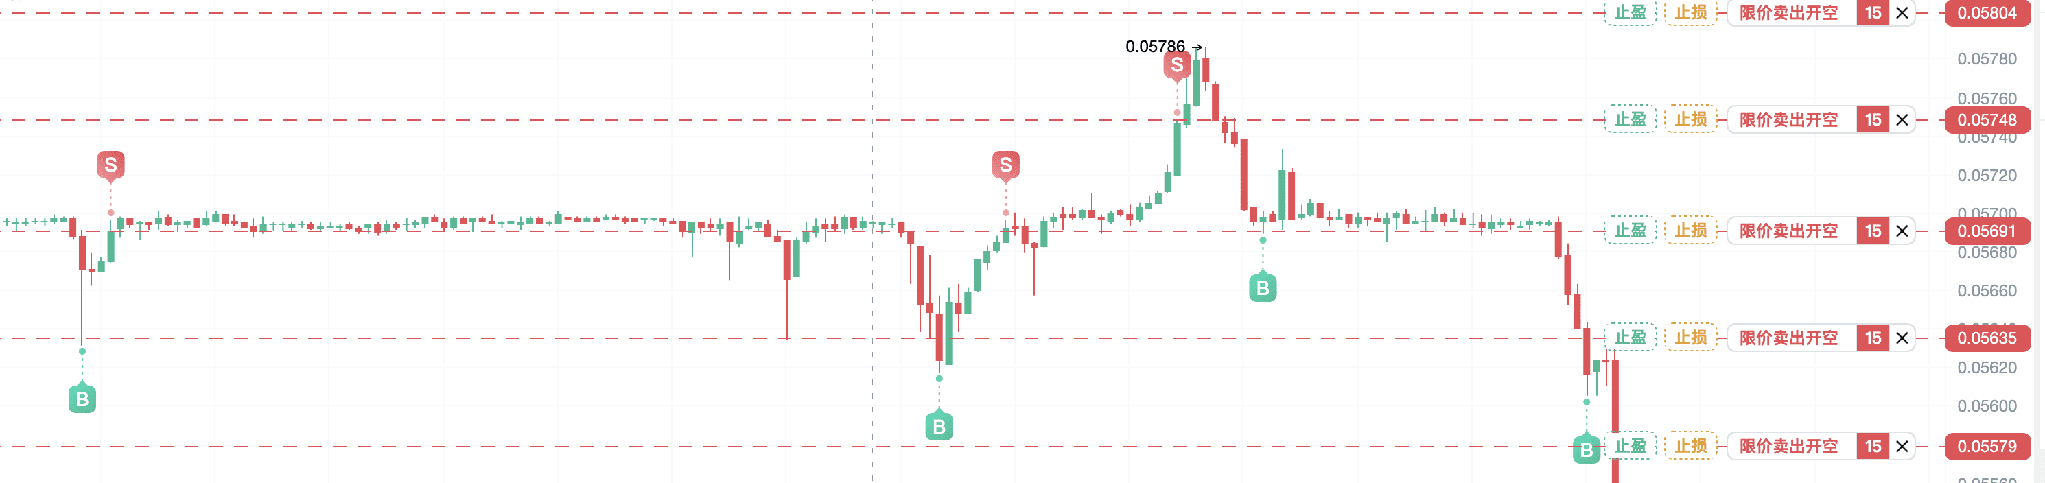
Zooming in on a segment of the trend makes the trading actions easier to understand. As the price moves back and forth between different levels, the system arranges corresponding buys and sells, opening or closing positions based on the strategy direction and existing positions. Touching a line does not mean opening a new position every time.
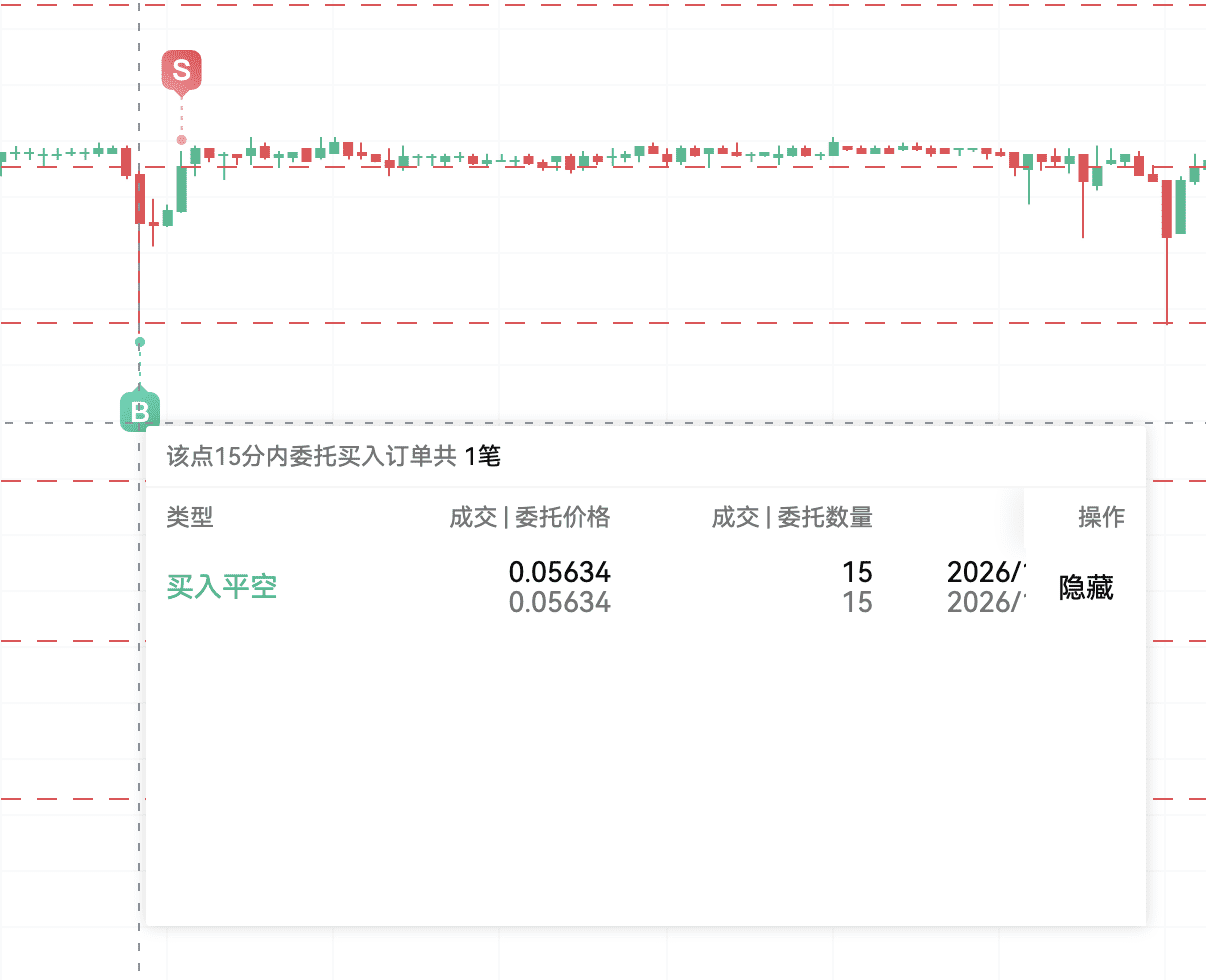
In this transaction detail, 0.05634 corresponds to buying back to close a short position, meaning to buy back the previous short position.
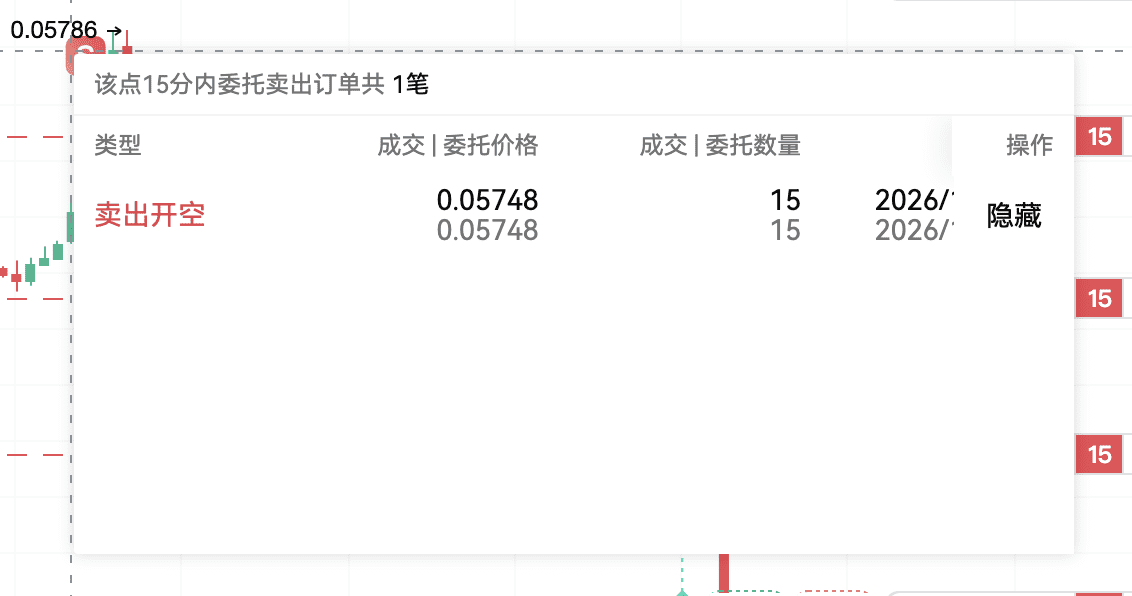
Looking at another example, 0.05748 was a sell to open a short position.
Later, as the price fell back, it bought back to close the short at 0.05691, completing this set of opening and closing positions. Here, the profit is the price difference between the two transactions, and trading fees need to be deducted. The earlier image at 0.05634 shows another transaction; you cannot just stitch together screenshots to form the same round of trading.
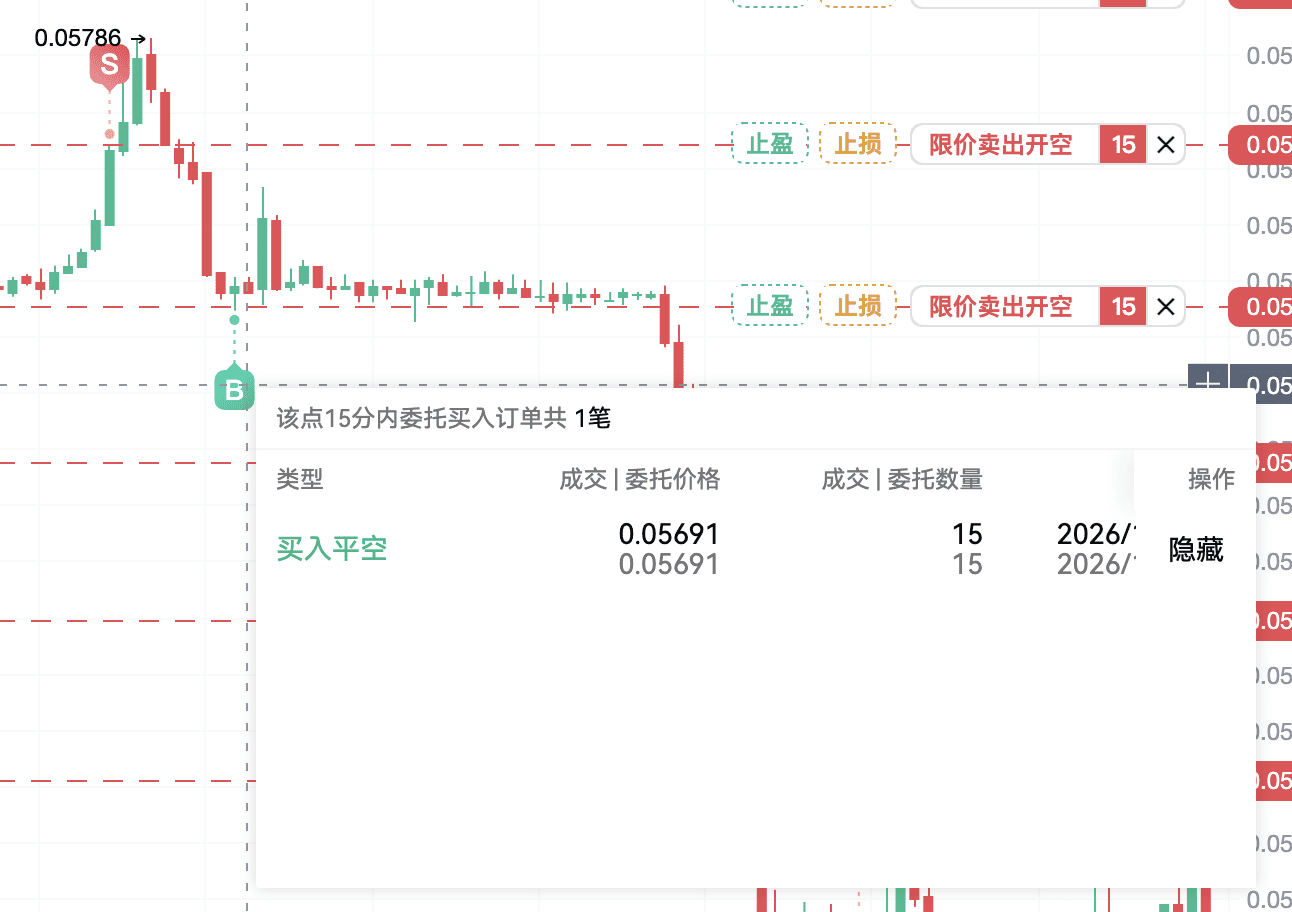
This demonstration shows a neutral contract grid, which can arrange buying and selling positions across different price levels. Buying down and selling up is one pairing approach; a short position can be sold first and then bought back at a lower price. The grid has opportunities to continuously pair as the price passes through these levels repeatedly.
It is not like buying spot at a low price, waiting for a big rise before selling, making profits from smaller fluctuations repeatedly. When the market fluctuates within a range, this mechanism functions relatively easily; however, if it encounters a continuous unidirectional trend, the grid won’t be as comfortable.
When the price keeps moving in one direction, it might leave an increasing number of unpaired positions, and floating losses will accumulate, potentially breaching the original range. If leverage is used, there will also be a risk of forced liquidation. The extent of losses depends on the direction, range, positions, and leverage; it cannot be generically said that it is necessarily worse than buying spot.
I conducted a demonstration with around 100 USDT, and the screenshot shows a total investment of about 112.26 USDT at the time, with total profits around 3.085 USDT, of which the grid profit was about 3.121 USDT, and the floating profit and loss was approximately negative 0.03612 USDT.

These figures are worth looking at separately. The grid profits earned from pairing do not equal the total profits of the entire strategy. The floating profits and losses of positions, transaction fees, and cost of capital can all affect the final outcome. This is just a snapshot from that time and cannot be used to infer a "fixed daily profit." Watching small profits accumulate bit by bit can feel pleasant, but if a unidirectional trend enlarges the floating losses, the previous profits might also get swallowed.
Therefore, even after activating the grid, management is still necessary. The labels in the strategy list, such as "short-term, mid-short-term, mid-term, long-term," serve as easy-to-overlook references.
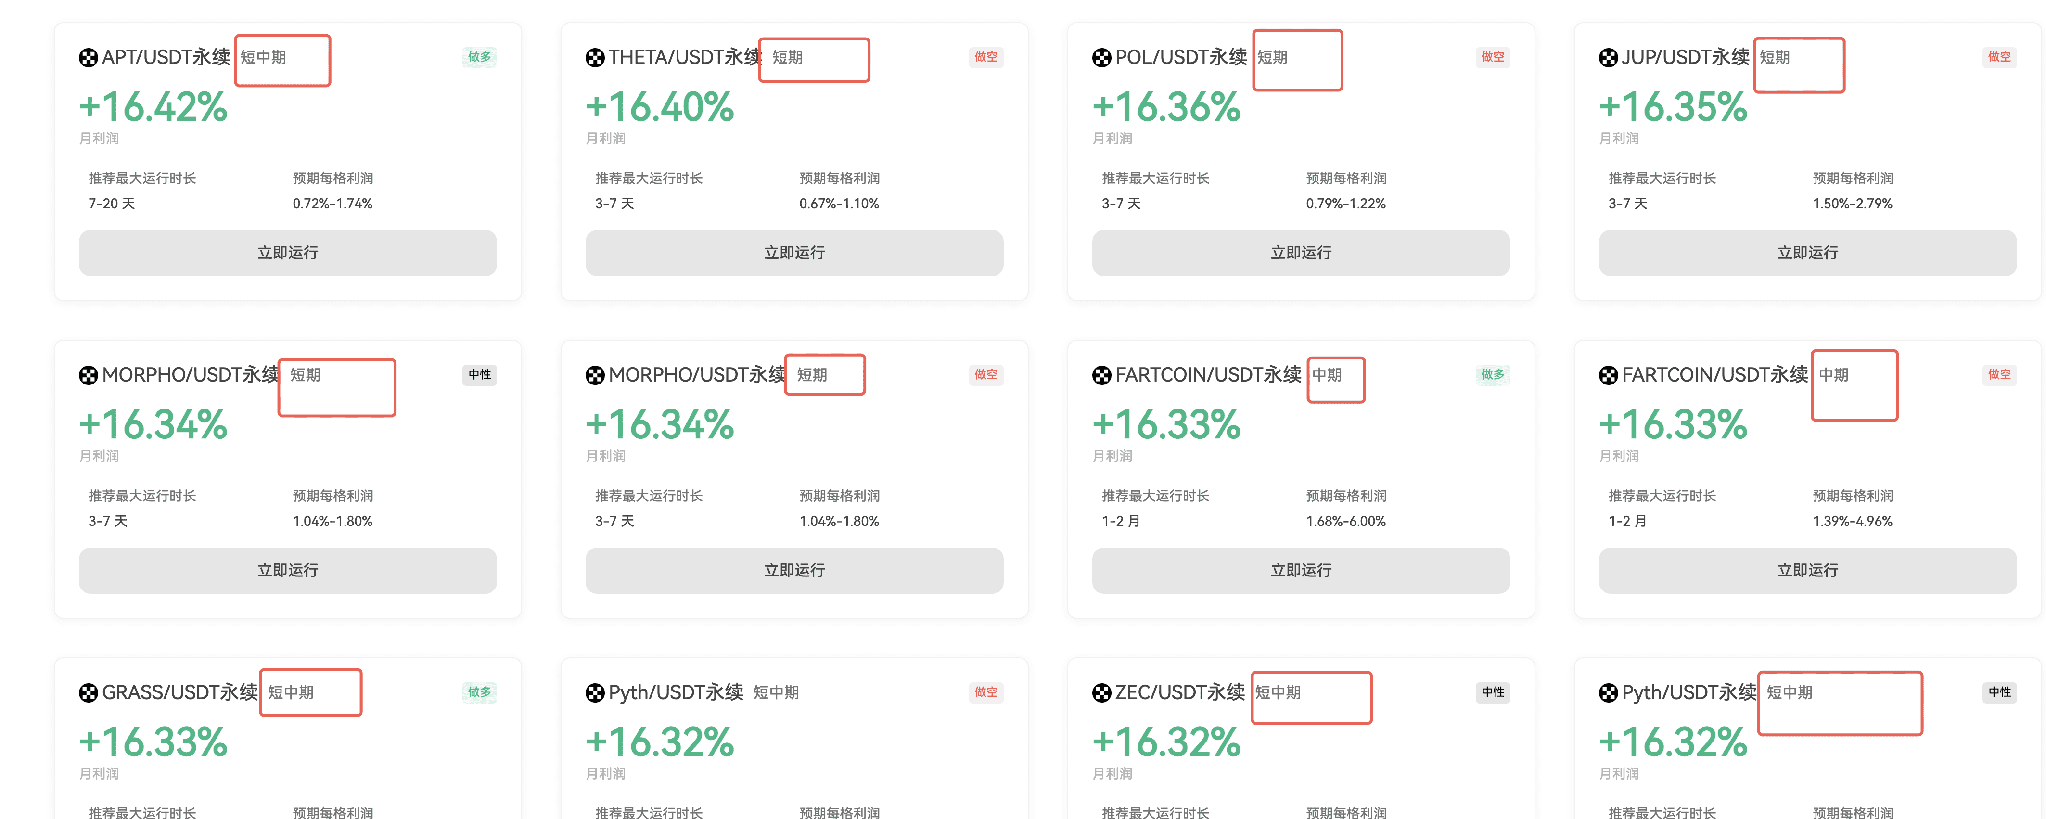
The detail page also provides suggestions for operation cycles and corresponding grid profit estimates. These hints are not guarantees of validity or profits to be obtained upon expiration. Templates set for relatively short-cycle fluctuations, if left unattended for half a month or a month, may find that the market conditions have changed. It is best to have profit-taking, stop-loss, and exit conditions planned in advance; don’t wait until positions become uncomfortable to bargain with yourself temporarily.
So how do you observe whether the market has changed? I consider the Bollinger Bands as one of the reference tools. It typically consists of three lines: upper band, middle band, and lower band. If the bandwidth narrows, it indicates that recent fluctuations are converging, but it may also be brewing a breakout; if the bandwidth widens, it indicates that fluctuations intensify, but this alone cannot determine the direction. Additionally, it is necessary to consider whether prices are continually breaking through and if trends are persisting. Pay particular attention when the two outer bands are “quarreling,” but do not merely conclude the market situation by how far apart they are.
Another common question is how to define the grid interval and how far apart each grid should be. For intervals, you can combine chip distribution to find possible support and resistance areas. It is not necessary to look at very large cycles; small cycles can also provide references, but these locations are only observational bases, and prices will not promise to stop there.
For spacing, the ATR indicator can be utilized. It measures the average level of true volatility for a specified period and can be roughly understood as how much volatility each K-line can typically have. It reflects the size of volatility, without being responsible for judging the rising or falling direction.
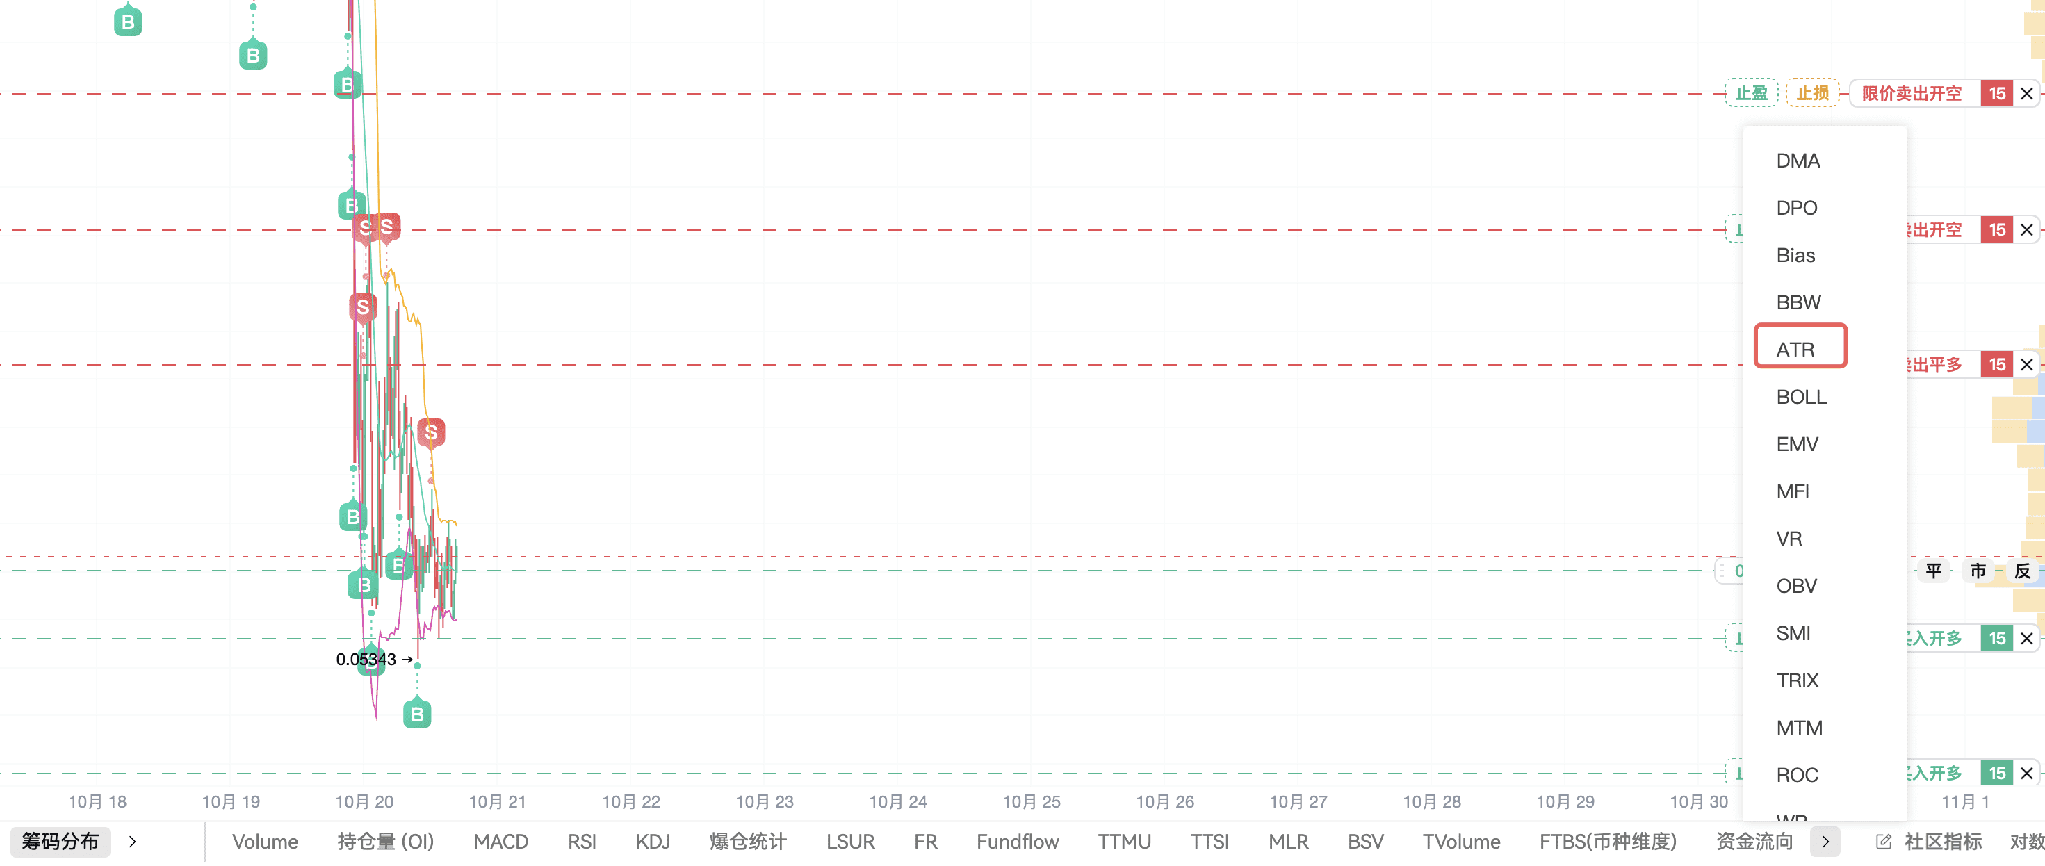
Taking the current ATR and multiplying it by 0.5, 1, or 2 can serve as a method for adjusting the price difference of each grid, and then compare it with the interval, number of grids, and transaction fees. They are not universally optimal parameters; setting the target profit for each grid at 2% does not mean the strategy is now stable. If the spacing is too tight, fees can easily eat into the price difference; if the spacing is too wide, the chances of pairing may reduce.
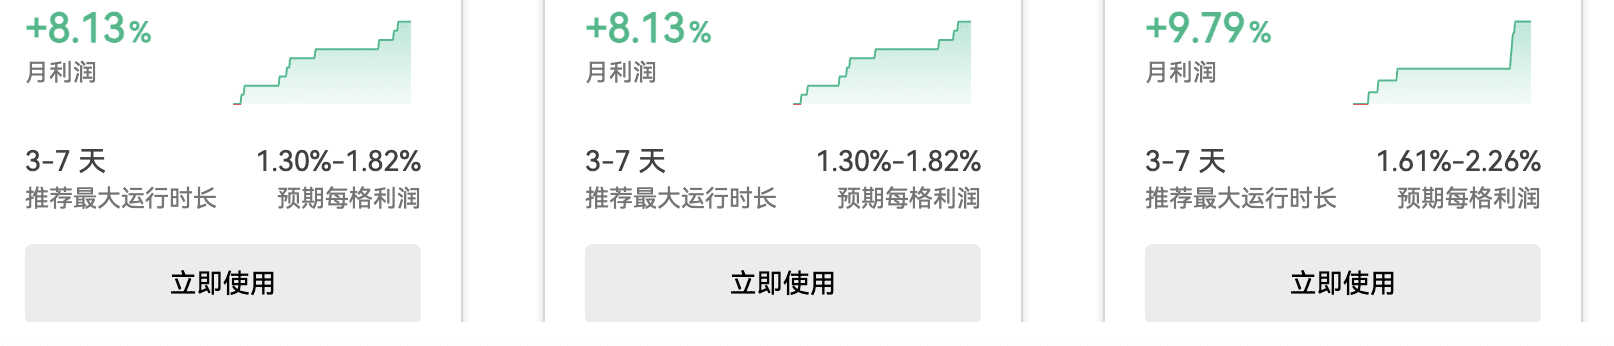
The parameters page should also check the strategy direction, leverage, and minimum investment. Here, another set of parameters for long positions with 3x leverage is displayed, which is not the same demonstration as the previous neutral grid. The interval and number of grids will affect the minimum capital requirement, so do not only look at whether the account balance is sufficient; also, do not overlook the leverage.

There is also an advanced feature called mobile grid. The center of oscillation for some currencies may change. For instance, if it originally fluctuated between 0.1 and 0.2, but after a rise, it starts to fluctuate around 0.5 to 0.6, the original grid interval may no longer be suitable. A mobile grid can adjust the operating interval according to specific rules, attempting to adapt to new fluctuation positions.
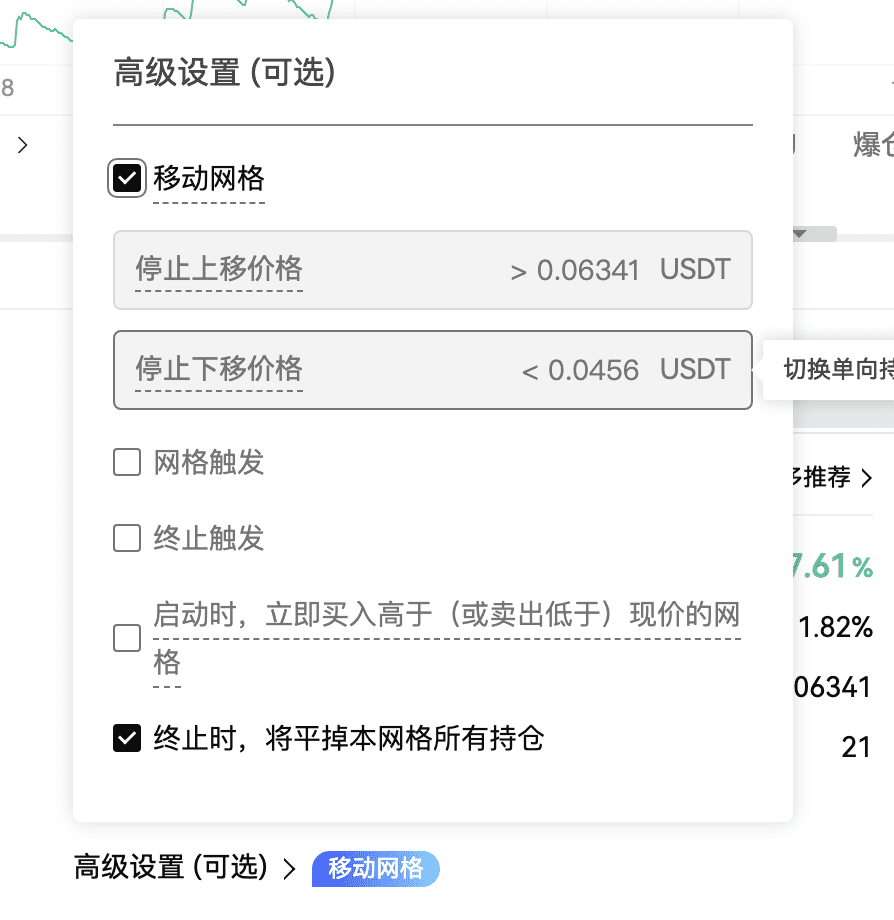
However, when the interval moves, existing floating losses will not automatically disappear, and the risk of forced liquidation will not disappear either. A mobile grid cannot replace a stop loss, nor should it be understood as providing an extra opportunity to avoid losses. How it is triggered, in which direction it moves, and what limitations exist, all depend on actual settings.
Ultimately, the core of the grid is to buy low and sell high according to the rules. It is suitable for utilizing fluctuations, but it does not have the ability to eliminate risks. Finding positions in the chip distribution and selecting intervals includes many details that can be uncovered in future discussions.
I have also tried running a grid with higher leverage; the short-term figures look impressive at first, but they soon quickly declined. The shorter the time, the more exaggerated the annualized figure appears, and you cannot just focus on that large number to judge the quality of the strategy; there is also no specific demarcation line that categorizes anything above a particular annualized number as fake. Instead of being led by appealing gains, it is better to first understand how it makes money, where it could incur losses, and when you plan to exit. Having rules in advance means that when the market does change, you won’t feel flustered.
Currently, there are live streams every day, welcome to keep following AiCoin friends! Reserve in advance 👇
https://www.aicoin.com/zh-Hans/live/list?tab=upcoming
Join our community, let's discuss and become stronger together!
Official Telegram community:
AiCoin Chinese Twitter:
Hype Rebates:
https://app.hyperliquid.xyz/join/AICOIN88
Binance Rebates:
https://jump.do/zh-Hans/xlink-proxy?id=3
Invitation Code: aicoin668
Coinbase Rebates:
https://jump.do/xlink?checkProxy=true&proxyId=25
Invitation Code: Y8L23JL
免责声明:本文章仅代表作者个人观点,不代表本平台的立场和观点。本文章仅供信息分享,不构成对任何人的任何投资建议。用户与作者之间的任何争议,与本平台无关。如网页中刊载的文章或图片涉及侵权,请提供相关的权利证明和身份证明发送邮件到[email protected],本平台相关工作人员将会进行核查。