The most feared thing when watching the market is seeing different directions, support, and entry positions all at once, and then getting into a fight with oneself later on. Today we will study the Ichimoku chart, putting these issues on the same chart to examine. When you first open it, there are many lines and colors; don’t worry, focusing on the cloud and the lagging line will clarify your thoughts.
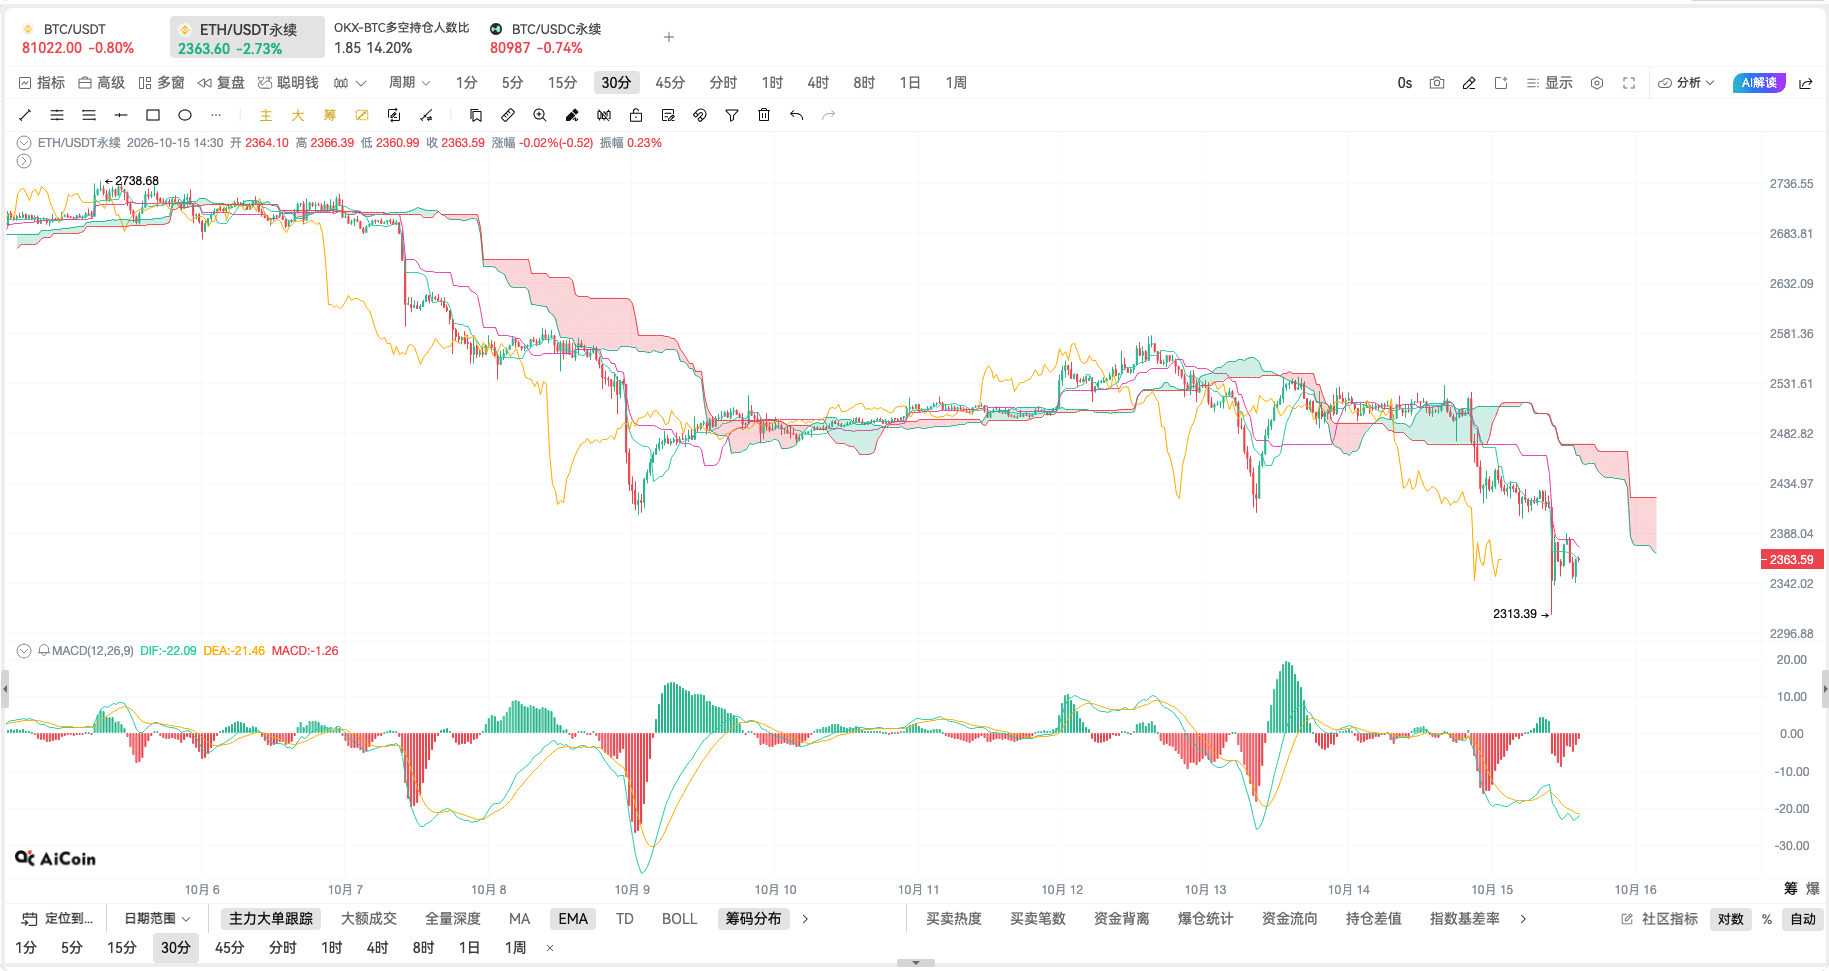
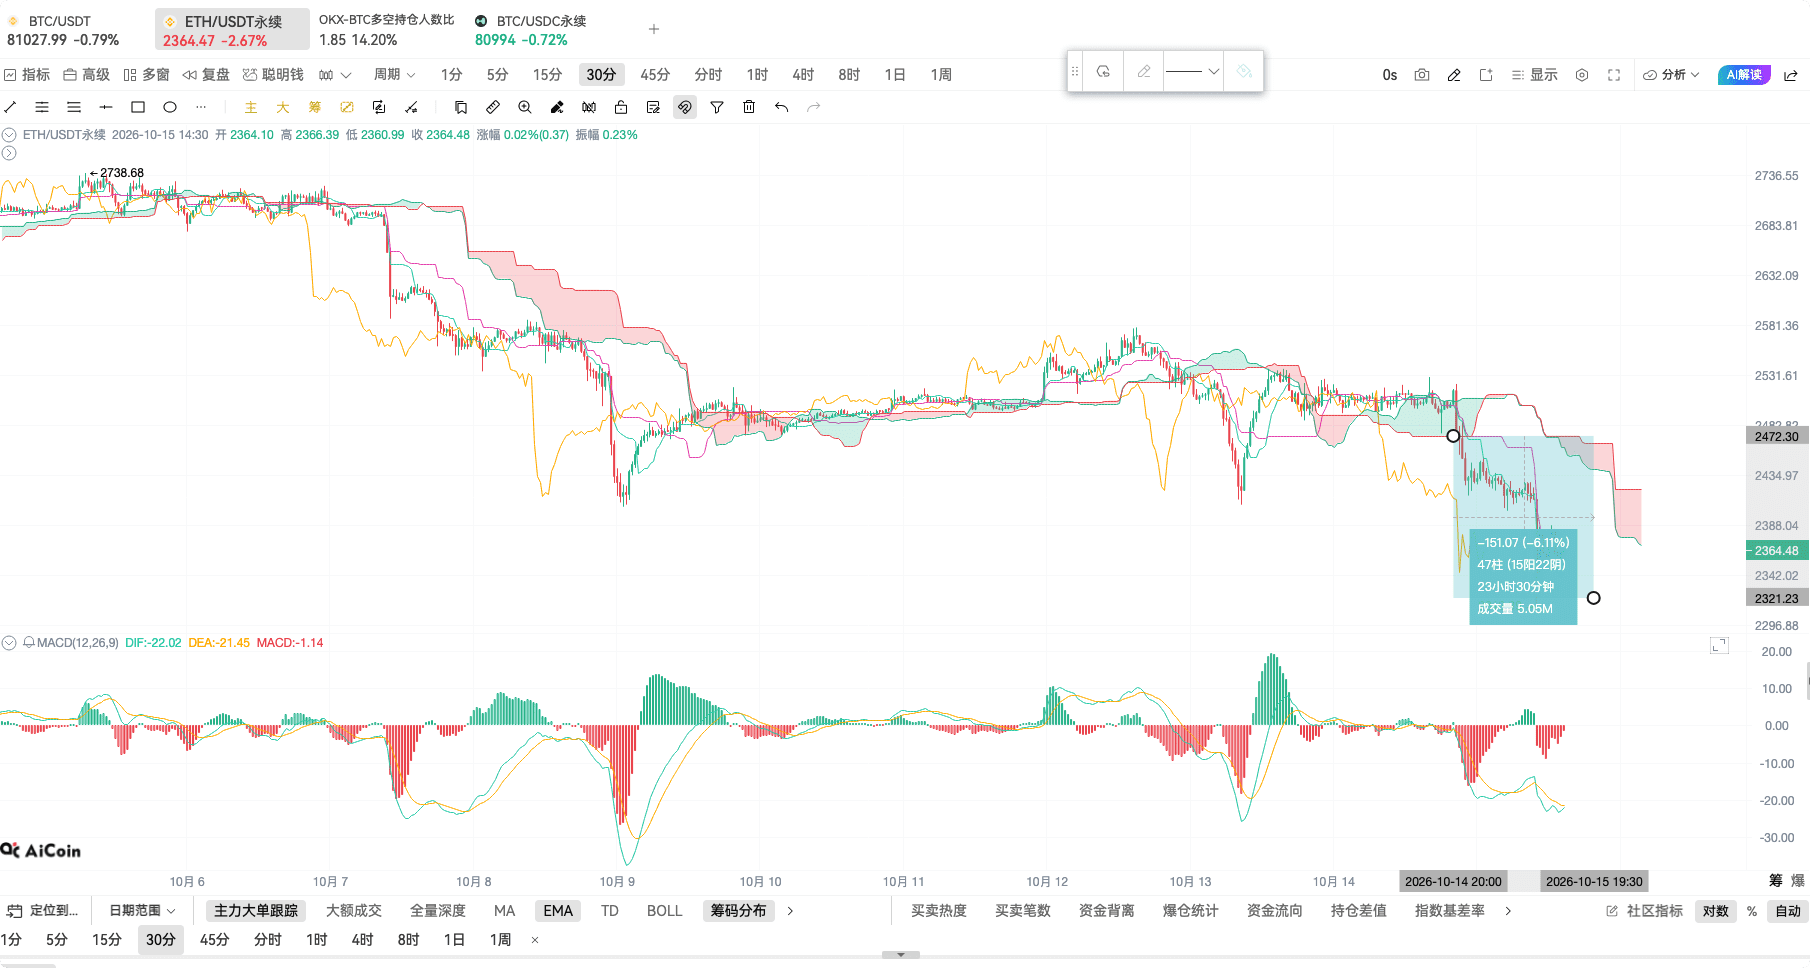
First, let's look at the recent trend of ETH. After the first downward signal appeared, the decline range indicated in the chart is approximately 8%, with the cloud pressing down on the price. In this case, I would prioritize studying the bearish direction.
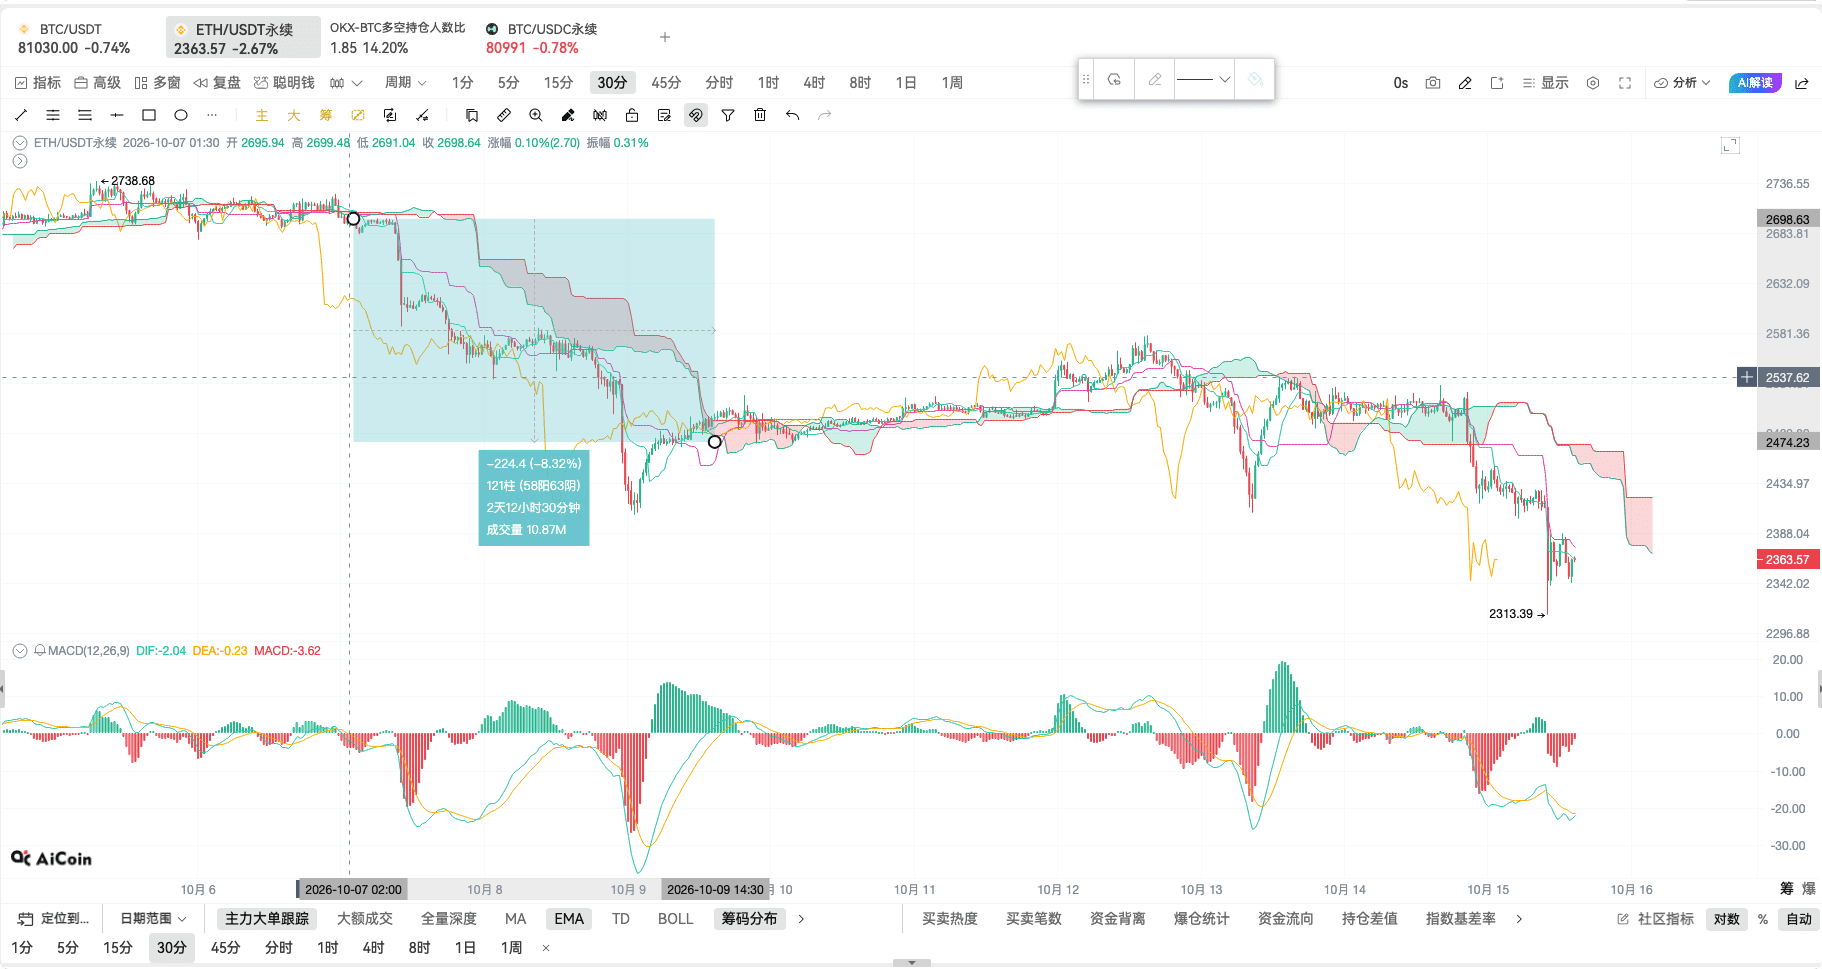
The other segment appeared after the CPI was released last night, with the price breaking through the cloud, resulting in a decline of about 6%. The 8% and 6% here are historical price ranges; the actual trading outcome will depend on entry, exit, and cost and cannot be directly treated as profit gained.
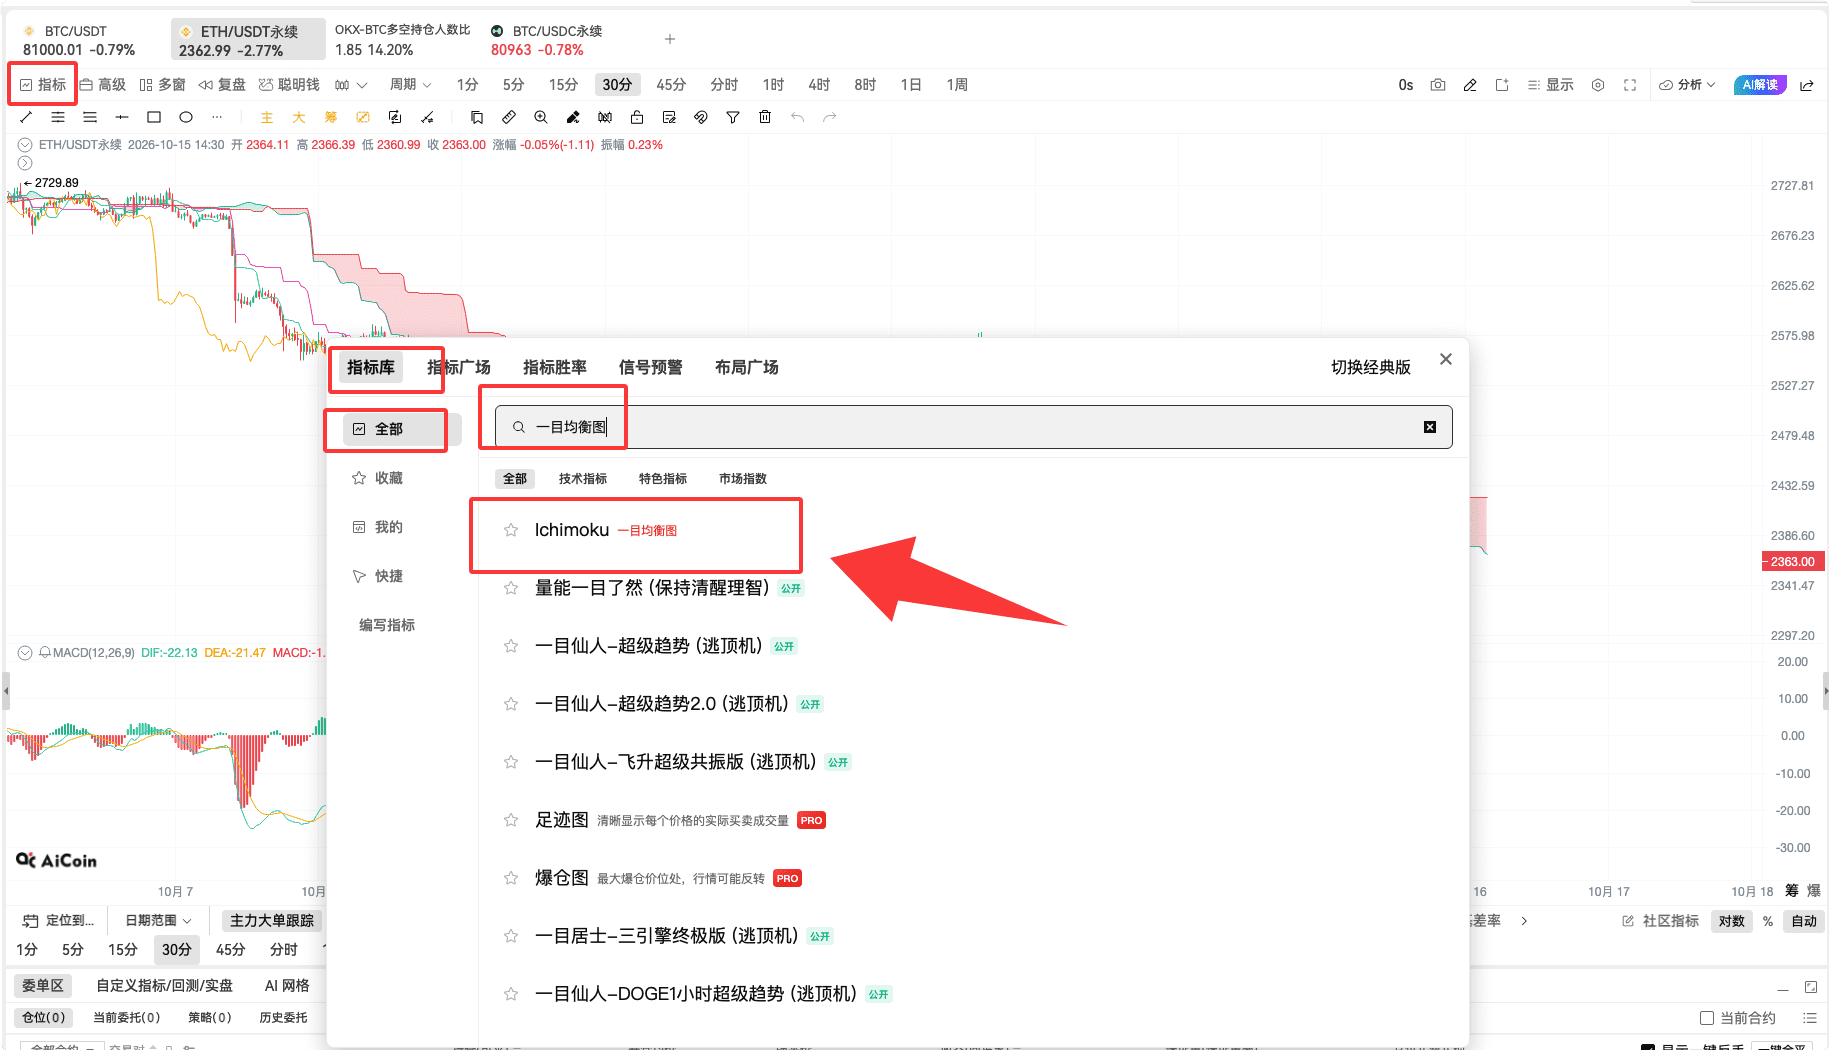
If you want to follow along, you can search for "Ichimoku Chart" in AiCoin under "Indicators - Indicator Library - All" and add it to your candlestick chart. This set of ideas can be used to study mainstream coins and altcoins, but specific signals still need to be considered in combination with their respective trends.
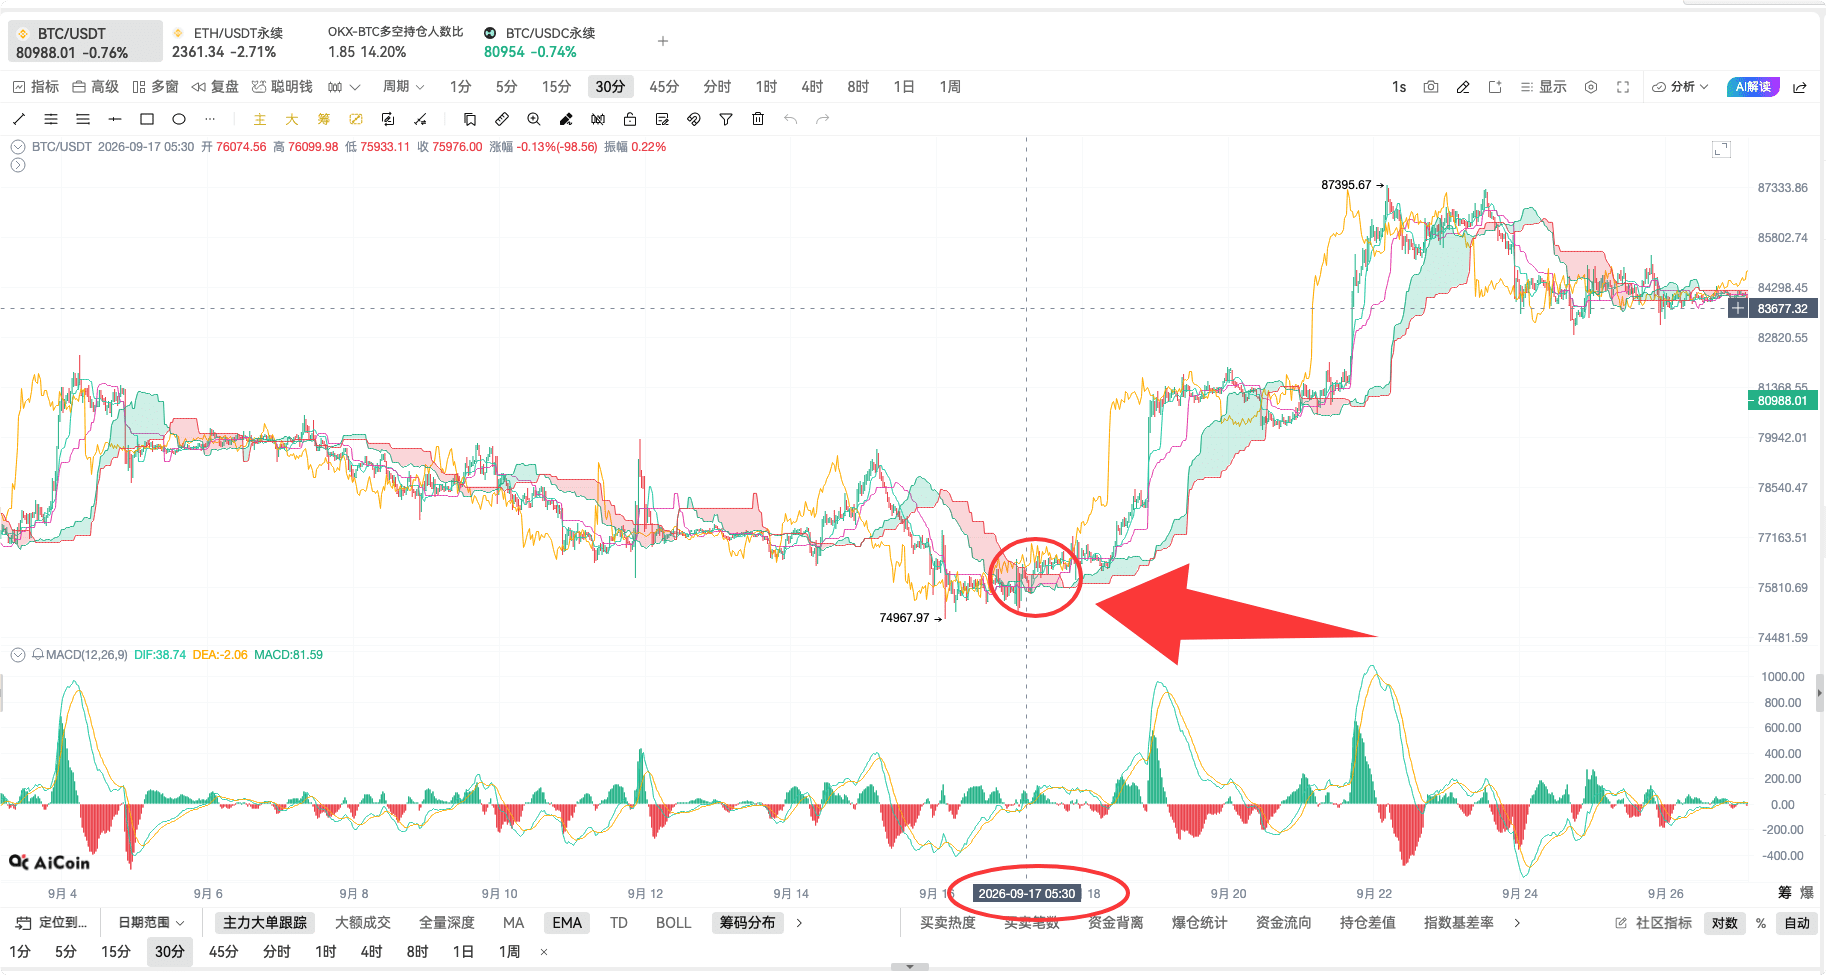
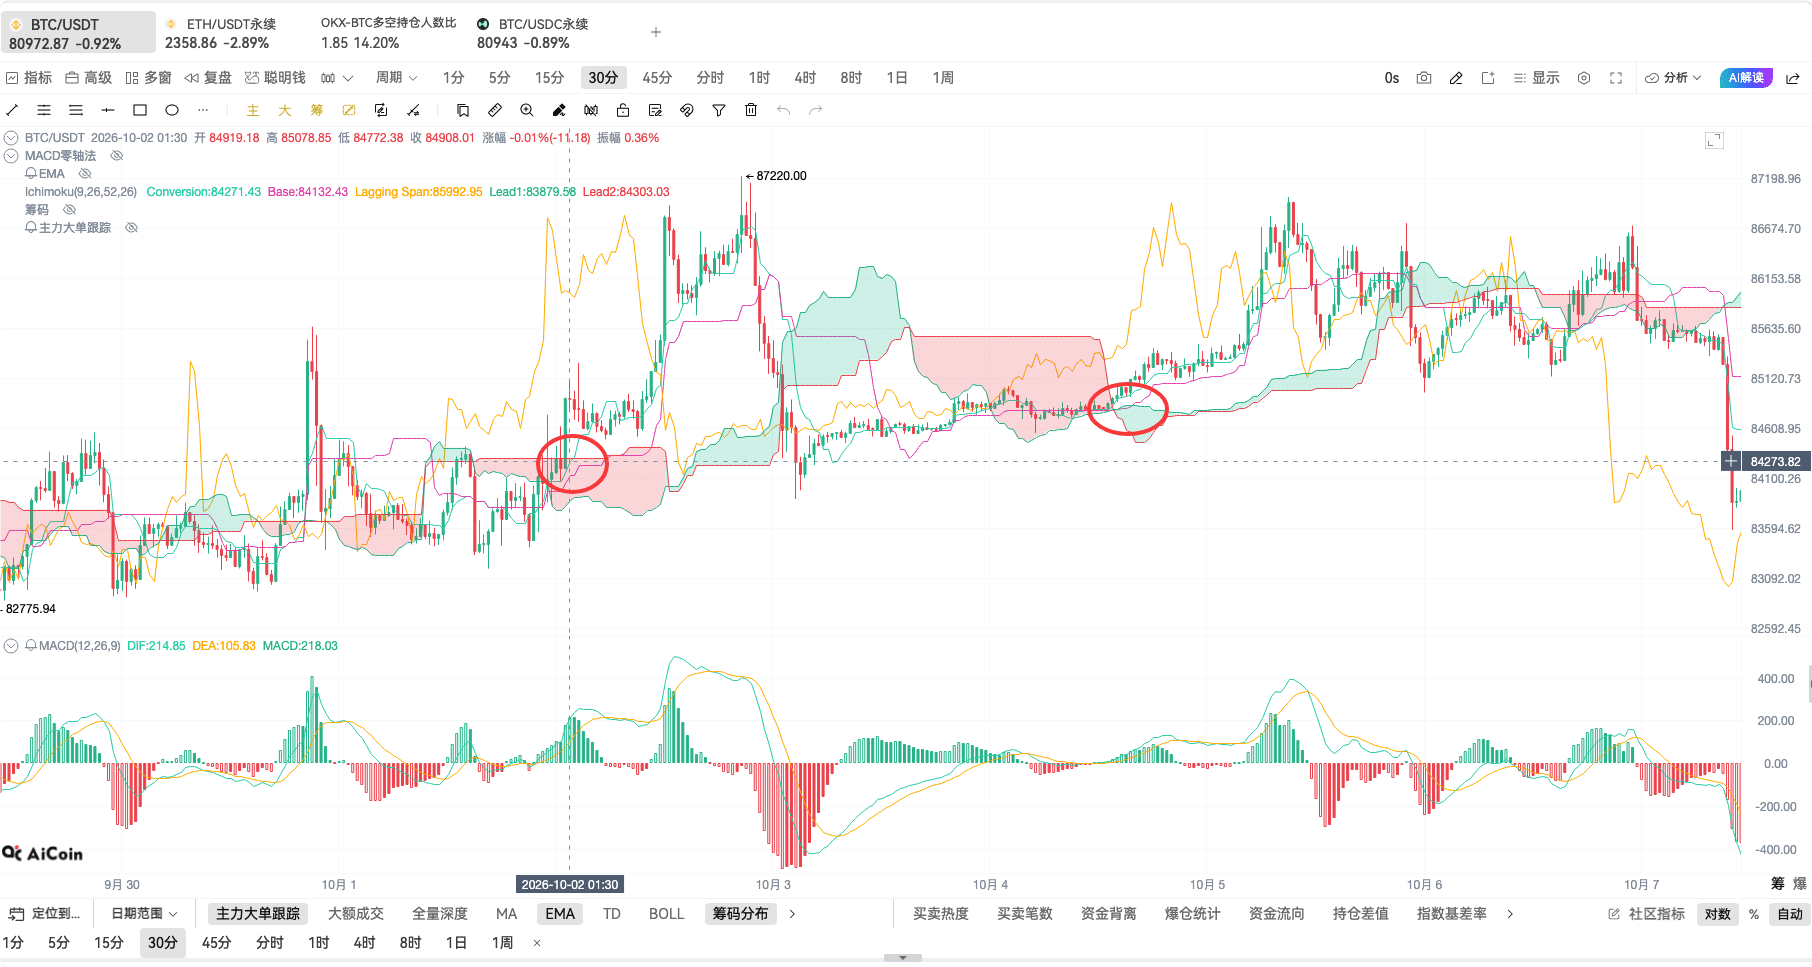
Switching to BTC, let's look back at the reversal opportunities after the decline. About a month ago, after the price underwent a correction, a cross signal appeared at the circled position on the chart; with the cloud providing support and the lagging line confirming it, a subsequent uptrend followed. Why is this worth noting? Once you understand these lines, it will become clear when you look back.
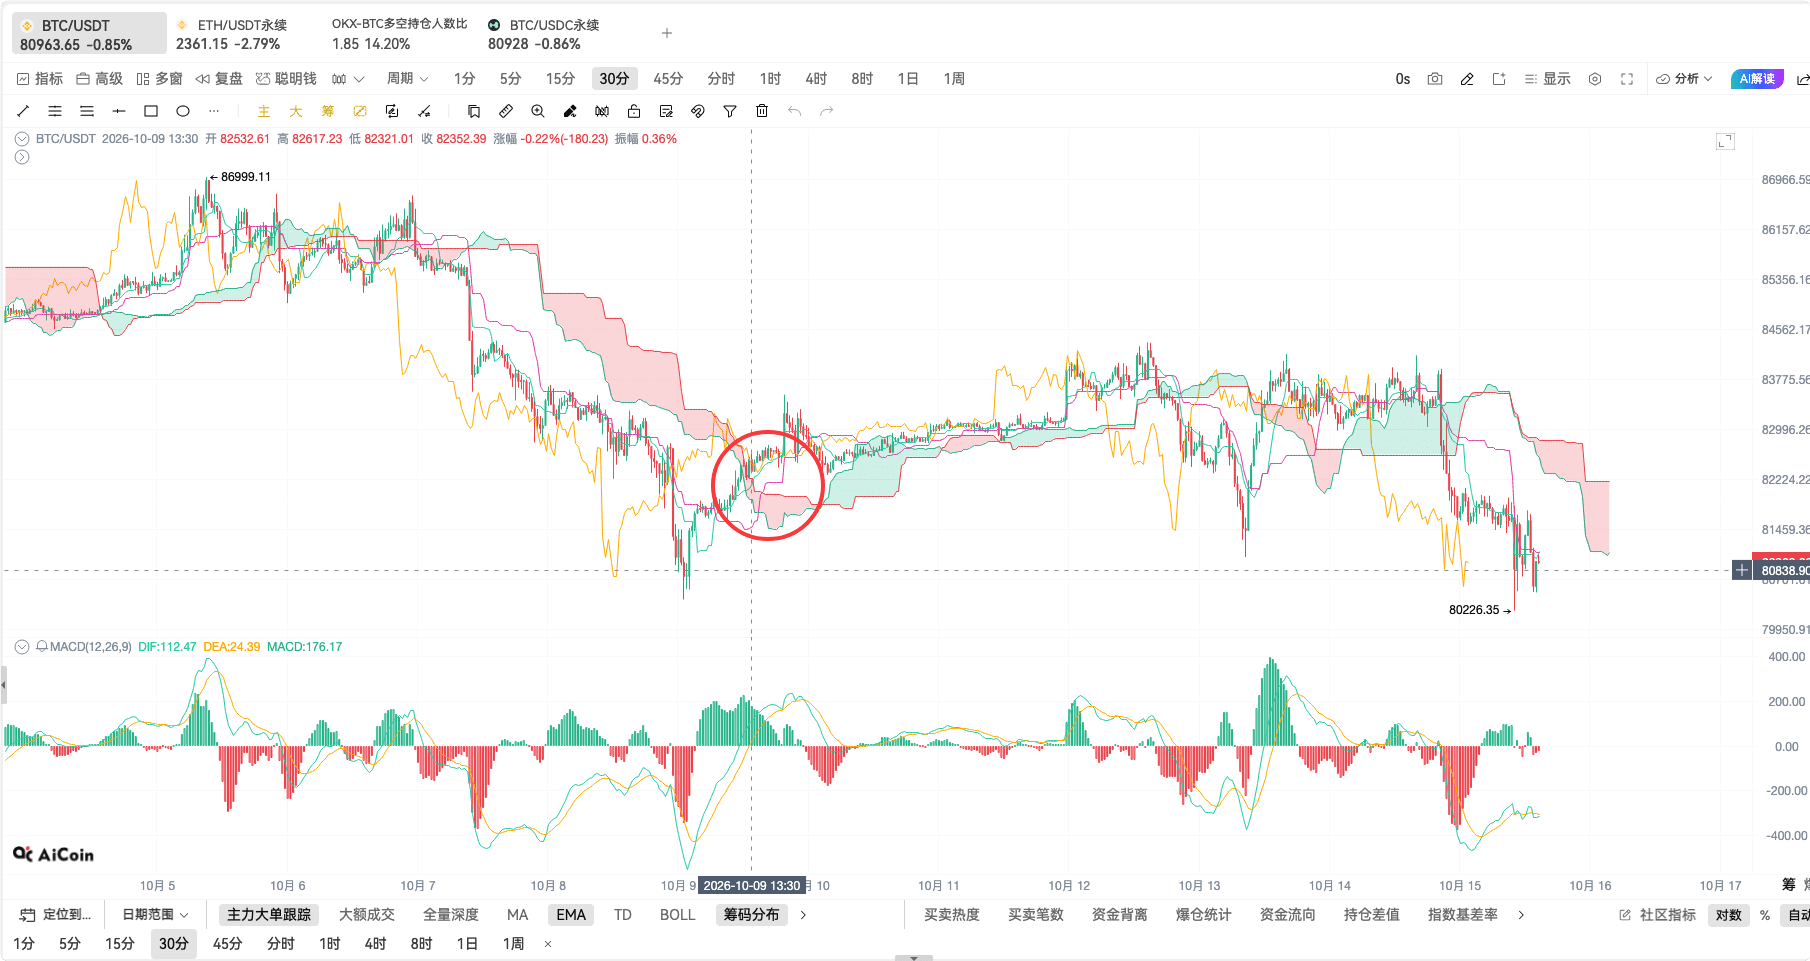
A week ago, there was also a similar upward cross after a decline. By placing the two cases together, focus on where the price, lagging line, and cloud were at the time the signal appeared; don’t just pay attention to how much it went up afterward.
In the Ichimoku chart, first become familiar with the two leading spans. The software refers to them as Leading Span 1 and Leading Span 2, while other places may call them Leading Span A and Leading Span B. The name may change, but they are still those two lines, a bit like someone being called Linda in the city, but everyone at home still calls her by her nickname.
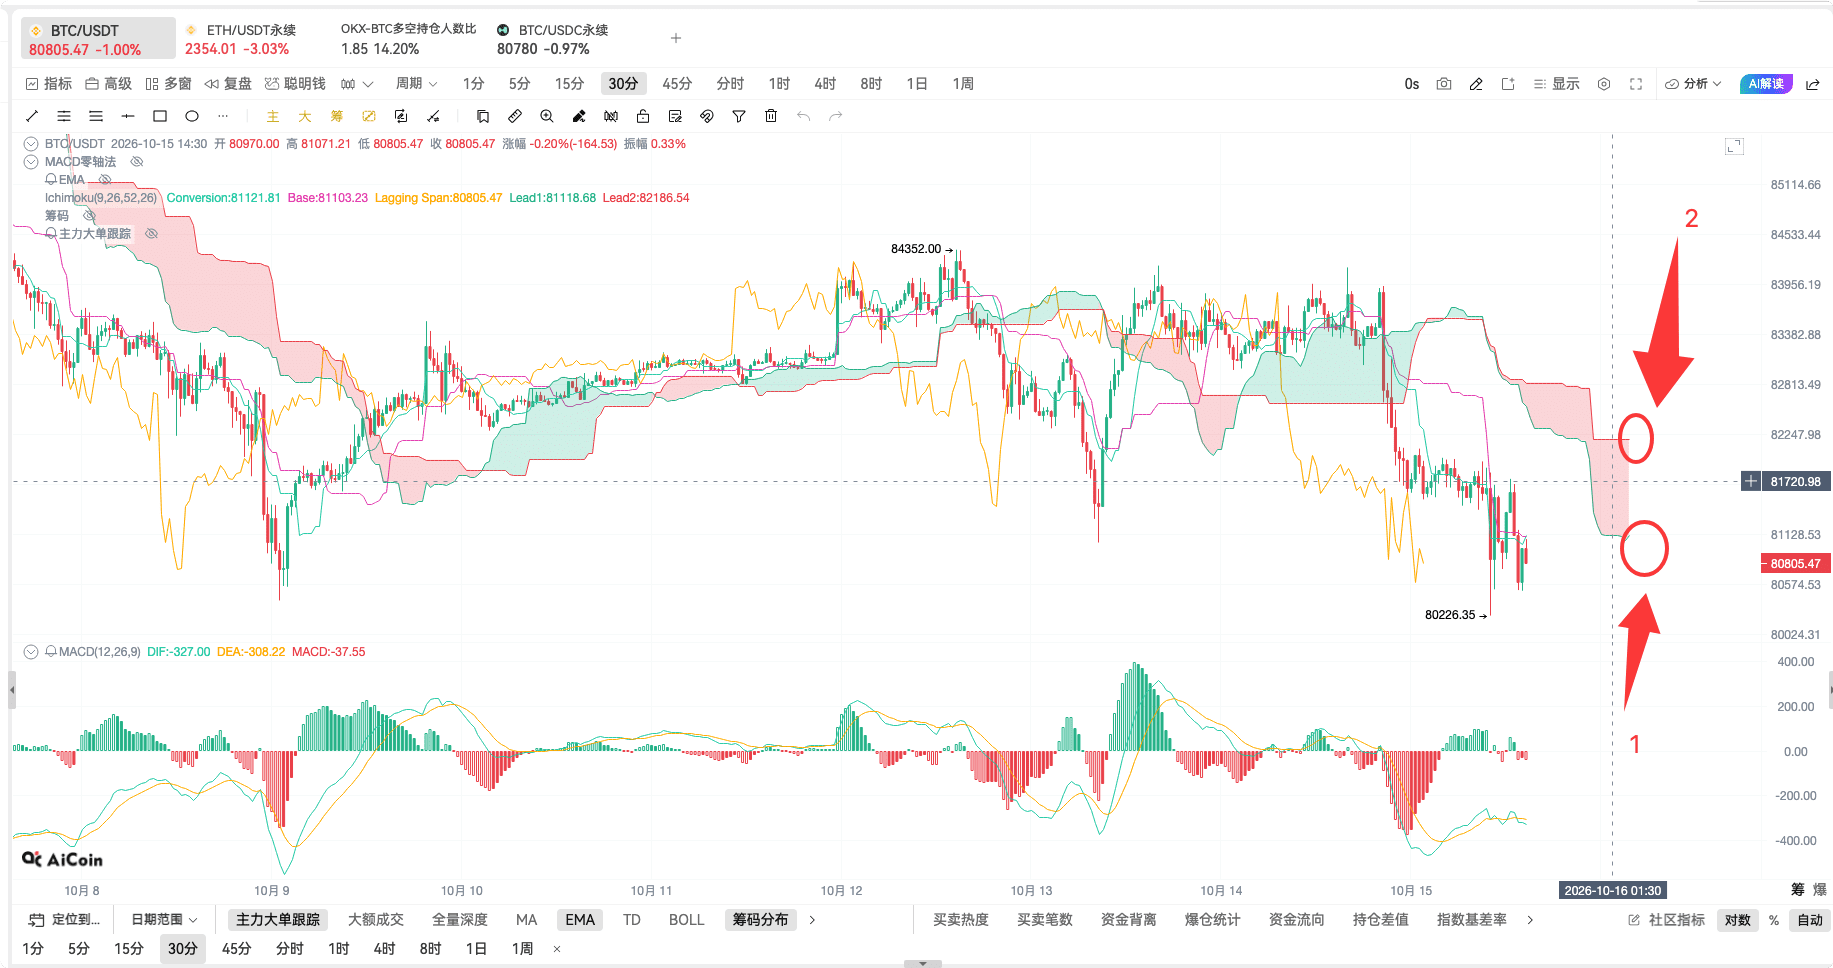
Filling in the color between the two leading spans creates the "cloud." Understanding it as a support or resistance area is more intuitive than focusing on a solitary price. When the cloud is below, it carries a bit of a rolling cloud meaning; when the cloud is above, it's a different mood altogether.
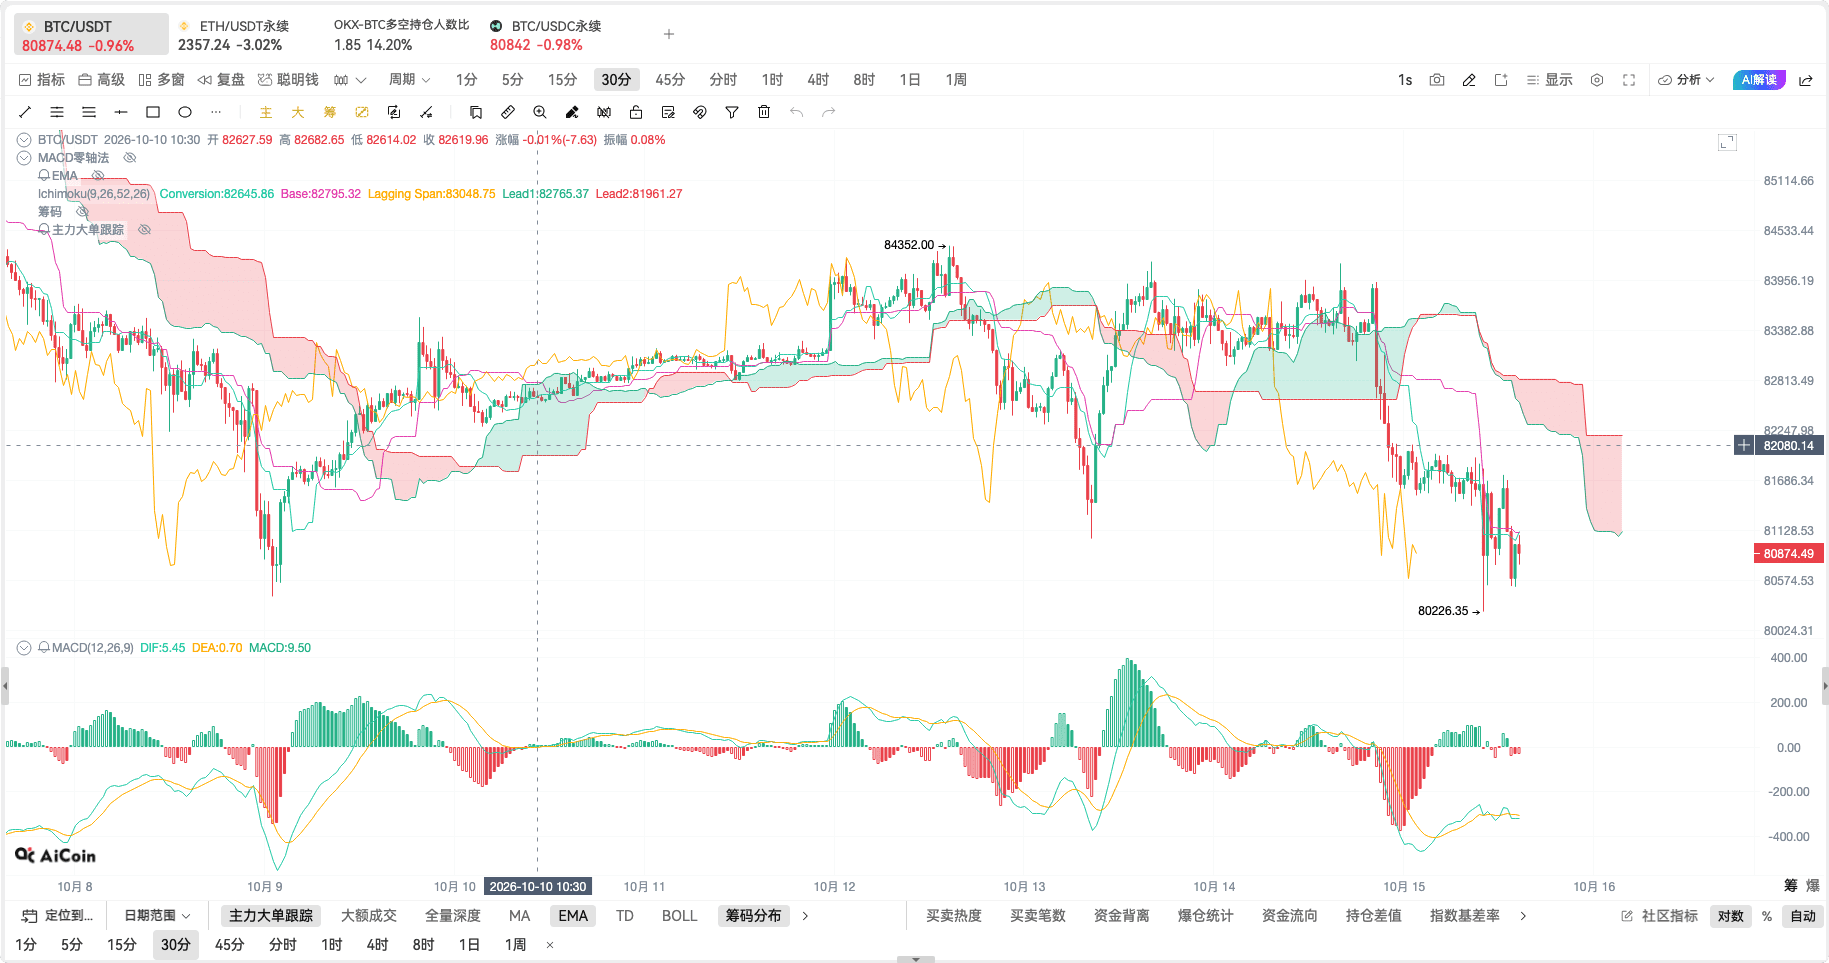
To judge support and resistance, I first look at which side of the cloud the price is on. If the candlestick is above the cloud, the cloud can serve as support below; if the candlestick is below the cloud, the cloud becomes resistance above. In this part of the chart, the price is under the cloud and is still restrained by it during the rebound.
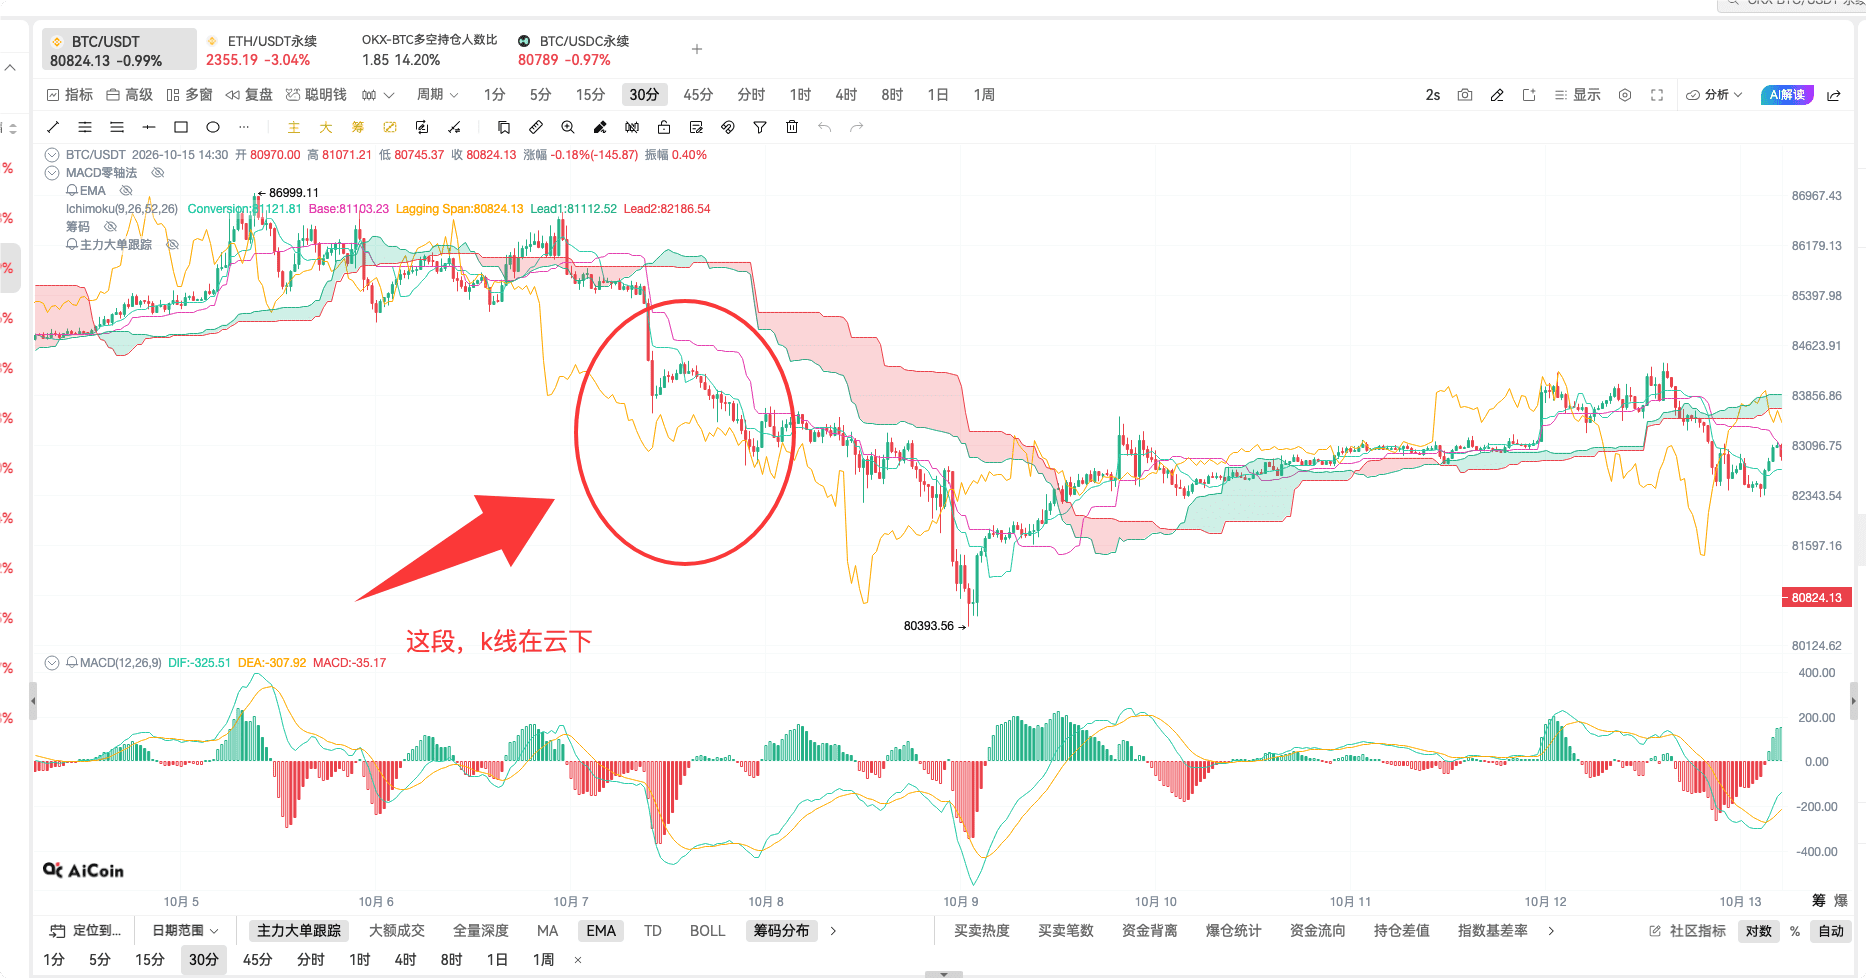
Switching to the segment where the price is above the cloud, the cloud then becomes the support area below. The software distinguishes the state of the cloud using red and green, but in actual market observation, first understand the relative position of the price to the cloud, and then check the color. Don’t draw conclusions just based on a green or red area.
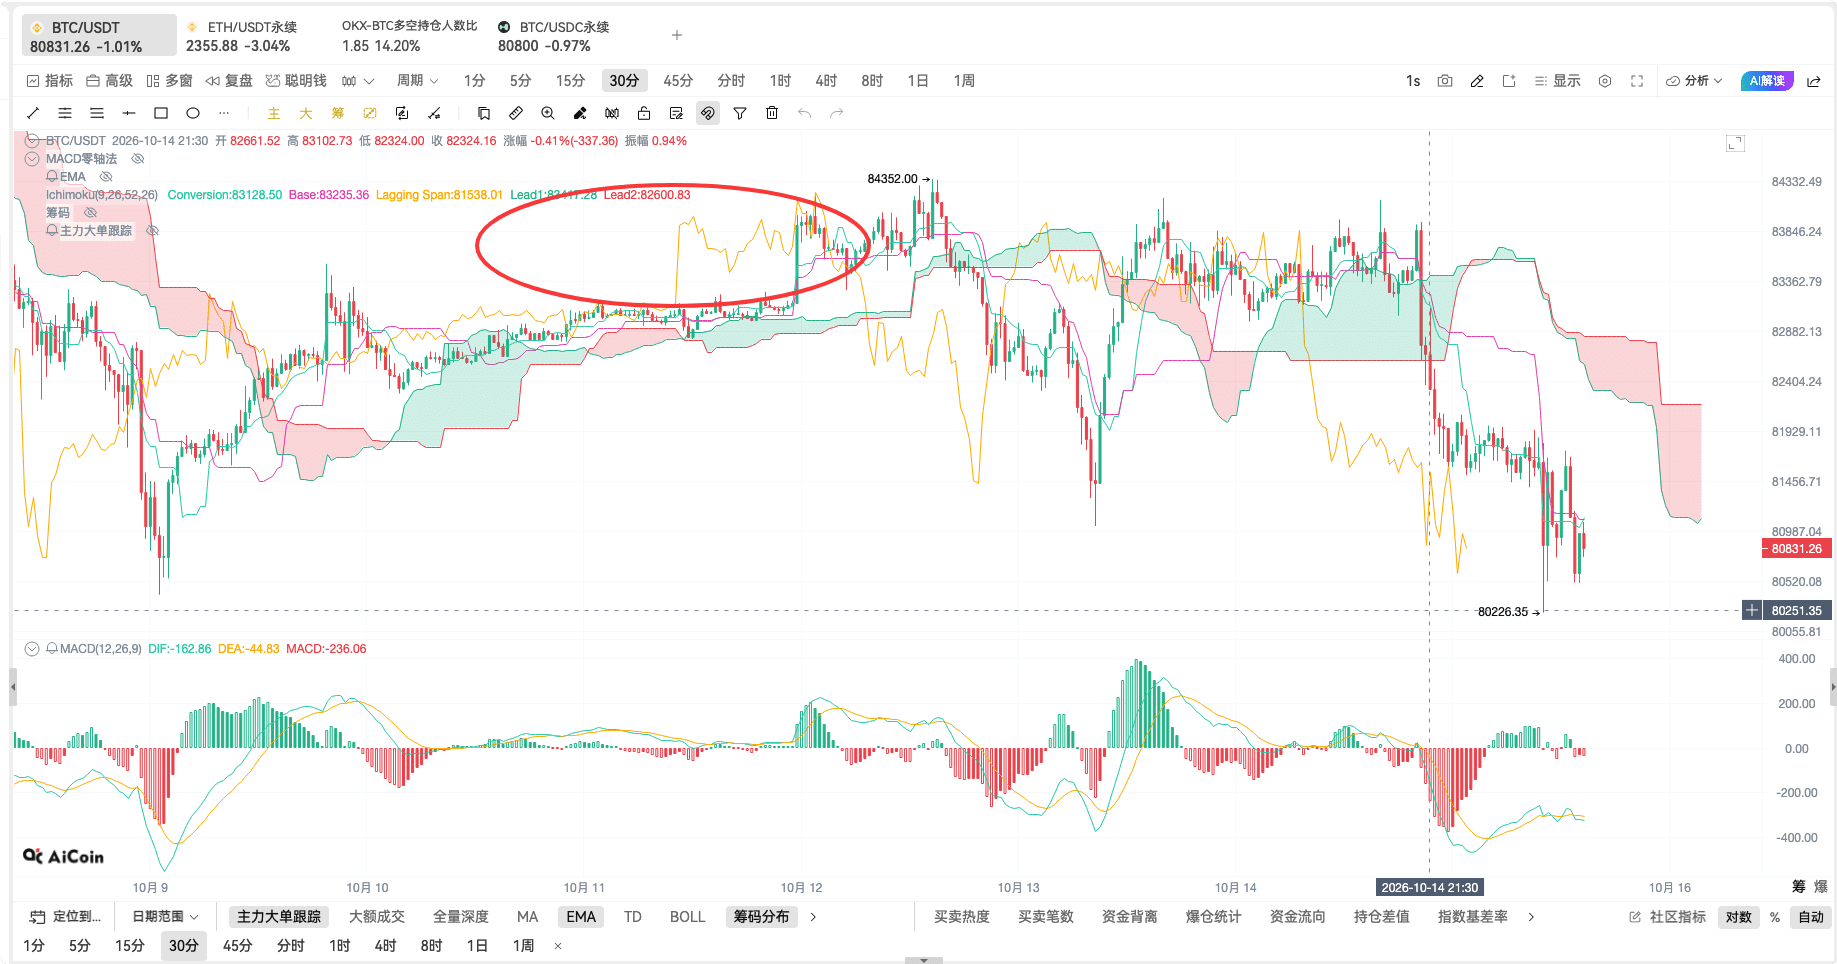
In this way, a simple directional judgment can be organized: if the price is above the cloud, I tend to look for long opportunities; if the price is below the cloud, I tend to look for short opportunities. Next, pay attention to the "breaking cloud": if the price penetrates the cloud from below to above, it is an observation signal for bullish direction; if it drops from above to below the cloud, it is an observation signal for bearish direction.
After the CPI was released last night, the price broke downward through the cloud, and the event change coincided with the technical signal; this kind of position deserves close attention. The signal provides a basis for judgment, but whether it continues needs the trend to verify.
The upward approach is similar. Looking at the two positions circled in the chart, the price crosses upward from below the cloud, indicating that the direction is beginning to improve, so I can further study long opportunities.
When the price is still inside the cloud, I will wait and see. At such times, both sides have their pulls, making it easy to see a breakout, only for it to return unexpectedly. It’s better to wait until it moves out of the cloud to judge; doing so a few times less is more comfortable than trying to find direction in the fog.
Outside the cloud, there are three lines that need to be recognized. The conversion line changes quickly with the price and is usually referred to as the "fast line," which is indicated by the arrow in the chart.
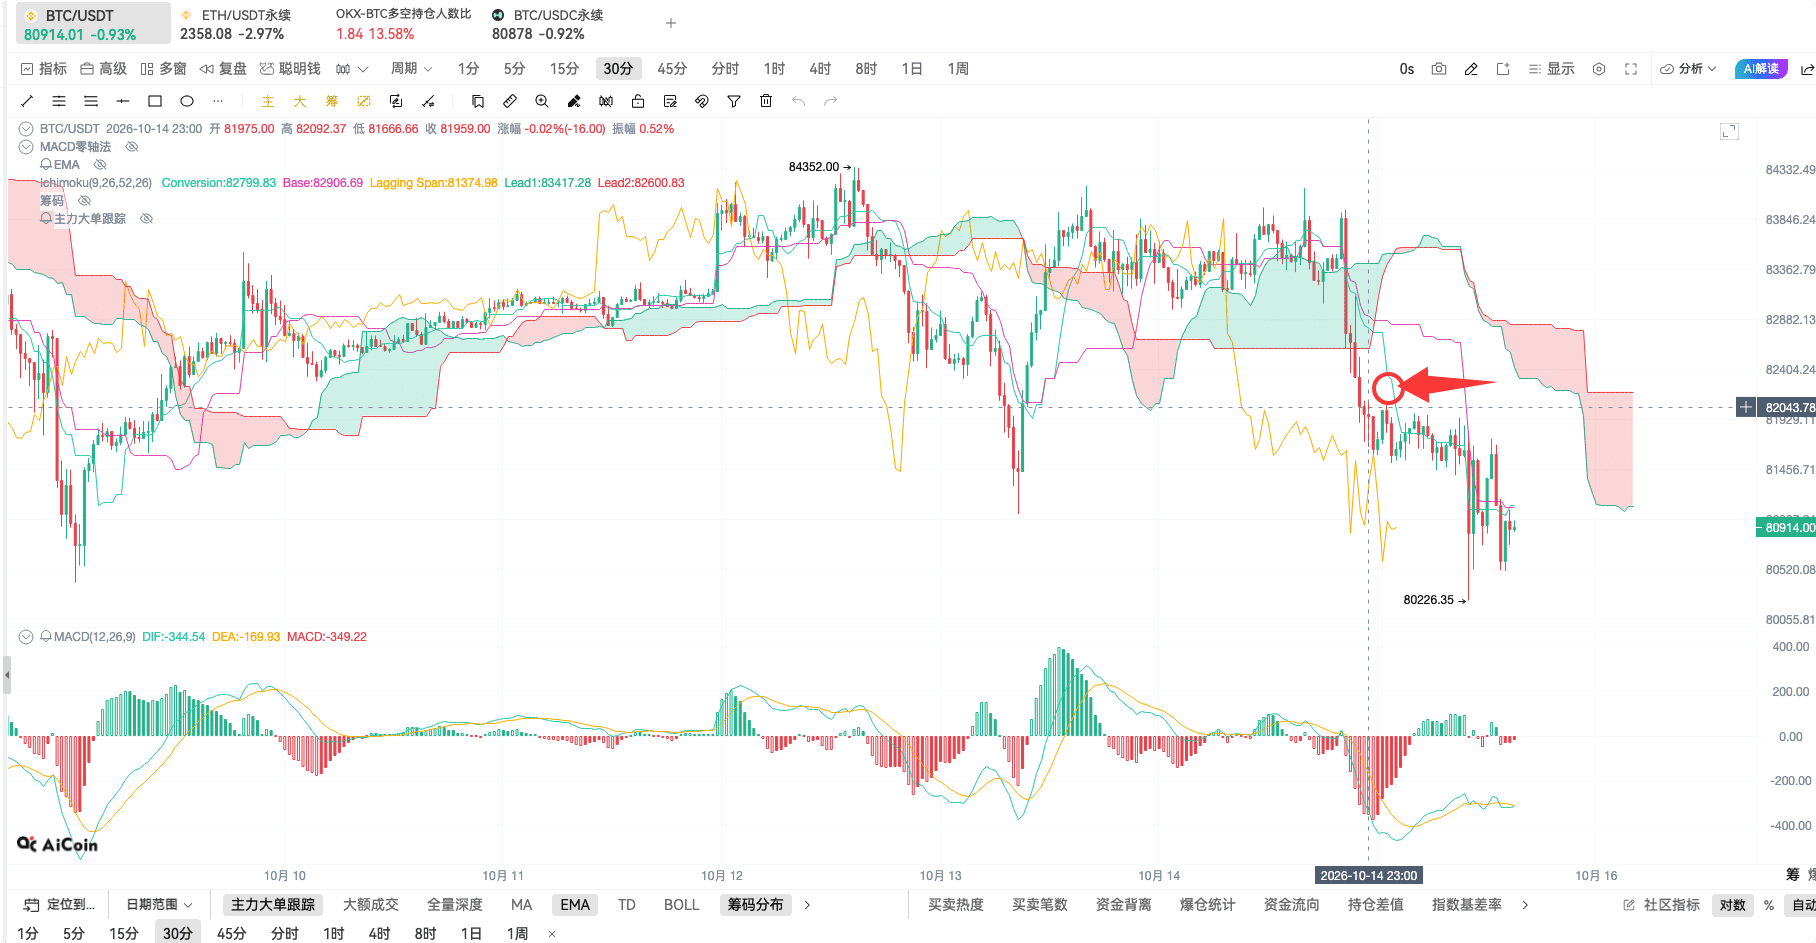
The baseline responds relatively slowly, referred to as the "slow line." The calculations for these two lines differ from EMA, but the usage ideas around golden crosses and death crosses are similar: golden crosses lean toward bullish signals, while death crosses lean toward bearish signals.
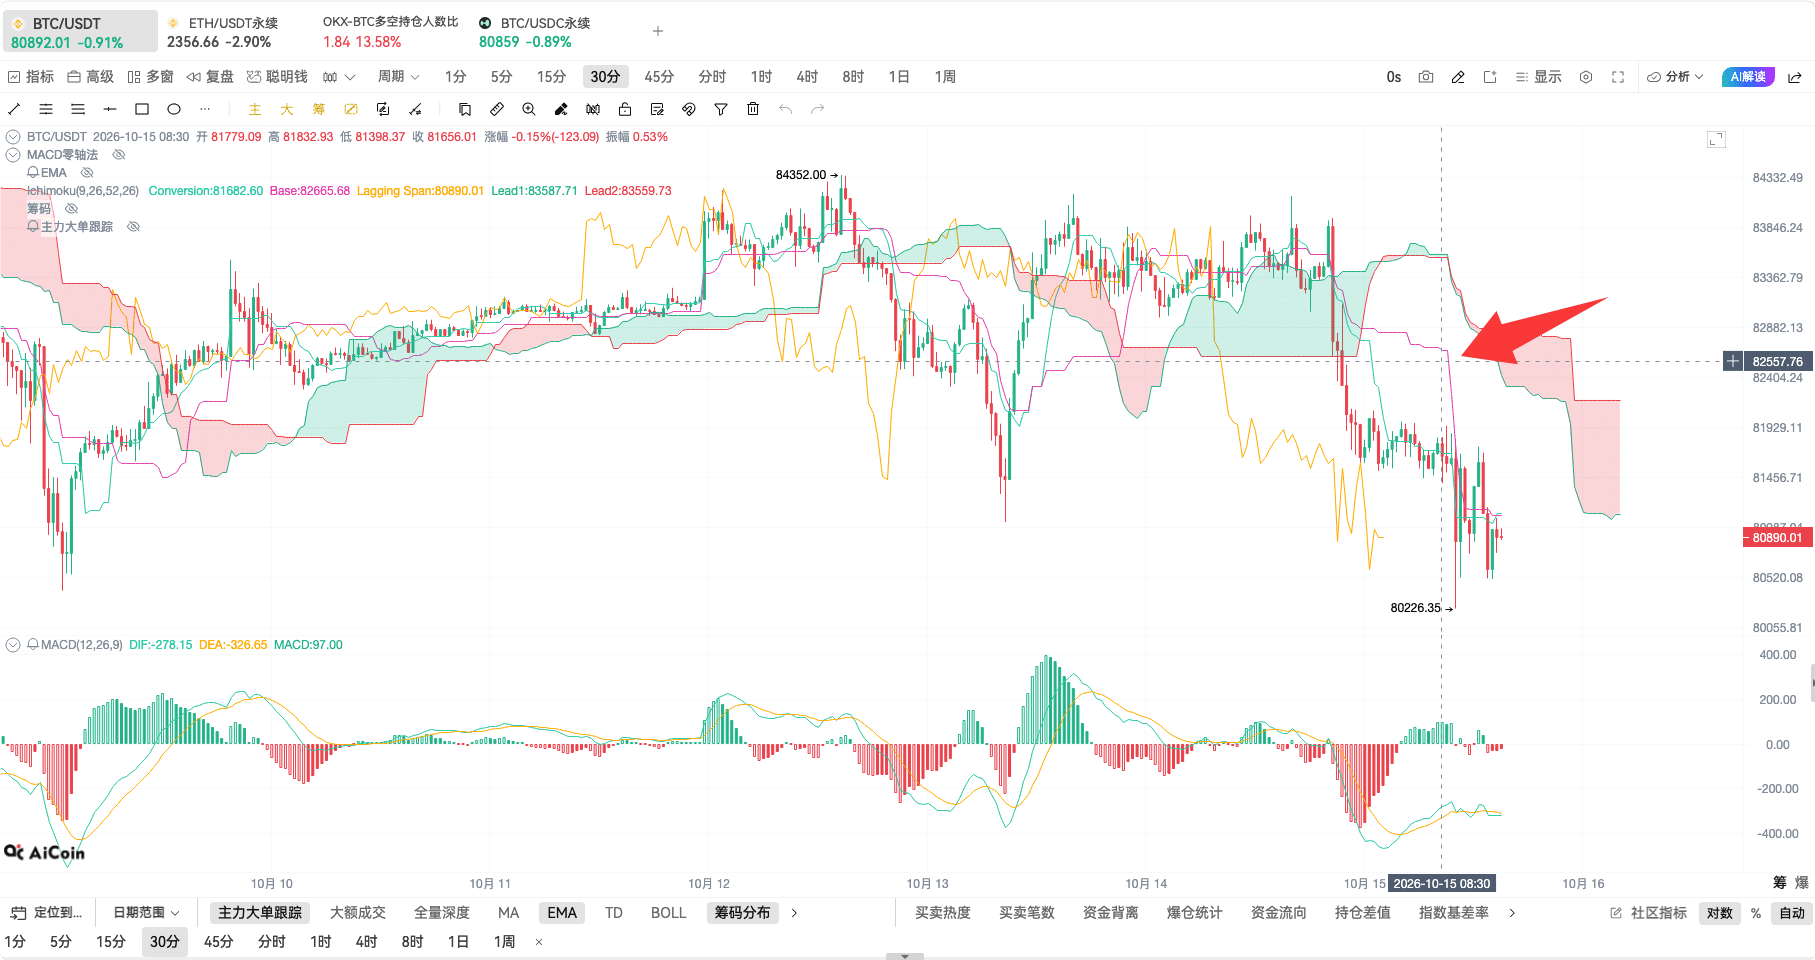
However, I rarely make judgments solely based on the crossing of these two lines. Purely studying the crossing of fast and slow lines, EMA can already provide similar observation methods. In the Ichimoku chart, I prefer using the third line in conjunction— the lagging line.
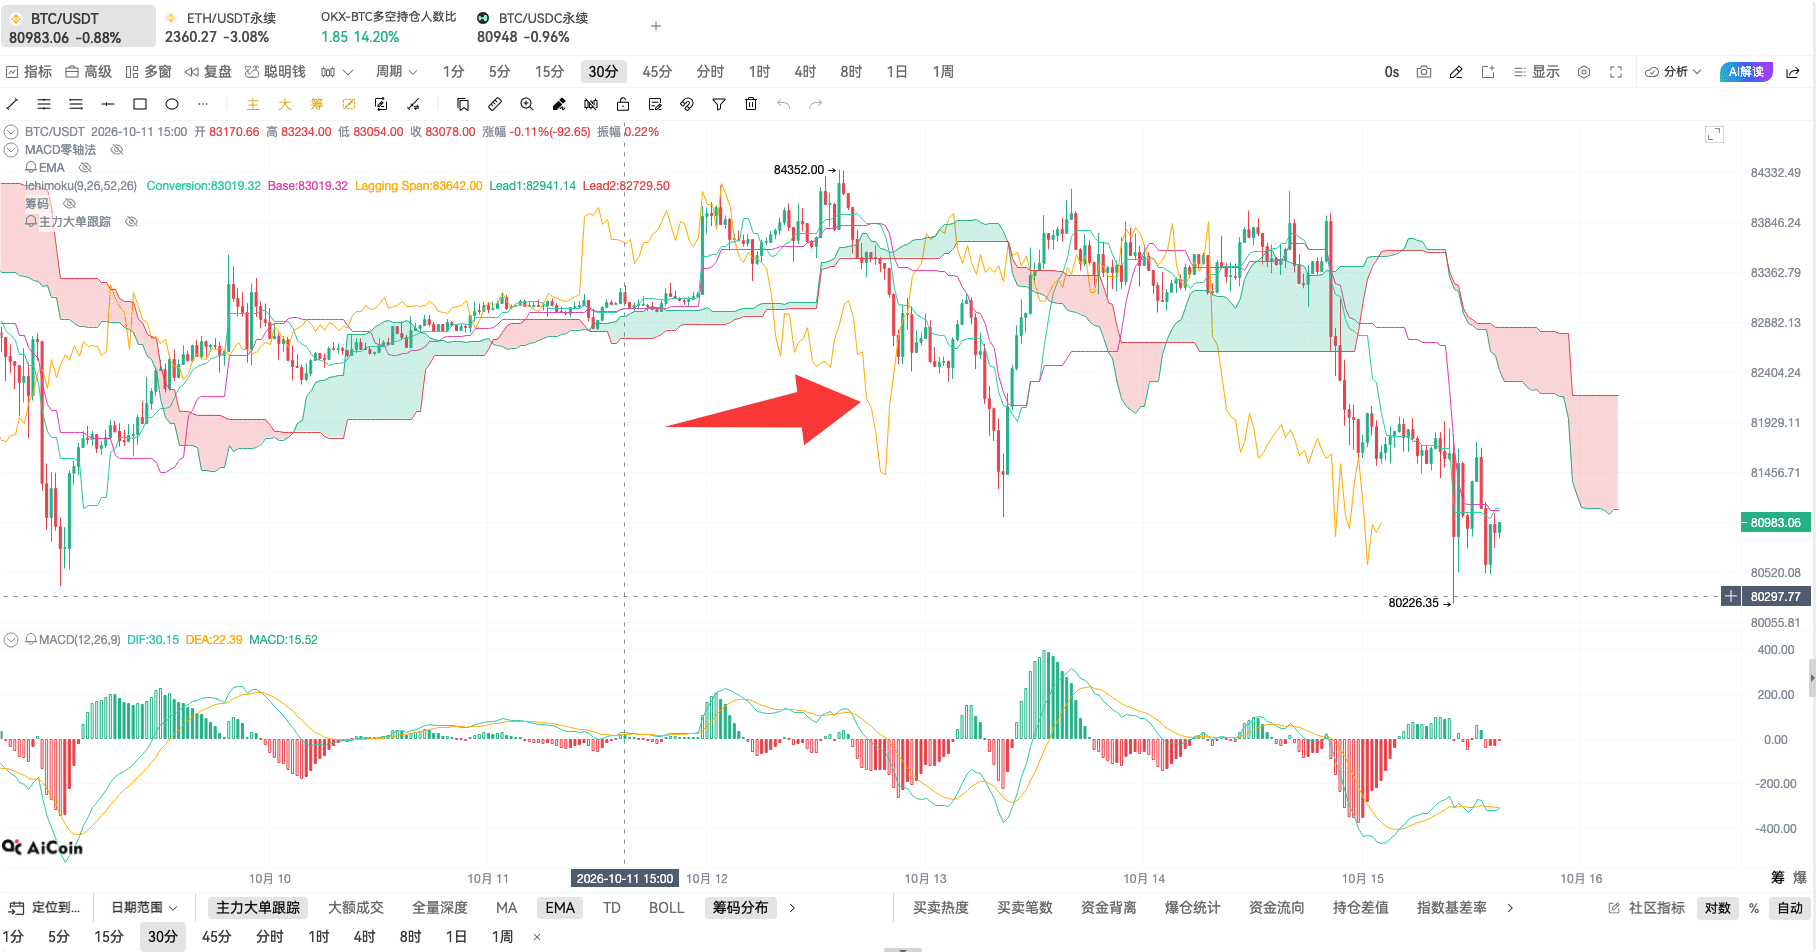
Observing the lagging line alone can simplify the rules: if the lagging line is above the corresponding candlestick, lean toward an upward trend; if it is below the candlestick, lean toward a downward trend. If the lagging line crosses upward through the candlestick, it is an observation signal for buying direction; if it crosses downward through the candlestick, it is an observation signal for selling direction.
If you want to research whether there are early signs of a turn after BTC declines, I will pay attention to whether the lagging line can cross upward through the candlestick. The positions circled in the chart are observation points of this kind. Here, "earlier" refers to the observational sequence compared to the subsequent confirmation of the cloud, not knowing in advance how the market will move.
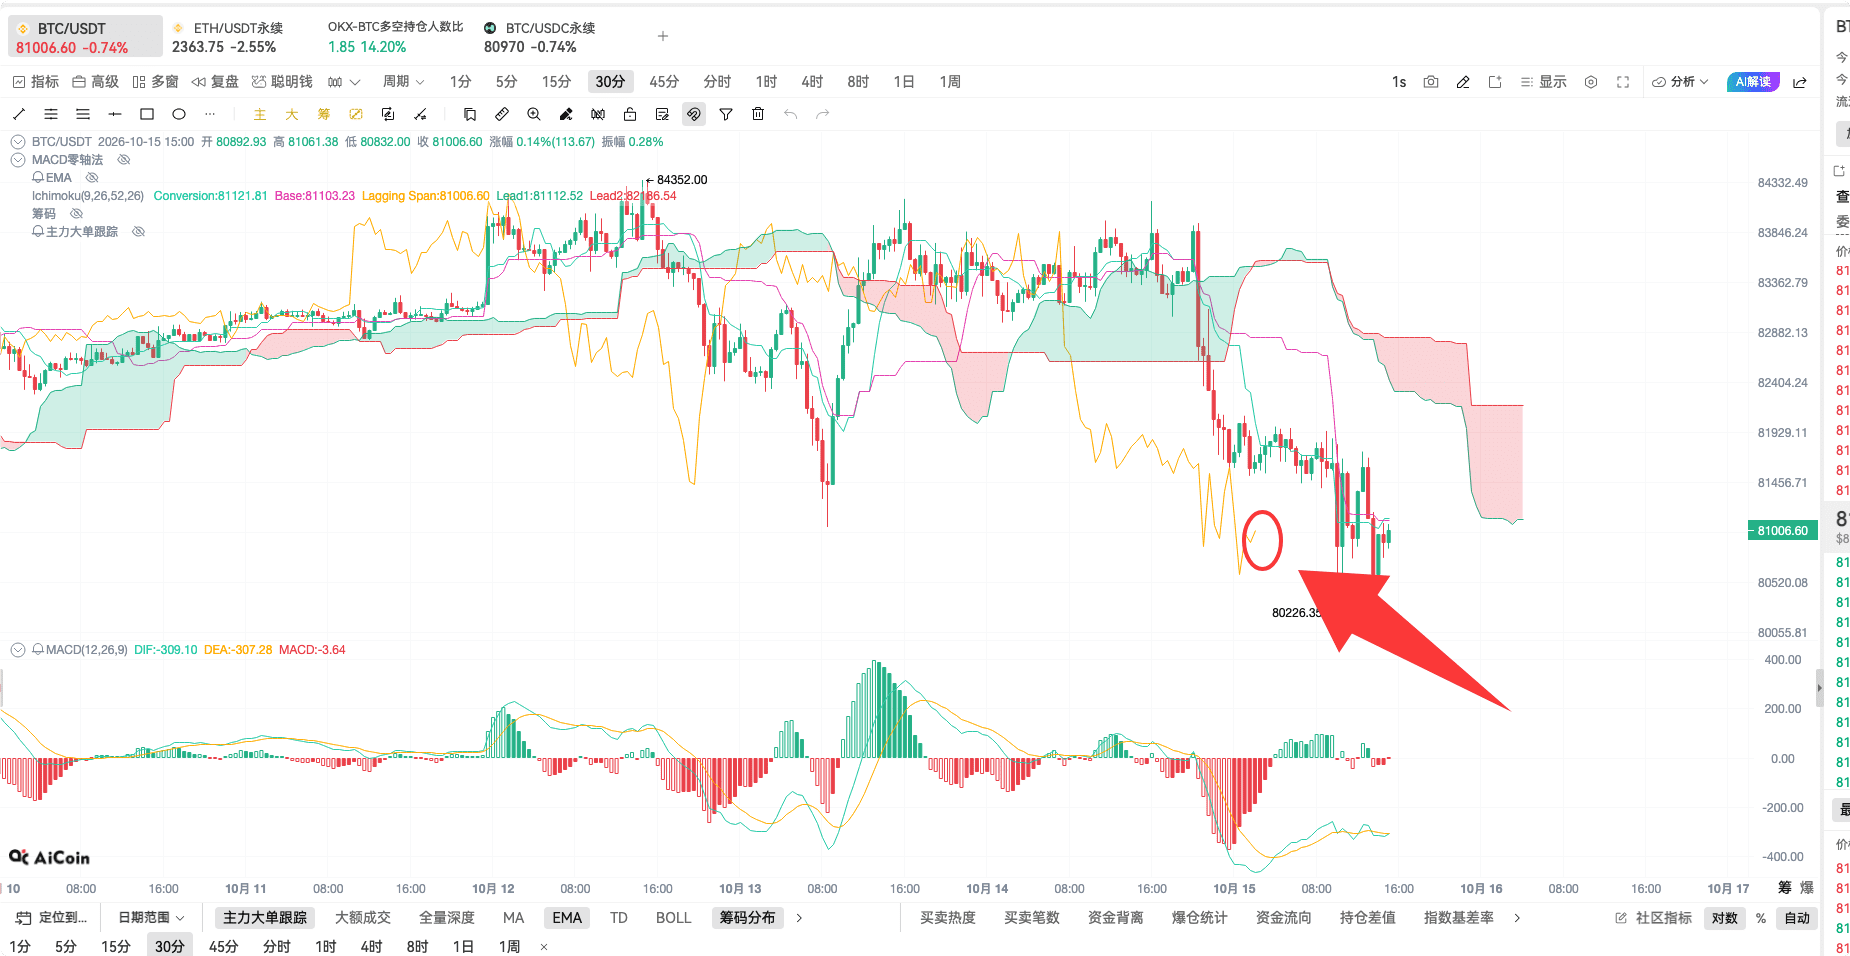
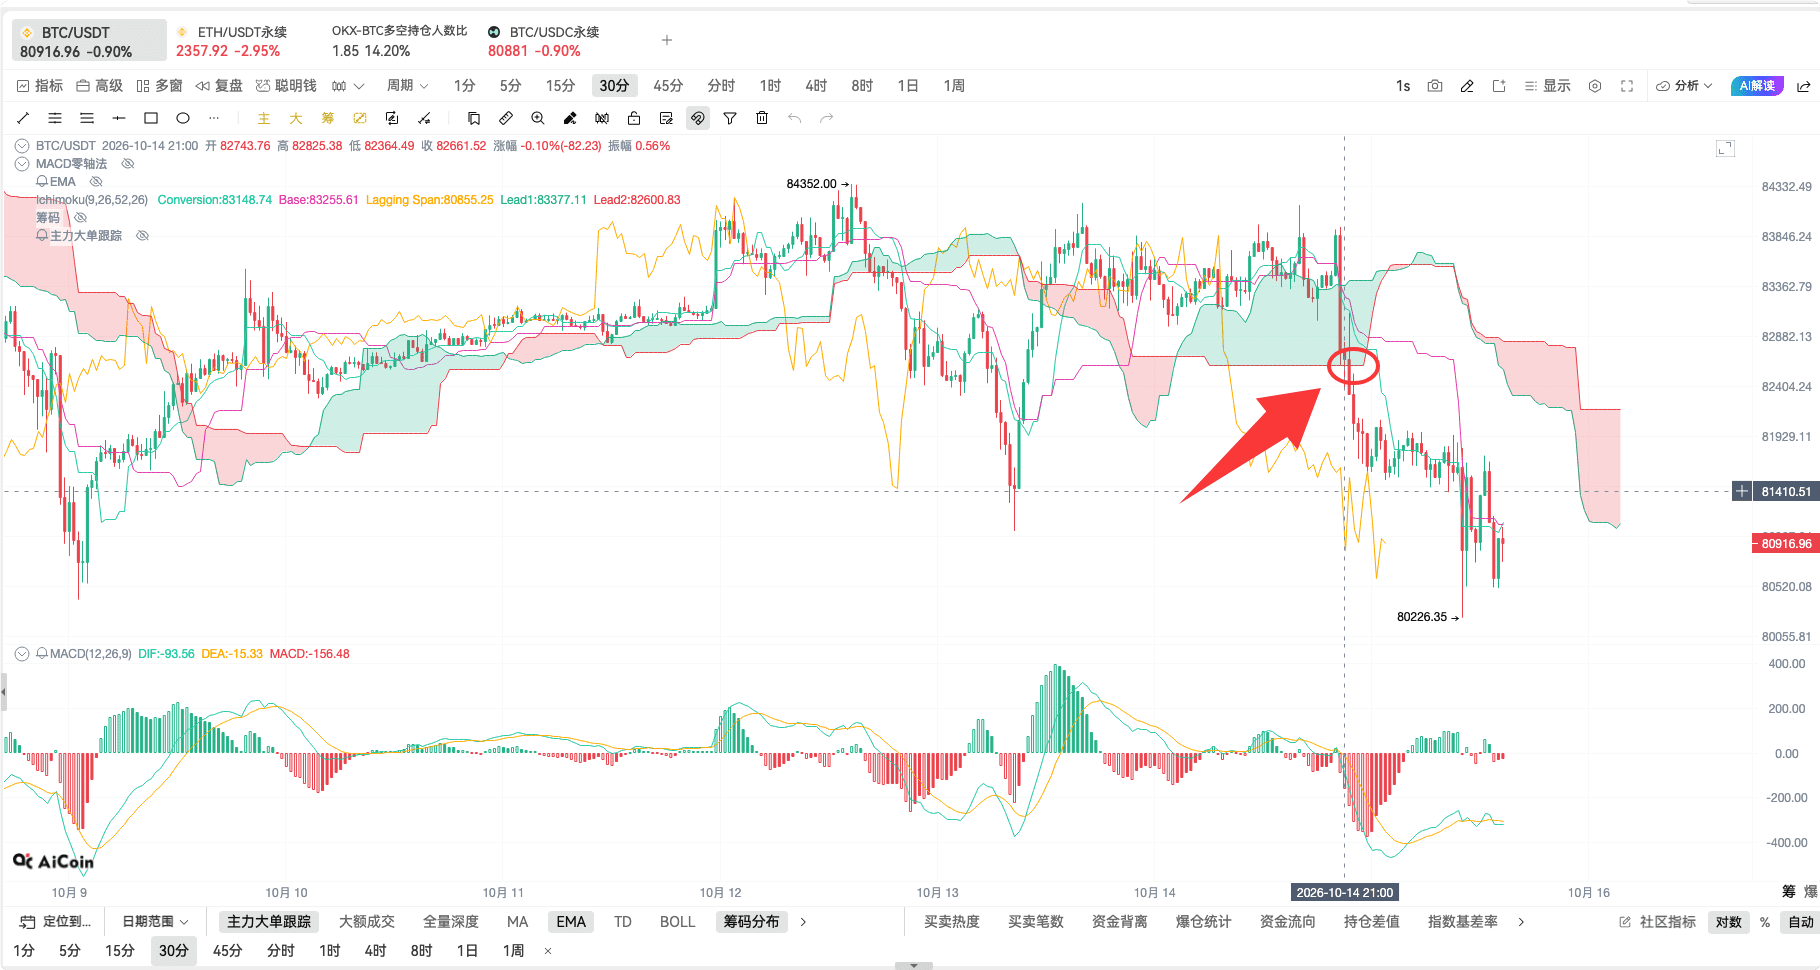
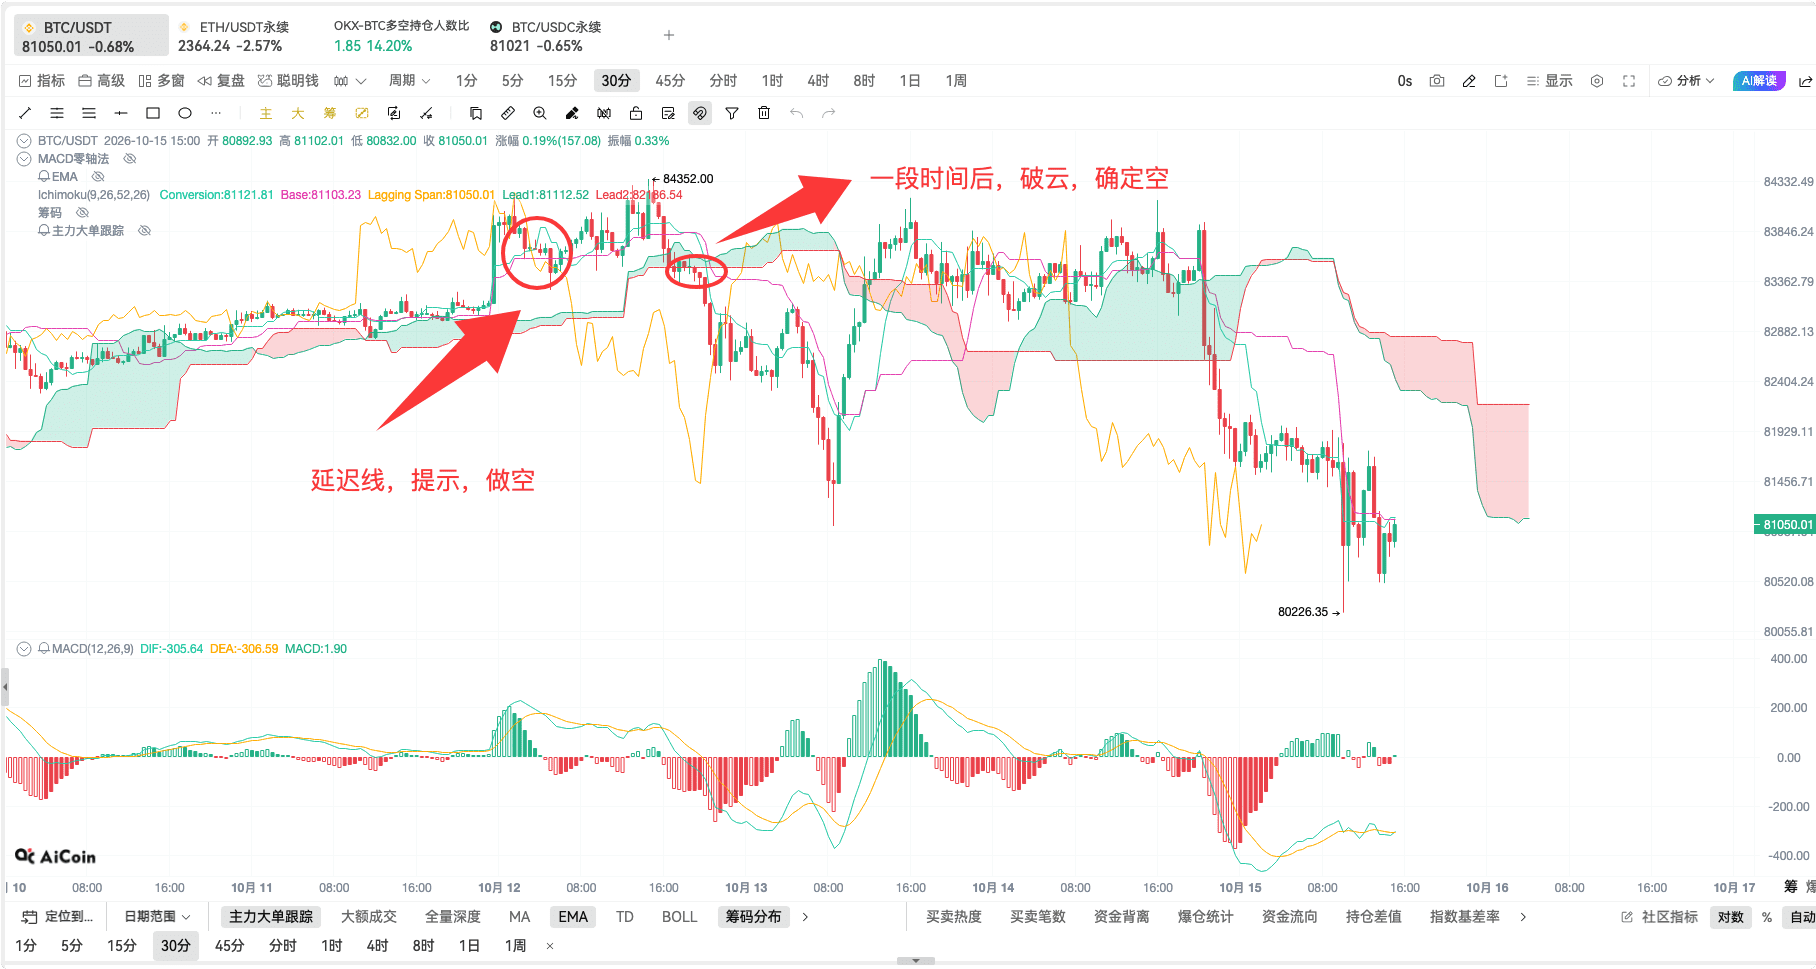
Looking at the short-selling case, the lagging line first provides a prompt by crossing downward through the candlestick, and after a while, the price breaks downward through the cloud. The two signals can be observed: the former hints at a change, while the latter helps confirm the direction.
If you want another layer of confirmation, look at the lagging line and the cloud together. If the lagging line is above the cloud, I lean toward a bullish trend; if it is below the cloud, I lean toward a bearish trend. If the lagging line crosses upward through the cloud, it is a condition for observing the buying direction; if it crosses downward through the cloud, it is a condition for observing the selling direction. The marked position in the chart is a case of crossing down through the cloud.
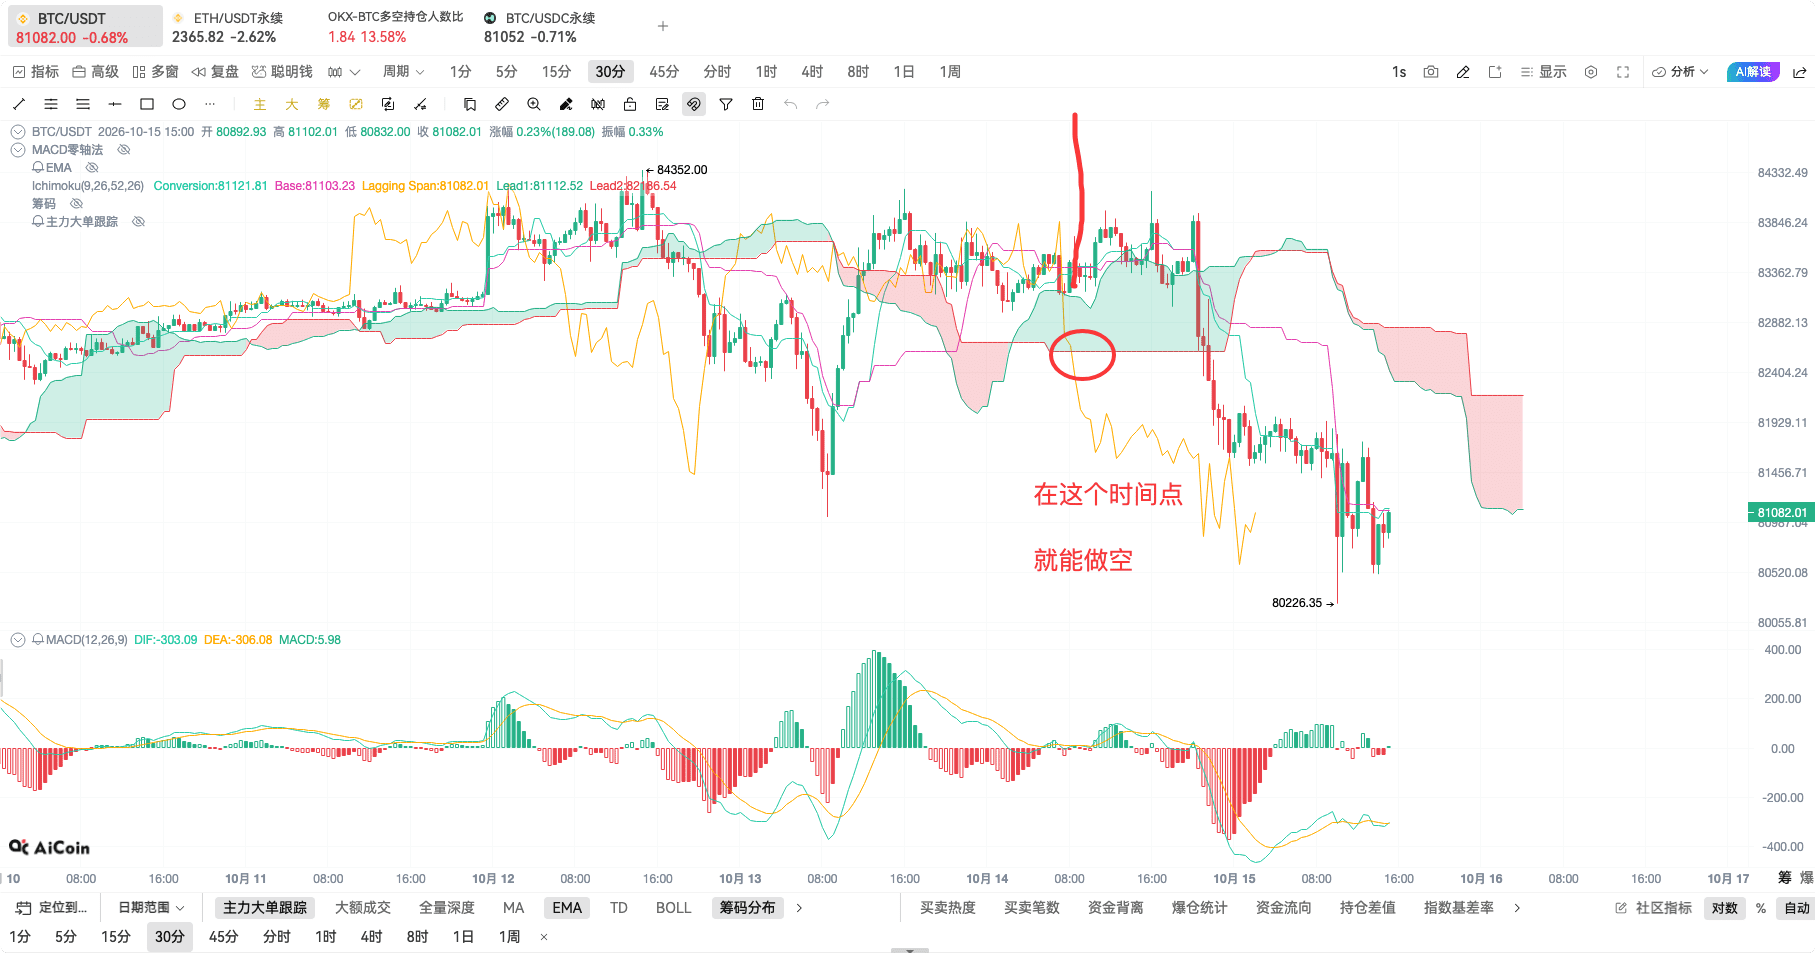
Looking at this short-selling position, it is similarly about comparing the lagging line with the cloud. Connecting the signals before and after is more useful than just truncating the subsequent decline, allowing us to understand better why this direction was considered at the time.
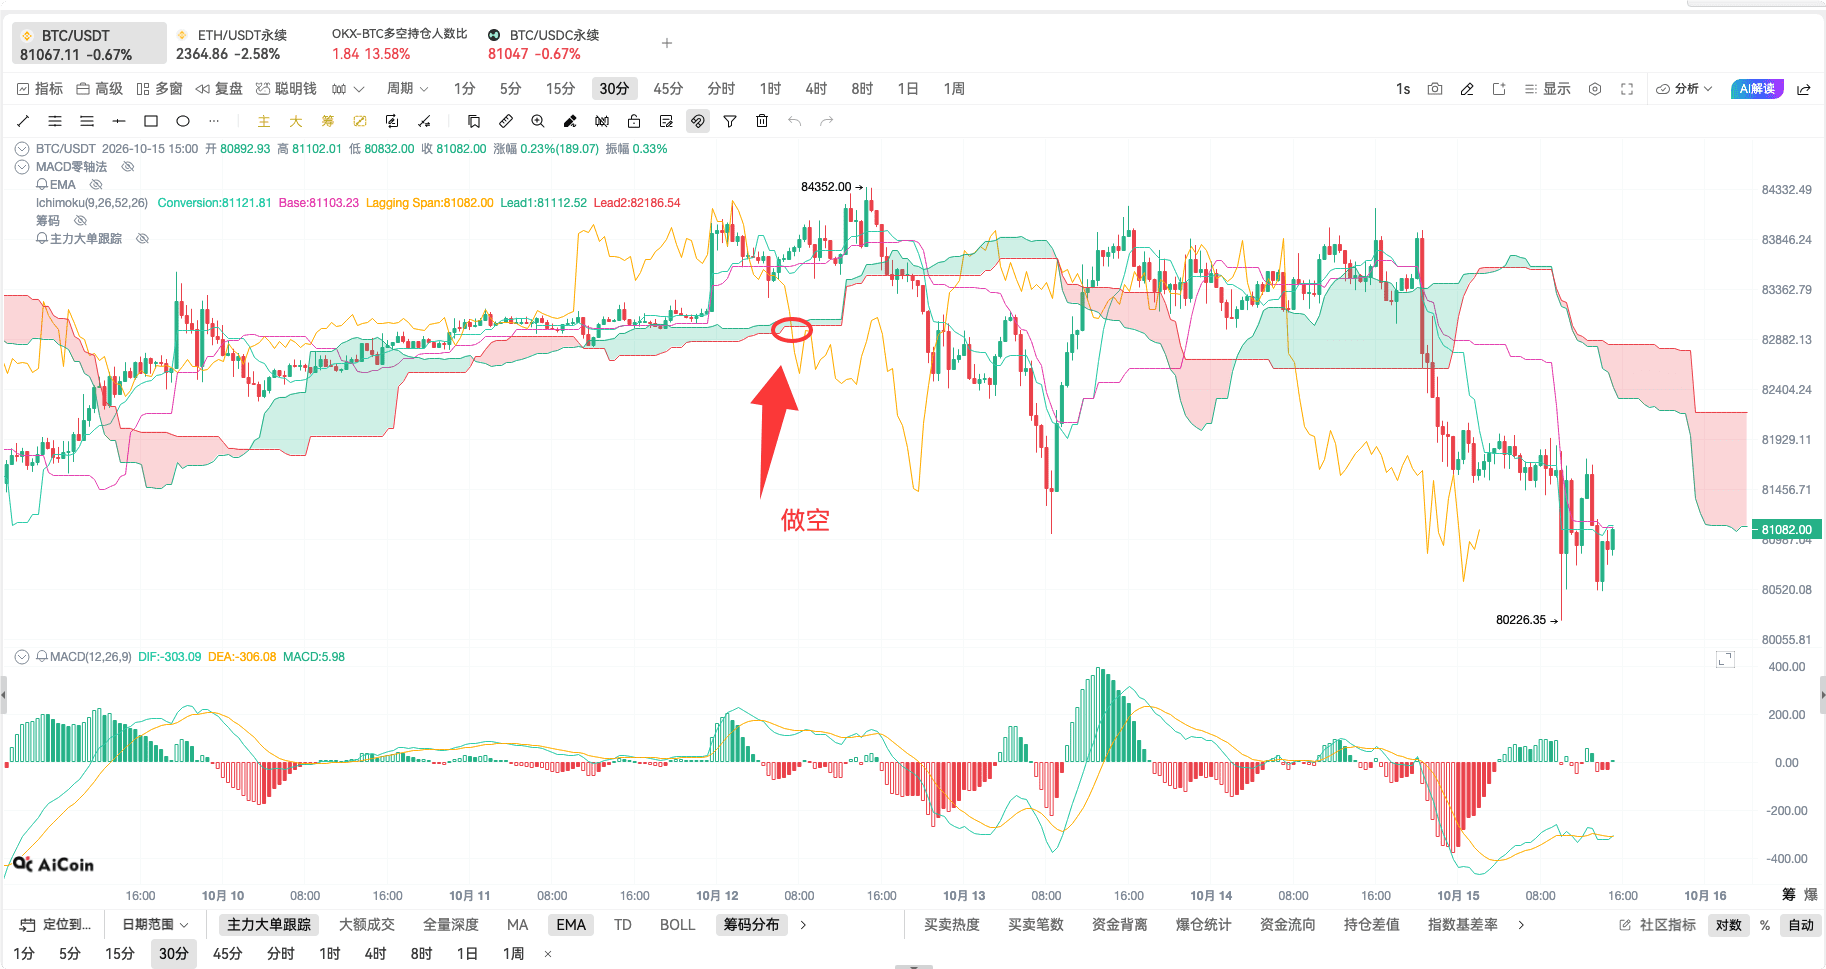
If the lagging line is still inside the cloud and the direction is not clear, I will refrain from acting. The role of this combination is to provide me an extra confirmation, reducing the repeated struggles when the direction is unclear; it can also fail at times, and just because the past few cases looked good does not mean the next one is inevitable.
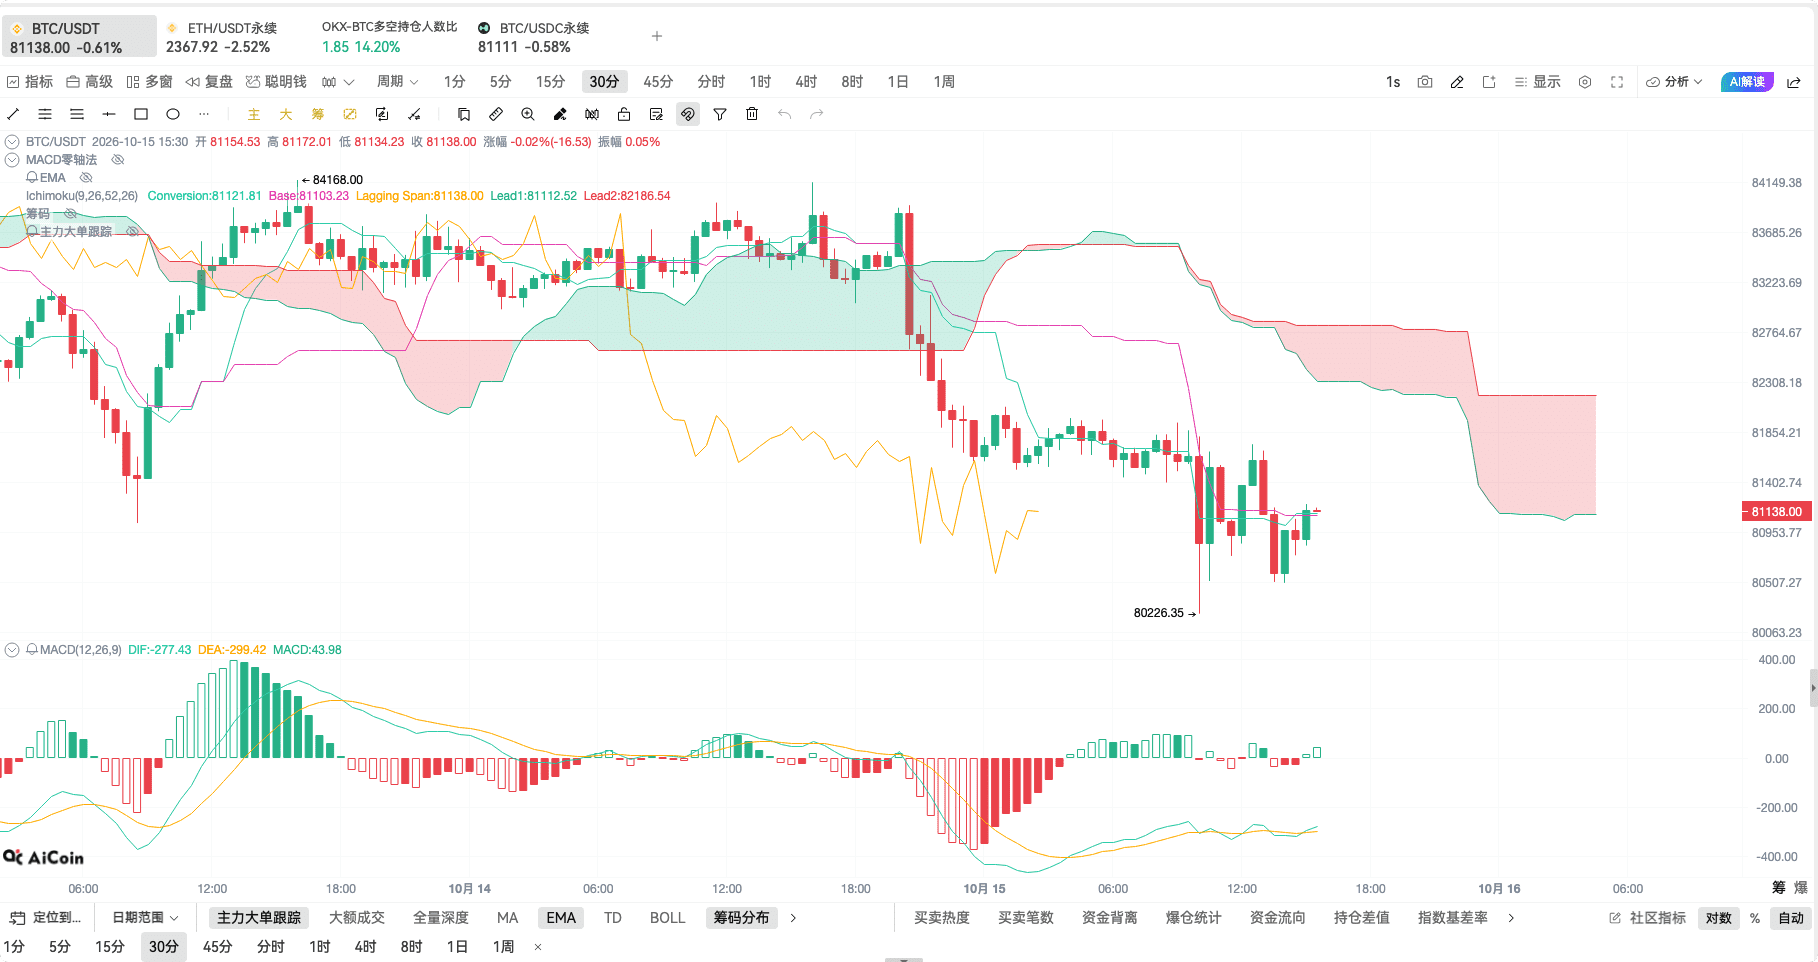
Returning to this BTC chart from the afternoon of October 15, zooming in reveals that the price is still below the cloud and the pressure from the cloud remains. I will continue to observe whether the lagging line can cross above the candlestick, whether the lagging line can cross above the cloud, and whether the price can cross above the cloud. I will assess them item by item before judging if the bearish environment has truly changed.
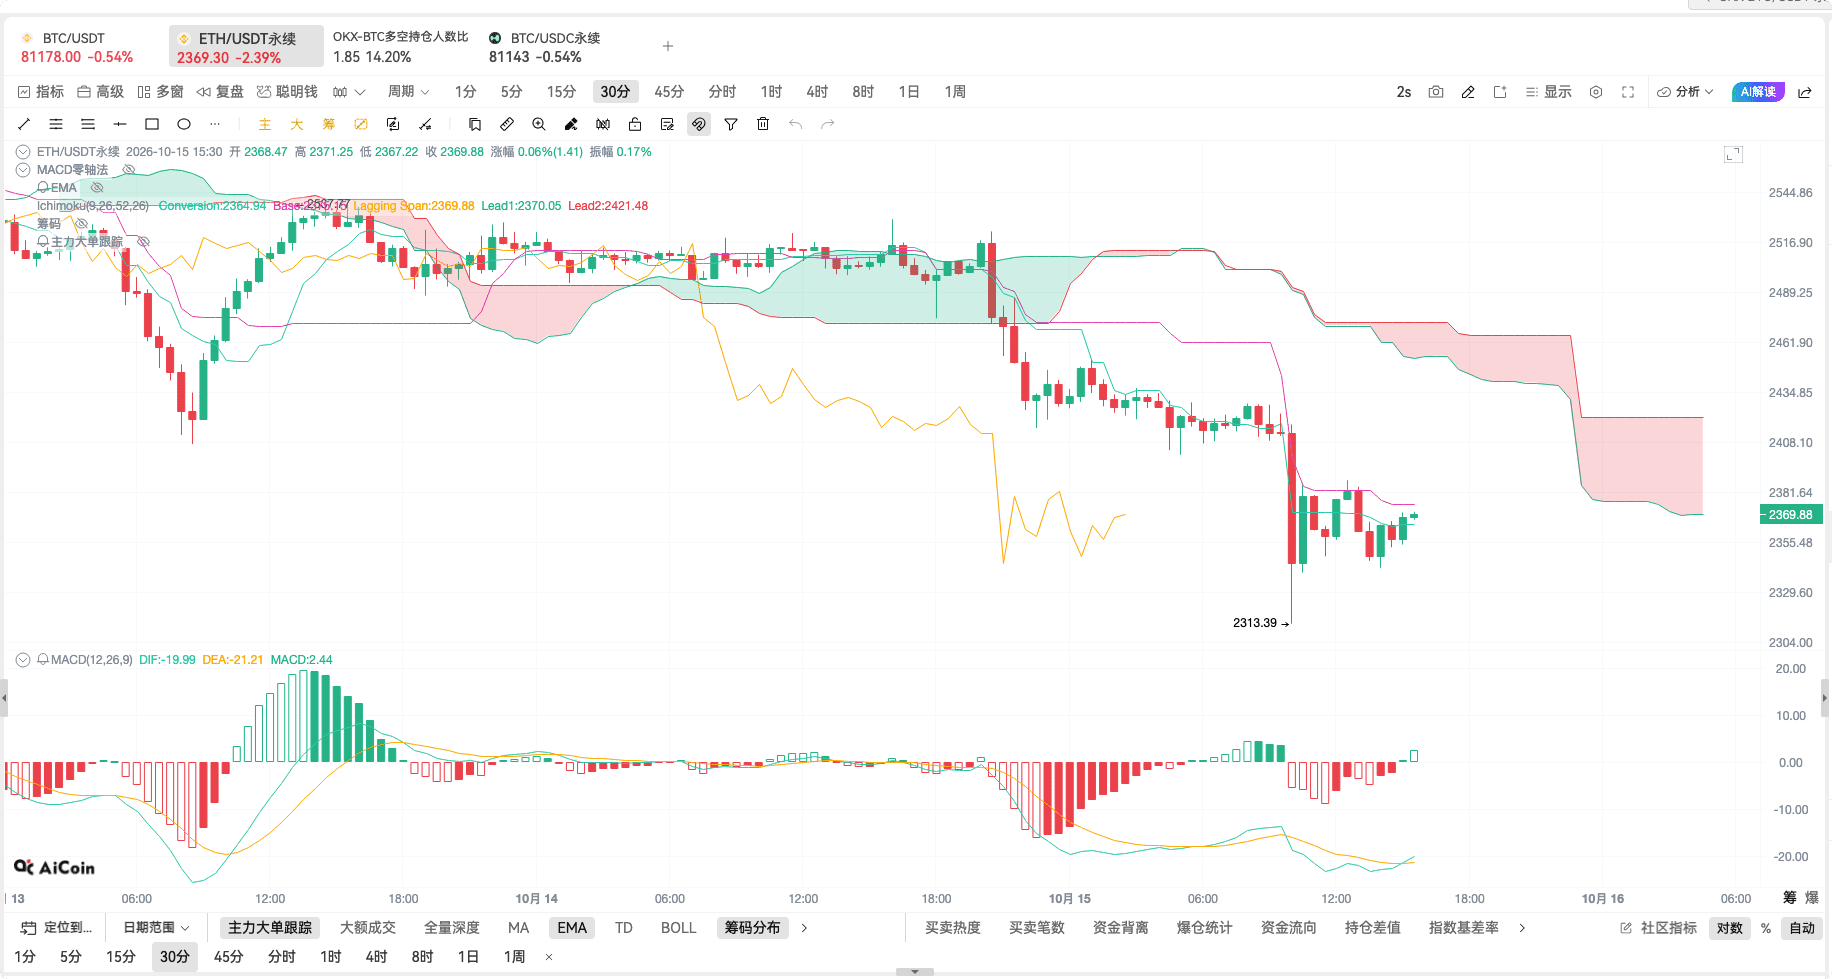
ETH's state at that time was similar, with the price still under pressure from the cloud above. In the short term, keep an eye out for any small pullbacks, but just because a pullback occurs does not mean the overall trend has reversed; we still need to see if the lagging line and price can produce the corresponding upward crossing signal afterwards.
When first getting acquainted with this set of indicators, there is no need to memorize all the names at once. When watching the market, first find the cloud, then look at which side the price is on, adding the lagging line for confirmation. When the direction is unclear, let your hands stay steady; the market won't become easier just because we click twice more.
Currently, live broadcasts are available every day; feel free to keep following AiCoin friends! Book in advance👇
https://www.aicoin.com/zh-Hans/live/list?tab=upcoming
Join our community, discuss together, and become stronger together!
Official Telegram community: https://t.me/aicoin_support
AiCoin Chinese Twitter: https://x.com/AiCoinzh
Aster rebate: https://www.asterdex.com/zh-CN/referral/9C50e2
Hype rebate: https://app.hyperliquid.xyz/join/AICOIN88
Binance rebate: https://jump.do/zh-Hans/xlink-proxy?id=3 Invite code: aicoin668
Coinbase rebate: https://jump.do/xlink?checkProxy=true&proxyId=25 Invite code: Y8L23JL
免责声明:本文章仅代表作者个人观点,不代表本平台的立场和观点。本文章仅供信息分享,不构成对任何人的任何投资建议。用户与作者之间的任何争议,与本平台无关。如网页中刊载的文章或图片涉及侵权,请提供相关的权利证明和身份证明发送邮件到[email protected],本平台相关工作人员将会进行核查。