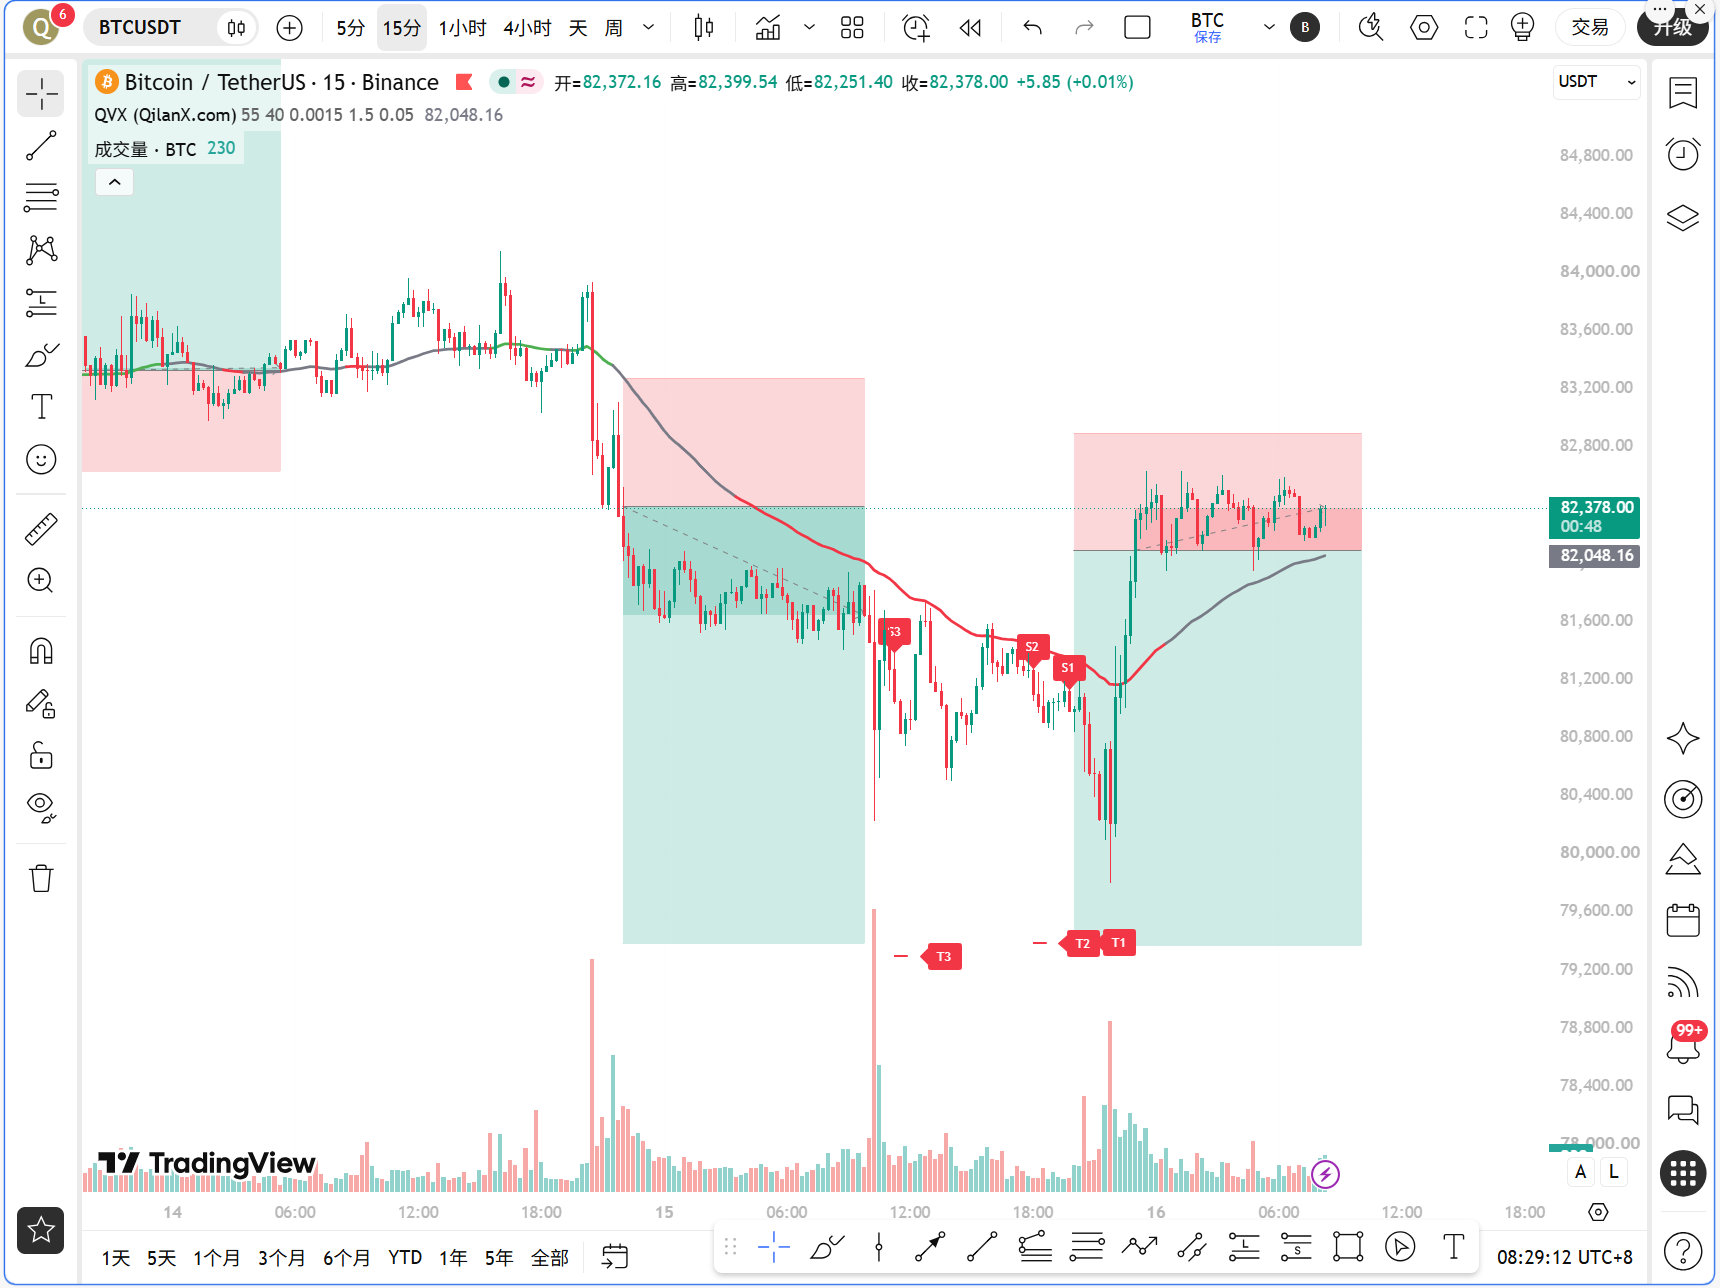
This morning, two pieces of news directly determined the market's bullish and bearish sentiment. The first news is that Charles Schwab officially launched direct trading of Bitcoin and Ethereum for retail clients. This asset management giant, which manages over $13 trillion, entering the market means that the funding channels of traditional finance have been further opened, which is a strong structural positive. The second piece of news is that the South Korean KOSPI index plunged 8% during the day, with Samsung Electronics and SK Hynix leading the decline. The panic selling of risk assets in the Asia-Pacific region directly dragged down the global cryptocurrency market sentiment. On one side is the long-term bullishness from institutional entry, while on the other is the short-term bearishness from macro hedging. BTC is just hanging on the life line of the 1-hour EMA55; today's movements are very crucial.
Current Price and Time
It is now October 16, 08:29, with BTC's latest quote at 82,378 USDT, a 24-hour increase of 0.75%. BTC market share is 59.35%, and the Fear and Greed Index is 63, indicating that market sentiment is still in the greed range. Note that the news mentioned BTC once dropped below 80,000 USDT, but the current price has risen back to 82,378, indicating that there is buying strength around the 80,000 mark, but the pressure above should not be ignored.
Multi-Cycle Status Overview
First, let's look at the daily level. The daily MA5 is 82,264.99, MA10 is 82,579.82, MA30 is 83,431.81, and the current price of 82,378 is just near the MA5, but still below the MA10 and MA30. The daily MACD bar is -484.01, DIF is 283.77, DEA is 767.78, and bearish momentum still dominates, RSI is 42.48, in the neutral to weak area. The overall structure of the daily is still in an adjustment pattern, with no clear reversal signals present.
Next, look at the 4-hour level. The 4-hour MA5 is 82,081.34, MA10 is 81,804.00, MA30 is 82,841.24, and the price of 82,378 has risen above the MA5 and MA10 but is still below the MA30. The 4-hour MACD has produced a golden cross, DIF is -321.13, DEA is -330.48, bar = 9.35, which is a positive signal for short-term stabilization. The 4-hour RSI is 43.17, recovering from a low, indicating that bearish momentum is weakening.
The 1-hour level is the core of today. The 1-hour MA5 is 82,324.60, MA10 is 82,338.34, MA30 is 81,660.53, and the moving averages are showing a budding bullish arrangement. The 1-hour MACD bar is 127.76, DIF is 148.80, DEA is 21.04, indicating clear bullish momentum. The 1-hour RSI is 64.18, relatively strong but has not entered the overbought area. Most importantly, the 1-hour EMA55 is 82,139.29, with the current price of 82,378 above the EMA55 by about 0.29%.
15-minute level. The 15-minute MA5 is 82,282.86, MA10 is 82,352.50, MA30 is 82,345.04, and the price is entangled near the moving averages. The 15-minute MACD bar is -30.45, DIF is 61.80, DEA is 92.25, showing slight bearish divergence. The 15-minute RSI is 62.53, neutral to strong.
TPV Signal Verification
According to the core rules of the Qinglan TPV system, we verify each condition one by one.
Trend positioning: The current price of 82,378 is greater than the 1-hour EMA55 of 82,139.29, remaining in the bullish trend area. However, note that the price is only 0.29% away from the EMA55, which belongs to line-bound fluctuations. This means the bullish-bearish boundary is very close; once breached, the trend may switch quickly.
Verification of long conditions. First, the price stays above the 1-hour EMA55; among the last 8 hourly candles, the closing price was above EMA55 7 out of 8 times, and it crossed 2 times, essentially meeting the condition of 2 consecutive closing prices above EMA55. Second, support stabilization form; currently at the hourly level, there are no obvious long lower shadows or bottom formations, but the 4-hour MACD golden cross provides some support signals. Third, bearish momentum exhaustion; the 1-hour MACD bar = 127.76 is positive and relatively large, RSI = 64.18 is recovering from a low, partially satisfying the momentum exhaustion condition.
However, there is a critical contradiction here. The oscillation auxiliary data indicates that the current price is less than 0.3% away from the EMA55, belonging to line-bound fluctuations, increasing the probability of oscillation. Additionally, the crossing times for the last 8 candles was 2 times, although this does not meet the standard definition of oscillation threshold, the risk of line-bound fluctuation must be cautious. Sister Qinglan's judgment is that it is currently at the edge of the bullish trend area; the long conditions are partially satisfied but not enough solid; it is necessary to wait for a clearer signal confirmation.
On-chain/Funding Situation
The Fear and Greed Index is at 63, in the greed range, indicating that market sentiment is not panicked, which diverges somewhat from the risk-averse sentiment caused by the sharp decline in South Korea's stock market. BTC market share is at 59.35%, with funds still concentrated in BTC, putting pressure on altcoins. The launch of BTC/ETH trading by Charles Schwab is a substantial positive; even a small proportion of a $13 trillion asset management scale allocated to cryptocurrency assets would yield a very considerable increment in expected funding. However, in the short term, the 9% PPI in the U.S. in September exceeded expectations at 6.3%, and the rising inflationary pressure may force the Federal Reserve to maintain tightening, which is the core macro variable suppressing risk assets.
Key Offensive and Defensive Levels
The first resistance level above is at 82,579 USDT, which is the position of the daily MA10. The second resistance level is at 82,841 USDT, corresponding to the 4-hour MA30. If a significant breakthrough occurs above 82,841, there is a chance to open space towards 83,431 USDT, the daily MA30.
The first support level below is at 82,139 USDT, which is the 1-hour EMA55, also the bullish-bearish boundary of the TPV system. The second support level is at 81,804 USDT, corresponding to the 4-hour MA10. If it drops below 81,804, there could be a retracement to 81,000 USDT or even the integer level of 80,000 USDT.
Trading Thoughts
Direction assessment: currently at a bullish trend area but close to the EMA55, belonging to a key node for direction selection. Sister Qinglan leans towards a cautious bullish stance but must wait for confirmation signals.
Conditions for long entry: The following three points need to be satisfied simultaneously. First, the 1-hour candles show 2 consecutive closing prices stable above EMA55 without falling below 82,139. Second, a clear support stabilization pattern appears, such as long lower shadows or bottom formations at the hourly level. Third, the 1-hour MACD bar continues to maintain positive and not shorten, and RSI stays above 55. Once all three conditions are met, one can enter a long position in the range of 82,200 to 82,300 with a light position.
Stop-loss setup: Place the stop-loss below 81,800 USDT, which is the position of the 4-hour MA10; breaching this level means the short-term bullish structure is broken.
Target levels: The first target is 82,800 USDT and the second target is 83,400 USDT. After reaching the first target, reduce the position by half and move the stop-loss of the remaining position to near the entry price.
If the price drops below 82,139 and 2 consecutive hourly candles close below EMA55, switch to a bearish thought process, enter short, and set the stop-loss above 82,500, targeting 81,000 and 80,000.
Risk Warning
The downward risk of Asia-Pacific risk assets triggered by the sharp decline in South Korean stocks is still fermenting, and the oscillation probability near EMA55 is increasing; strictly set stop-losses and do not hold losing positions.
Follow the Qinglan Crypto Classroom to grasp more trading opportunities! Welcome to visit the official website www.qinglan.org
📊 Qinglan TPV Trading Strategy Backtesting Reference
🕒 Last Backtesting Time 10-16 07:00:01
Total Analysis: 4,438 Backtests: 4,430 Accuracy Rate: 77.6% (3,436/4,430)
免责声明:本文章仅代表作者个人观点,不代表本平台的立场和观点。本文章仅供信息分享,不构成对任何人的任何投资建议。用户与作者之间的任何争议,与本平台无关。如网页中刊载的文章或图片涉及侵权,请提供相关的权利证明和身份证明发送邮件到support@aicoin.com,本平台相关工作人员将会进行核查。