If you want to find U.S. stocks worth paying attention to, starting from the "gainers list" often leads to chasing high prices; instead, observing the top ten by trading volume can answer another more fundamental question: Where is the market currently putting the most funds and attention?
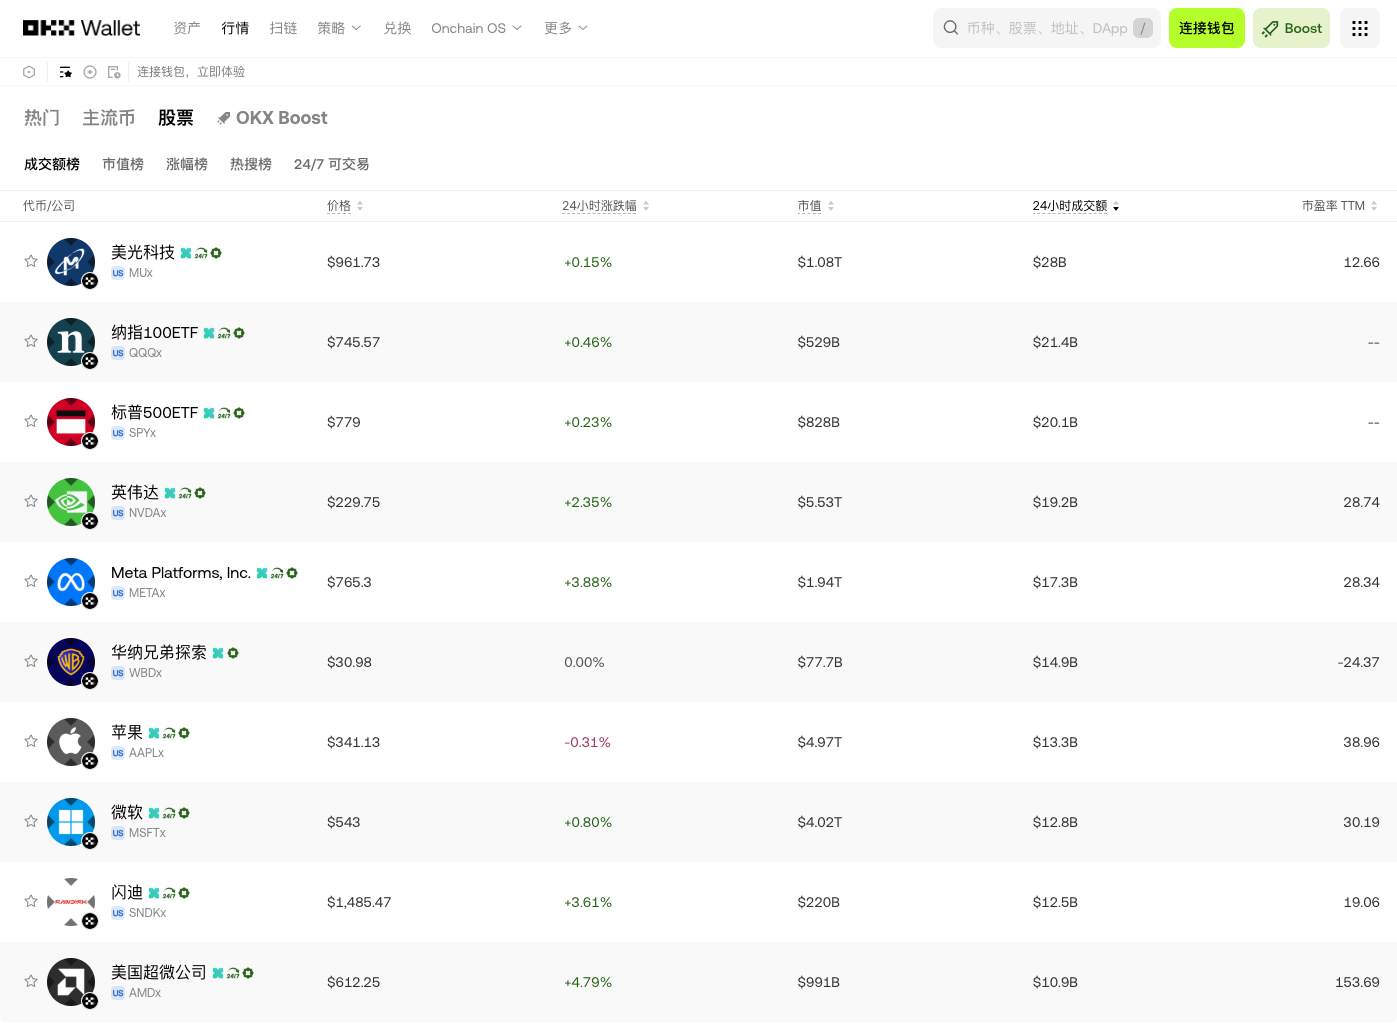
The OKX wallet stock market shows that in the current page's U.S. stock list, the top ten assets by 24-hour trading volume exceed $174 billion. The list also covers semiconductors, AI, index ETFs, consumer technology, and event-driven assets, reflecting that the current market trading focus is not limited to a single industry but rotates among several high-focus tracks.
Top Ten by Trading Volume: Overview of the Data
The top ten are as follows:
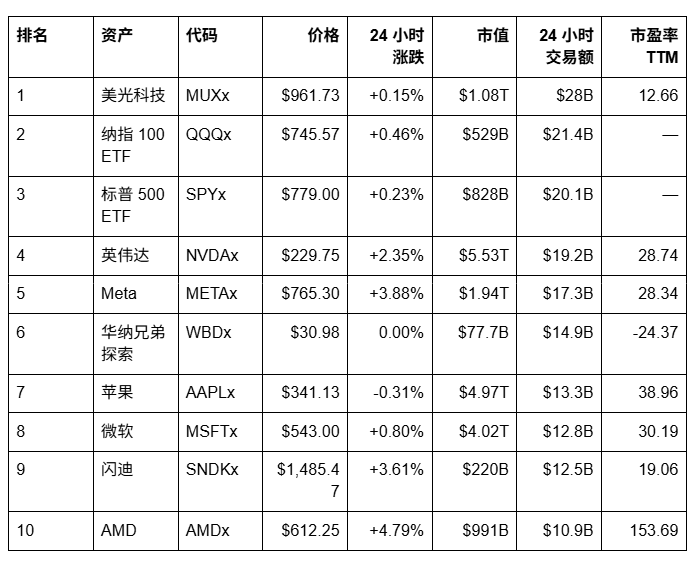
Prices, trading volumes, market capitalizations, and price-to-earnings ratios will continue to change; assets belong to on-chain stocks or ETF-mapped assets displayed on the OKX wallet page.
First Main Line: Semiconductor Assets Occupy High Trading Volume Positions
The most obvious structure in the list is the concentration of semiconductor-related assets: Micron Technology, NVIDIA, SanDisk, and AMD all enter the top ten.
Among them, MUXx has a 24-hour trading volume of approximately $28 billion, ranking first; NVDAx at approximately $19.2 billion, SNDKx at approximately $12.5 billion, and AMD x at approximately $10.9 billion. The total of these four is approximately $70.6 billion, accounting for about 40% of the total trading volume of the top ten.
This shows that funds are still concentrated on directions such as AI computing power, memory, and the chip supply chain. Market trading is not about a single company story, but a supply chain from training chips, data centers, to storage infrastructure.
However, the high trading volume in the semiconductor sector also means higher expectations and faster price changes. AMD shows a TTM price-to-earnings ratio of about 153.69, significantly higher than NVIDIA's approximately 28.74 and SanDisk's approximately 19.06. High valuations may reflect the market's expectations for future growth, and it also means that once performance, deliveries, or orders fall short of expectations, prices may undergo more severe repricing.
For newcomers, seeing high trading volumes for semiconductor assets should not lead to a direct conclusion of "buying will result in gains". A more reasonable step is to use trading volume as a clue for attention, and then combine it with valuations, earnings reports, orders, customer capital expenditures, and technical assessments.
Second Main Line: QQQx and SPYx Represent More Diversified Market Entrances
The second and third places on the list are the Nasdaq 100 ETF QQQx and the S&P 500 ETF SPYx, with 24-hour trading volumes of approximately $21.4 billion and $20.1 billion, respectively.
Their distinction from individual company assets is that index ETFs represent a group of companies and industries. QQQx leans more towards large tech and growth stocks, while SPYx covers a broader range of large-cap assets.
For beginners who are just starting to explore U.S. stocks, the research path for index assets is relatively clear: there is no need to determine which among Apple, NVIDIA, or Microsoft will outperform, one can first observe the overall market risk appetite.
If both QQQx and SPYx maintain high trading volumes, it indicates that the market is not only trading single hot companies but is also allocating to broader index directions. The performance differences between the two can help users judge whether funds are leaning towards tech growth or more diversified large-cap allocations.
Of course, index ETFs are not low-risk assets either. The weight of technology stocks, interest rates, valuations, and macroeconomics can all affect prices. They reduce the risk of single companies but do not eliminate market risk.
Third Main Line: Meta, Apple, and Microsoft Are Still Core Assets with High Liquidity
METAx, AAPLx, and MSFTx also made it to the top ten, with 24-hour trading volumes of approximately $17.3 billion, $13.3 billion, and $12.8 billion.
Meta's daily increase is approximately 3.88%, making it one of the higher gainers among large tech assets on the list; Microsoft increased by approximately 0.80%; Apple decreased by approximately 0.31%. This set of data demonstrates that even though they are all large tech companies, short-term funding behavior can exhibit significant differentiation.
Meta: Repricing of Advertising Business and AI Investment
Meta's core revenue comes from advertising, and the role of AI is mainly reflected in recommendations, ad matching, and content generation efficiency. The market will focus on whether AI can enhance ad conversion, rather than just looking at the strength of the models themselves.
Apple: Ecological Moat and New Product Cycle
Apple's advantage comes from the synergy between hardware, systems, services, and user habits. AAPLx has a market capitalization of approximately $4.97 trillion in the screenshot, with a TTM price-to-earnings ratio of approximately 38.96. High valuations mean that the market has already incorporated high expectations for the brand, service revenue, and future product cycles.
Microsoft: Enterprise Software, Cloud, and AI Commercialization
Microsoft's key lies in whether Copilot, Azure AI, and enterprise services can convert technological investment into sustained revenue and profit. The TTM price-to-earnings ratio is approximately 30.19, and the market is still paying a premium for stable cash flow and AI growth.
These three types of assets are suitable as fundamental research samples for beginners, but one cannot decide to buy solely based on trading volume rankings. Trading volume represents market activity but does not equal cheap valuations or greater price upside potential.
Fourth Type of Asset: WBDx Reminds Users to Pay Attention to Event-Driven Risks
Warner Bros. Discovery WBDx ranks sixth with a 24-hour trading volume of approximately $14.9 billion, but the screenshot shows a daily change of 0.00% and a TTM price-to-earnings ratio of approximately -24.37.
Its logic is different from that of Apple, Microsoft, and NVIDIA. WBDx's high trading volume may come more from company events, mergers and acquisitions, asset disposals, media business expectations, or market divergences.
Characteristics of these types of assets include: trading opportunities may come from significant news, but risks are also more concentrated. When researching WBDx, users should prioritize looking at company announcements, balance sheets, cash flows, debts, and restructuring progress, not just the trading volume.
How to Use Trading Volume Rankings?
The trading volume rankings are most suitable for fulfilling three functions.
1. Discover What the Market is Trading
High trading volume means that there are more funds participating in the asset, which usually also indicates a higher density of market information. Users can start building a research list from the rankings instead of blindly sifting through a large number of stocks.
2. Observe Where Funds Are Focused
By classifying the top ten by industry, one can see the distribution of funds in semiconductors, AI, large-cap indices, and large tech stocks. If multiple related assets enter the rankings simultaneously, it may indicate that a certain theme is forming sector-level trading.
3. Assess the Activity of On-Chain Trading
For xStocks on the OKX wallet, users also need to combine on-chain TVL, 24-hour trading volume, and liquidity to determine whether it is easy to enter and exit. The large market trading volume of traditional U.S. stocks does not necessarily mean that the corresponding on-chain mapped assets have the same depth.
How Can Beginners Participate in Mapped U.S. Stocks through OKX Wallet?
For many beginners, the barriers to participating in traditional U.S. stocks include not only stock prices but also opening an account, depositing, exchanging currency, trading time, and account management.
The advantage of the OKX wallet is that it consolidates xStocks assets, market data, on-chain data, and trading gateways into a single Web3 wallet. Users can view stock and ETF mapped assets in supporting networks like X Layer, combine price, gains and losses, trading volume, TVL, and liquidity for assessments, and then execute plans using limit orders, take profit, and stop-loss tools.
A more beginner-friendly process is:
- Start with assets like QQQx, SPYx, and Apple that you can understand;
- Check real-time prices, trading volumes, TVL, liquidity, and mapping ratios;
- Research the fundamentals of the company or index, not just look at the rankings;
- Familiarize yourself with the exchange, ordering, and exit processes using small amounts of capital;
- Set limit orders and take profit/stop-loss to avoid chasing high prices or panic selling due to short-term volatility;
- Confirm regional eligibility, asset mechanisms, trading times, and redemption conditions before trading.
Conclusion: Top Ten by Trading Volume is Not a Buying List, but a Starting Point for Research
What is most worth paying attention to in this list is not that a specific asset ranks first, but that it shows the direction where funds are focusing:
- Micron, NVIDIA, SanDisk, and AMD represent semiconductors and AI infrastructure;
- QQQx and SPYx represent more diversified index allocations;
- Meta, Apple, and Microsoft represent large tech platforms;
- WBDx represents event-driven and high-divergence assets.
For newcomers, starting from the top ten by trading volume to discover market hotspots, then returning to fundamentals, valuations, news, and technical aspects, and finally choosing a suitable on-chain U.S. stock entry through OKX Wallet will be more rational than blindly chasing gains.
Exclusive Benefits for AiCoin Users
Use the OKX Web3 wallet, "Invest in Assets Worldwide"!
Bind invite code 【AICOIN88】 to enjoy a 20% savings on trading costs (such as Gas optimization benefits)!
Download/upgrade OKX Web3 Wallet now and catch the wave:
https://jump.do/xlink?checkProxy=true&proxyId=24
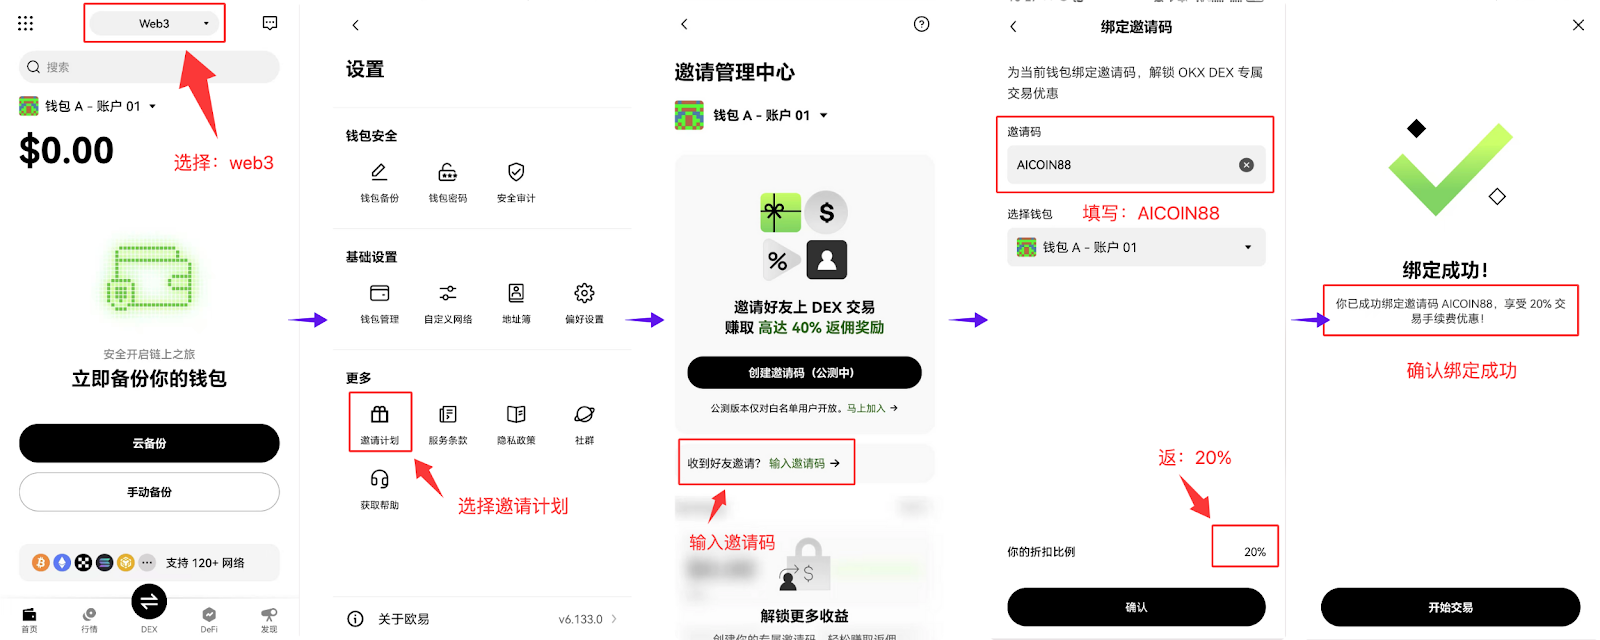
Don't wait any longer, set up the OKX wallet and bind the benefits to acquire new wealth!
免责声明:本文章仅代表作者个人观点,不代表本平台的立场和观点。本文章仅供信息分享,不构成对任何人的任何投资建议。用户与作者之间的任何争议,与本平台无关。如网页中刊载的文章或图片涉及侵权,请提供相关的权利证明和身份证明发送邮件到support@aicoin.com,本平台相关工作人员将会进行核查。


