Good evening everyone, it has been several days since the last update. The recent trades have been going well, and the rhythm is acceptable.
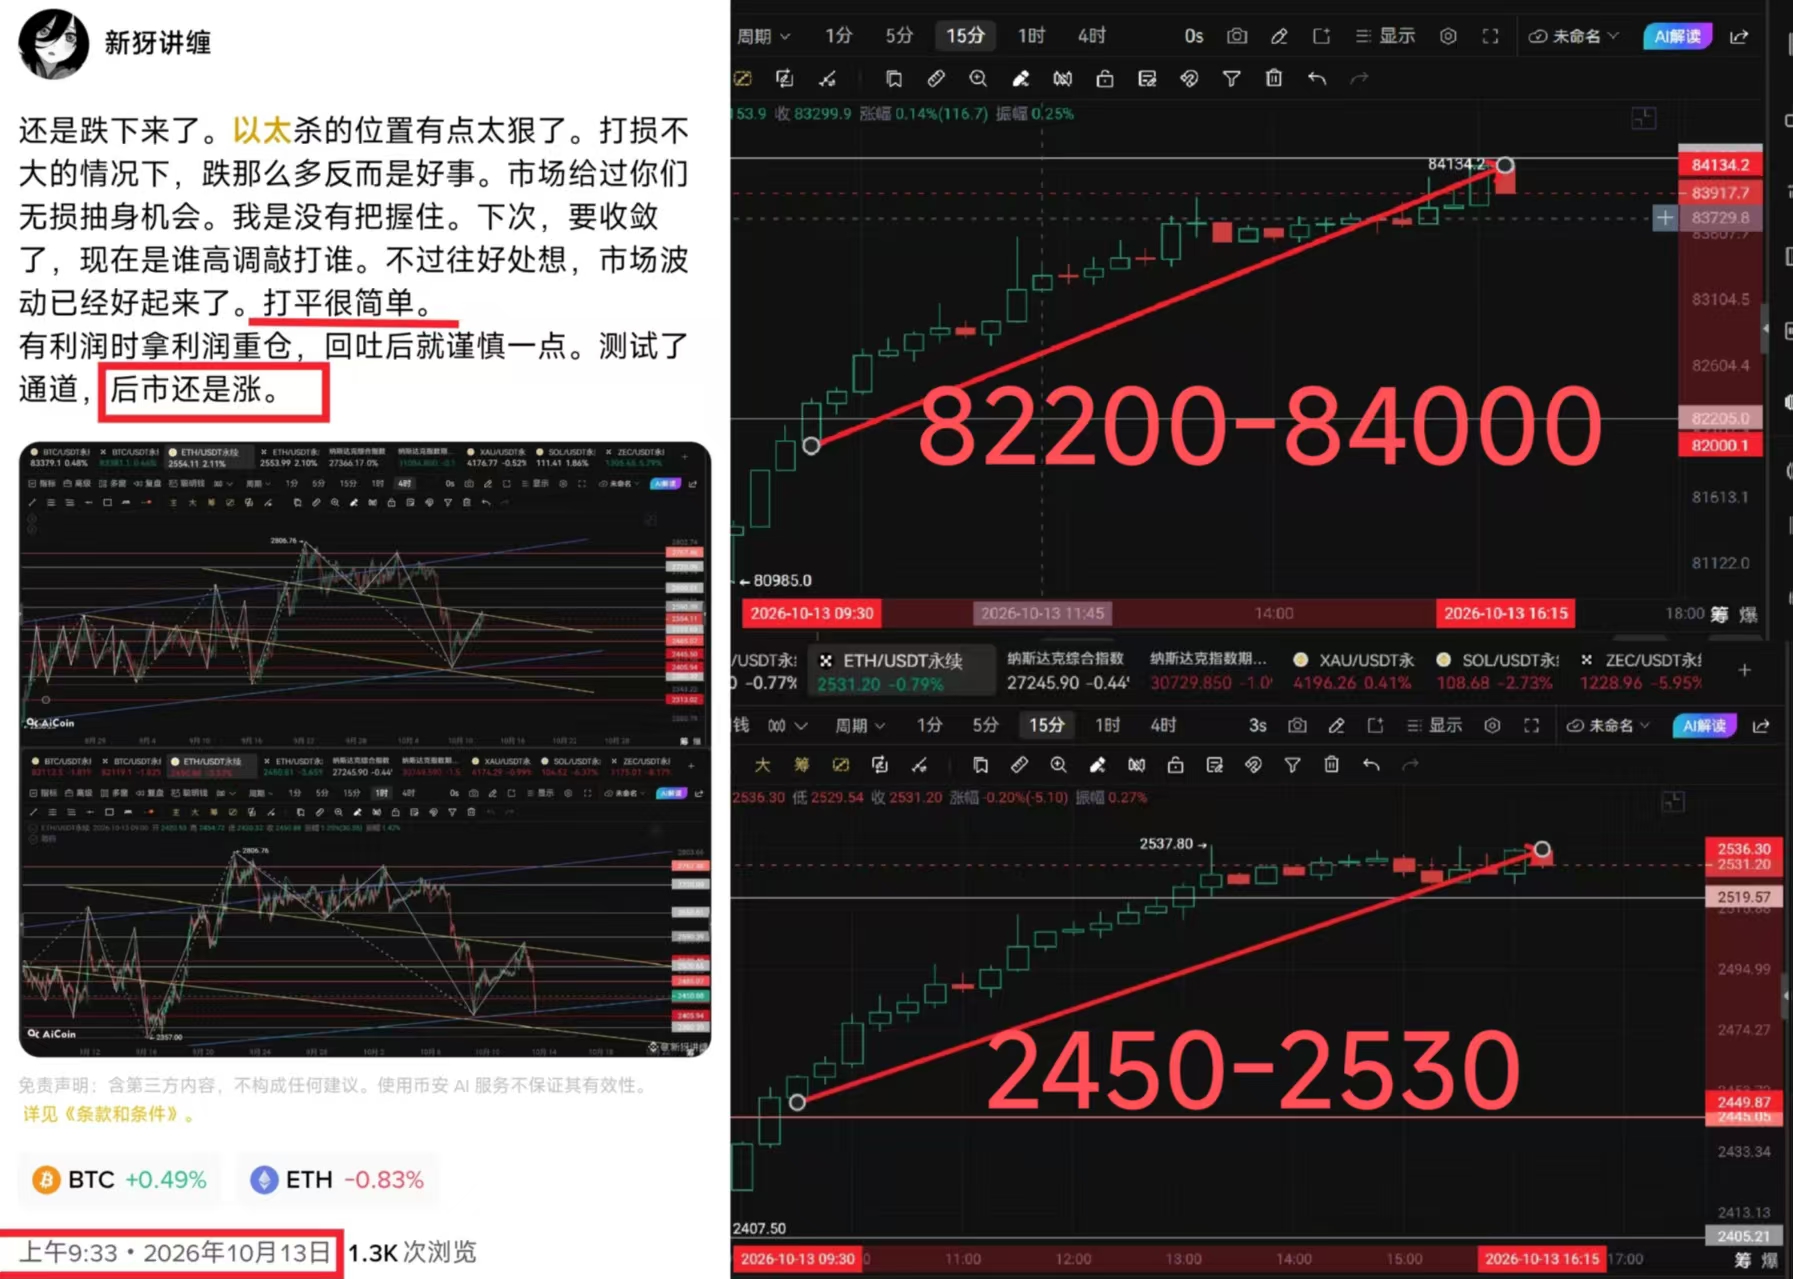
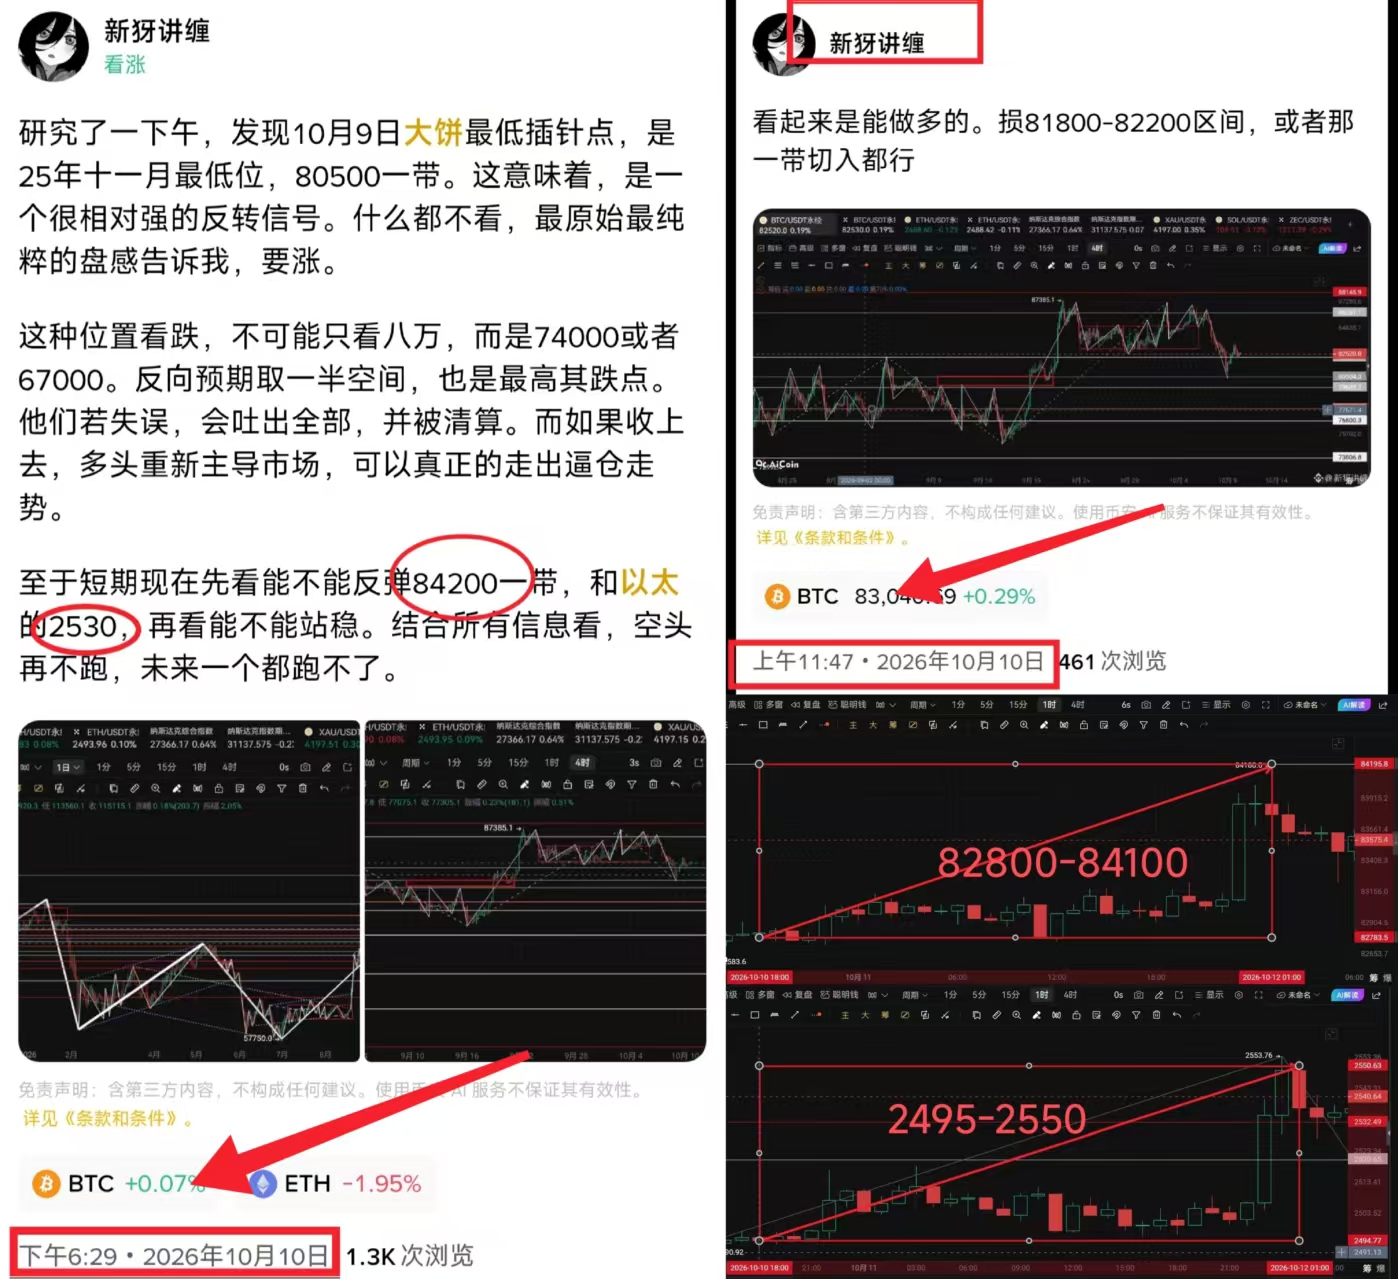
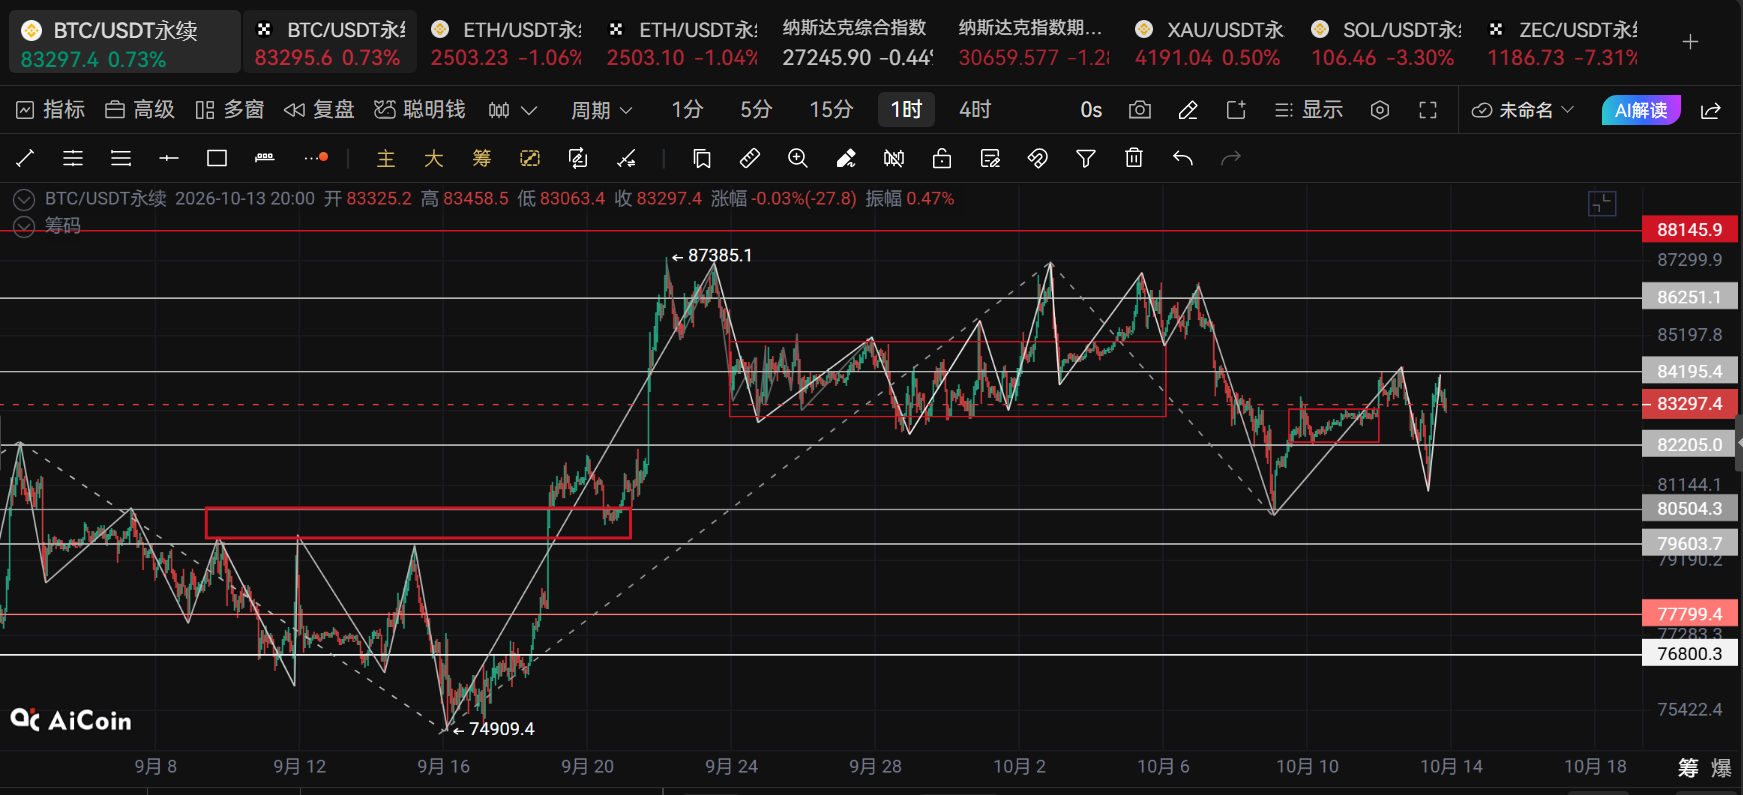
Let’s briefly review. Starting on the 12th, Bitcoin started to decline around 84350. At half past eight in the evening, the bears intensified the sell-off. After pulling back for four hours, it rebounded around 82300 to the sell-off point at 83200 and faced resistance again. After dipping down to 80895, it made a V-shaped rebound, reaching a high of around 84150 at half past four in the afternoon, and then retraced to test 83200 again.
It can be seen that during the process, 83200 became a pressure point twice, while 82200 saw a small rebound on the first approach, but when it broke down the second time, there was a significant sell-off. During the V-shaped rebound, when it touched 82200, buying volume decreased, and when it reached 82800, buying pressure was ignited. This clearly indicates a market continuation that tricks the bears into liquidating their positions.
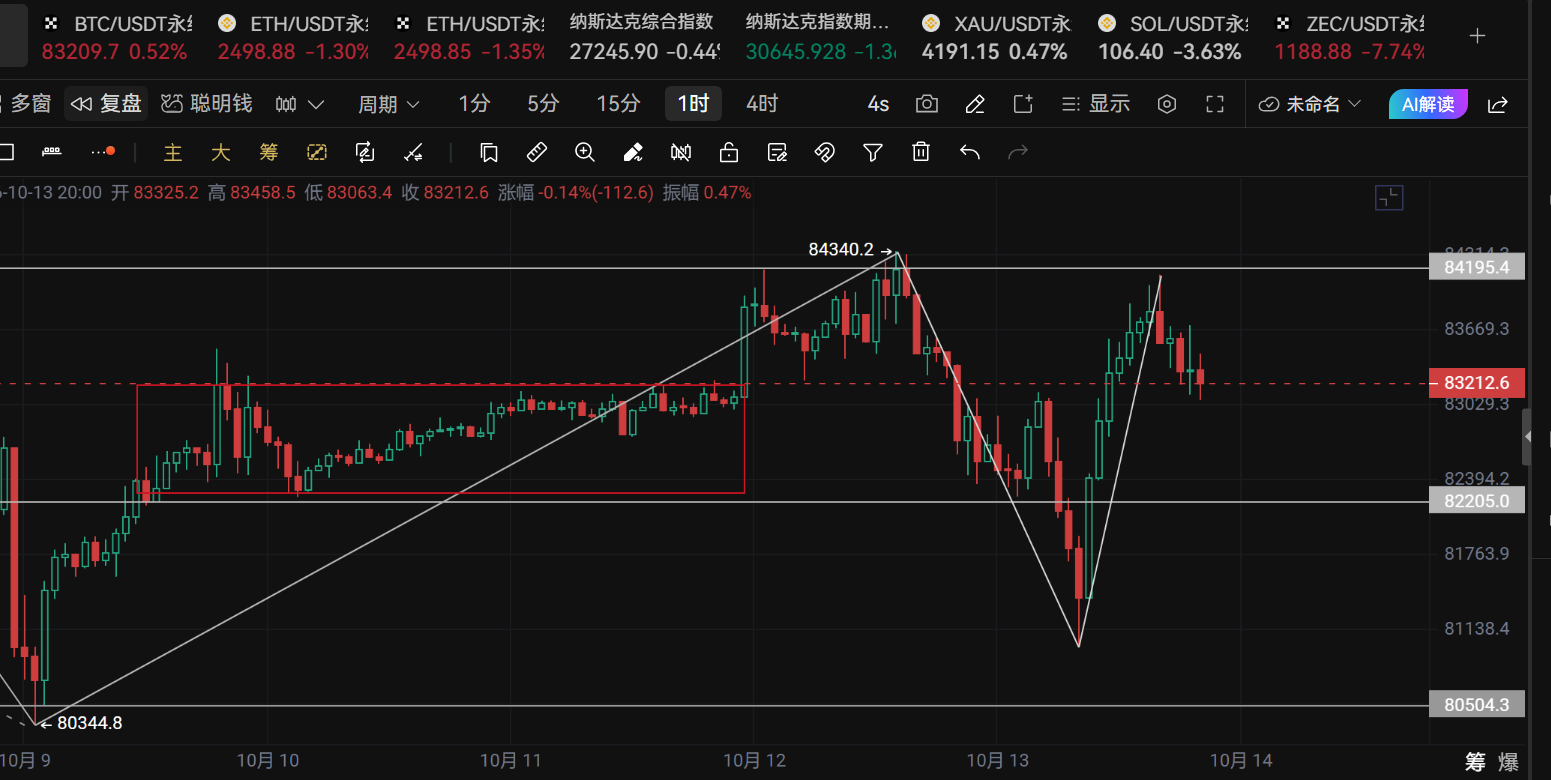
The area of divergence is concentrated between 82200-83200. This range needs to be closely monitored as it represents the center of the previous one-hour price movement.
Due to the mixed and fluctuating market sentiment, we can observe the four-hour consolidation recently.
The structure is particularly complex, and market sentiment fluctuates; it’s best to handle matters around the points of divergence. If the market stabilizes around 85200, it can upgrade to a four-hour uptrend, testing 86200, and may reach as high as 88800. Conversely, if it breaks below 80500-79800, the market will undergo a four-hour downtrend towards 77500 and 75400.
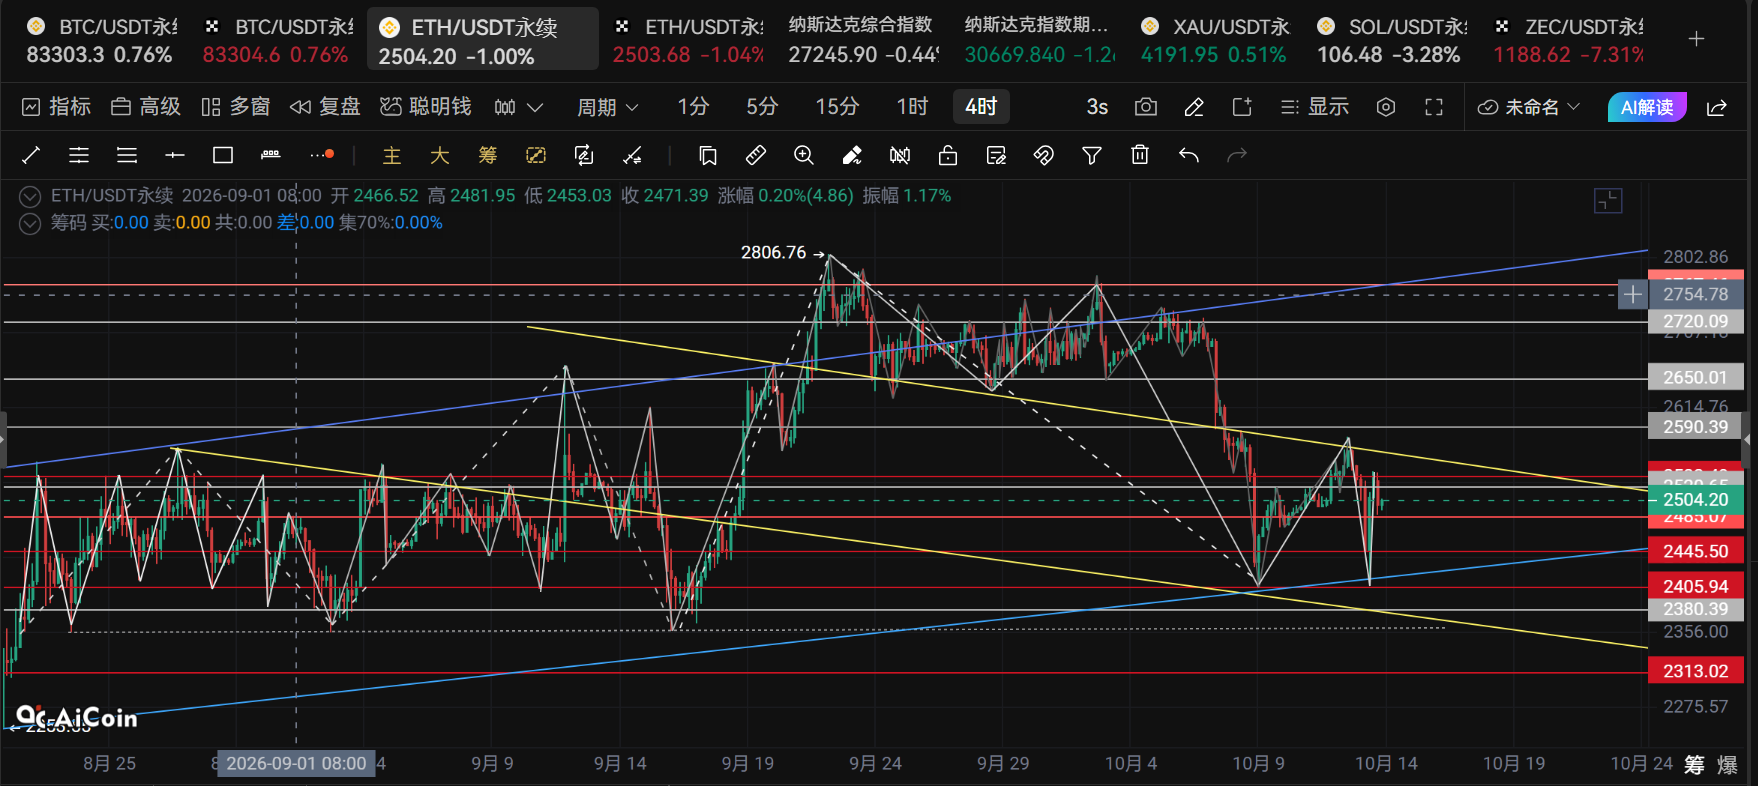
Due to the fullness of both bullish and bearish expectations, the market divergence is significant!
For Bitcoin, pay attention to 84200, 85200, 86200 above, and 82200, 81200, 80500 below.
For Ethereum, focus on 2485, 2445, 2505 below, and 2525, 2560, 2590 above.
The Ethereum channel shows divergence, leaning towards a converging trend, with a focus on the 2445-2550 range for oscillation. If it breaks through either side and touches the levels again, a rebound can be made in the direction followed.
More conservatively, consider entering long at 82200 or 81200, with the logic of anchoring against the center and the low point. However, whether you can enter depends on luck; it’s not my fault if you don’t have a base position. Ethereum remains predominantly long. Plan your stop-loss and replenishment range accordingly, as the market is highly volatile; control your position based on your plans.
I still lean towards being bullish because I see people I don’t like shorting, and I think they won’t succeed. That’s all.
Stay connected, and follow the new public account: New AIA Trading Diary.
免责声明:本文章仅代表作者个人观点,不代表本平台的立场和观点。本文章仅供信息分享,不构成对任何人的任何投资建议。用户与作者之间的任何争议,与本平台无关。如网页中刊载的文章或图片涉及侵权,请提供相关的权利证明和身份证明发送邮件到support@aicoin.com,本平台相关工作人员将会进行核查。