The Coin Must Meeting technical series will gradually update, helping everyone sort out the most practical trading strategies each issue, accurately identifying the best targets and entry points. Let's first return to today's market, following our usual practice, and review the current situation using the MACD zero axis method we discussed earlier to see the signal status.
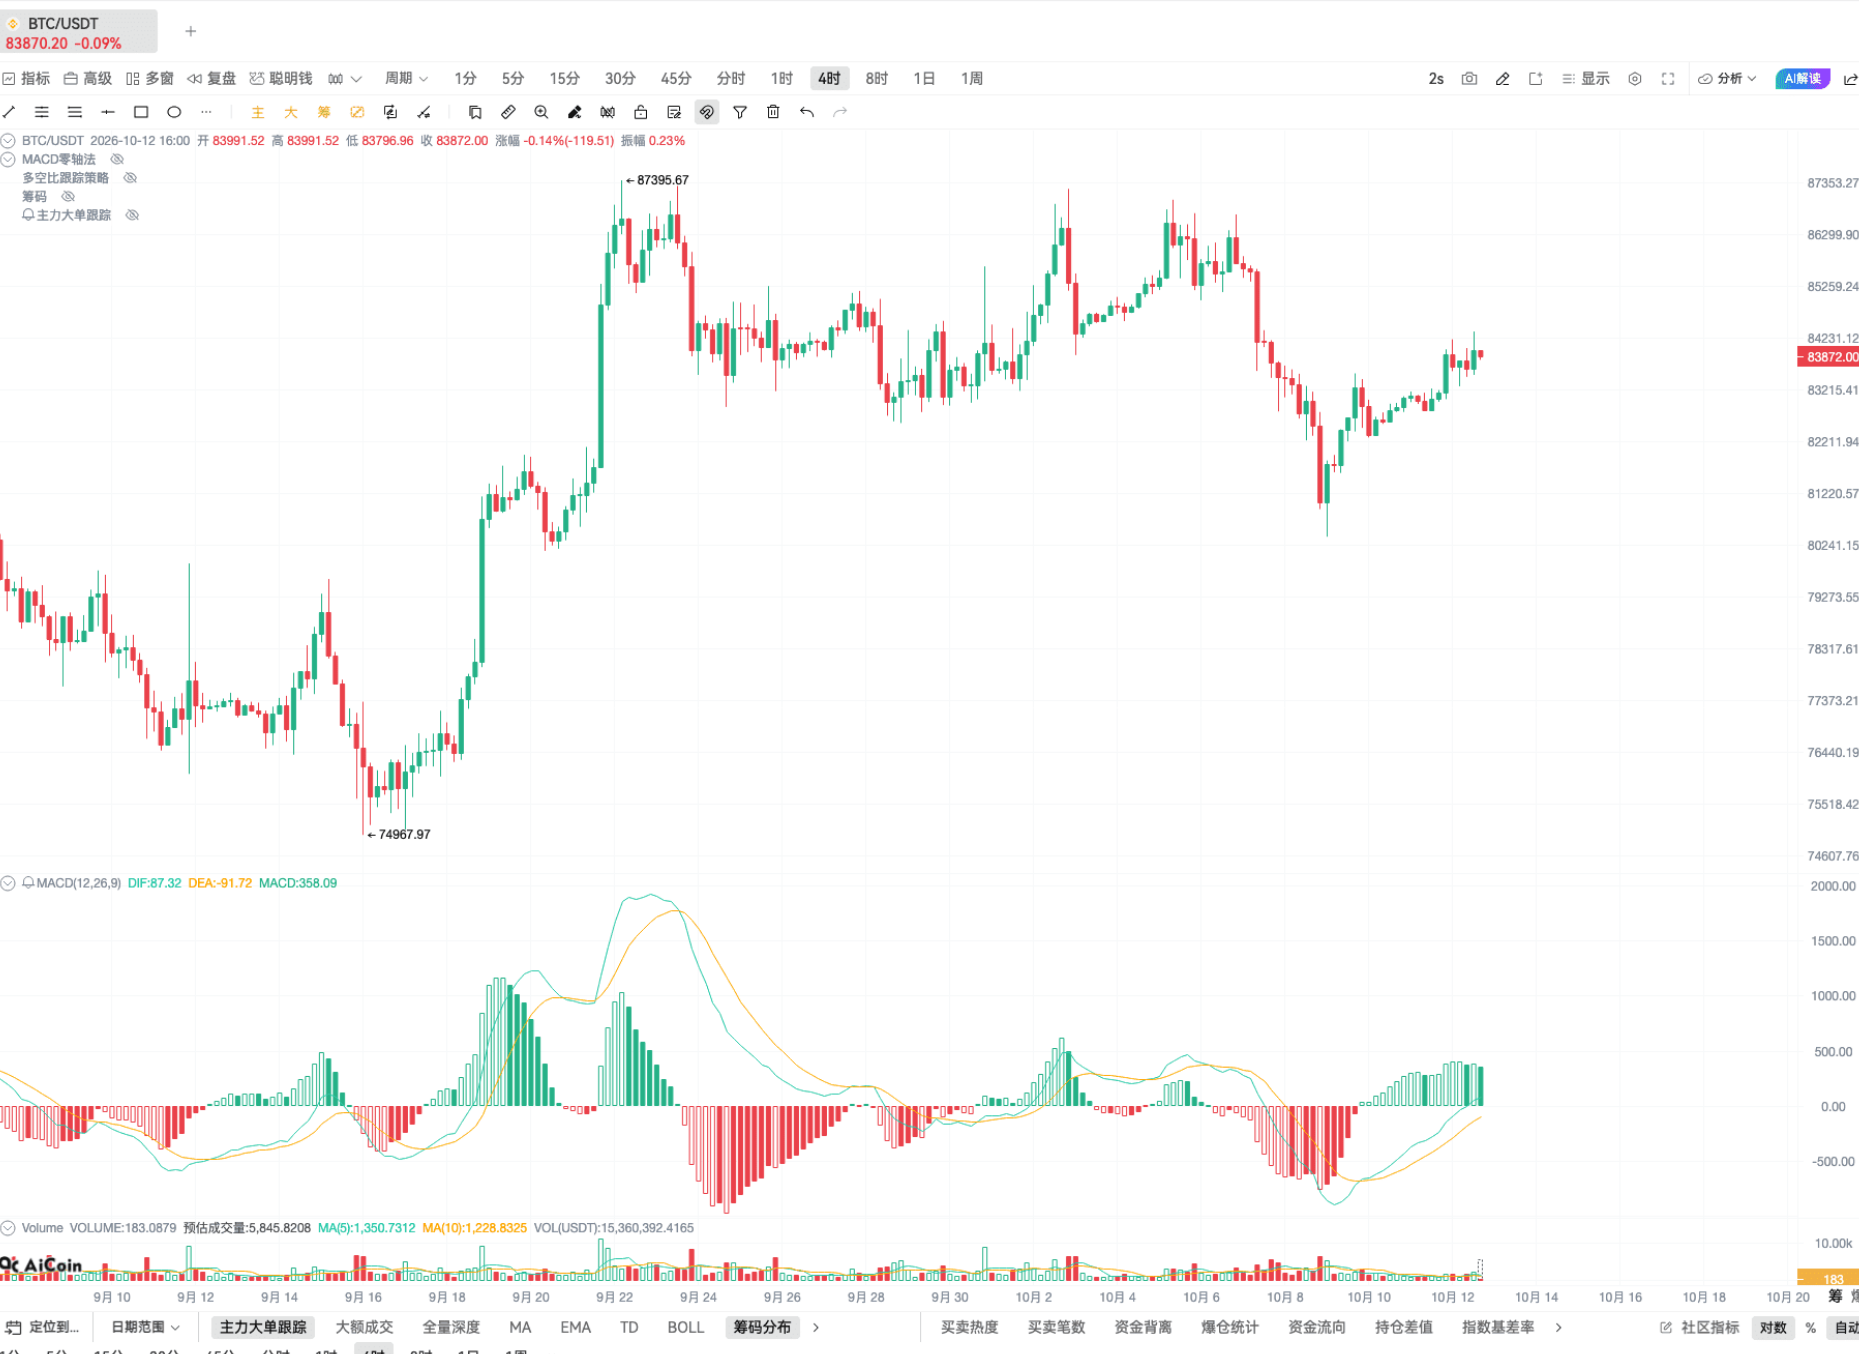
First, looking at the 4-hour cycle of Bitcoin, it has just started to break above the zero axis, and the position looks quite nice.
For the bulls, the signal support is in place. Additionally, looking at Fibonacci as a support line, this round of correction has solidly found support at the 50% position, which is considered a relatively healthy adjustment. Currently, this wave's break above the bull signal is originating slightly above 0.382, which is regarded as a moderately high-quality signal. Therefore, based on the indicators alone, the probability of Bitcoin being bullish in the medium term is greater.
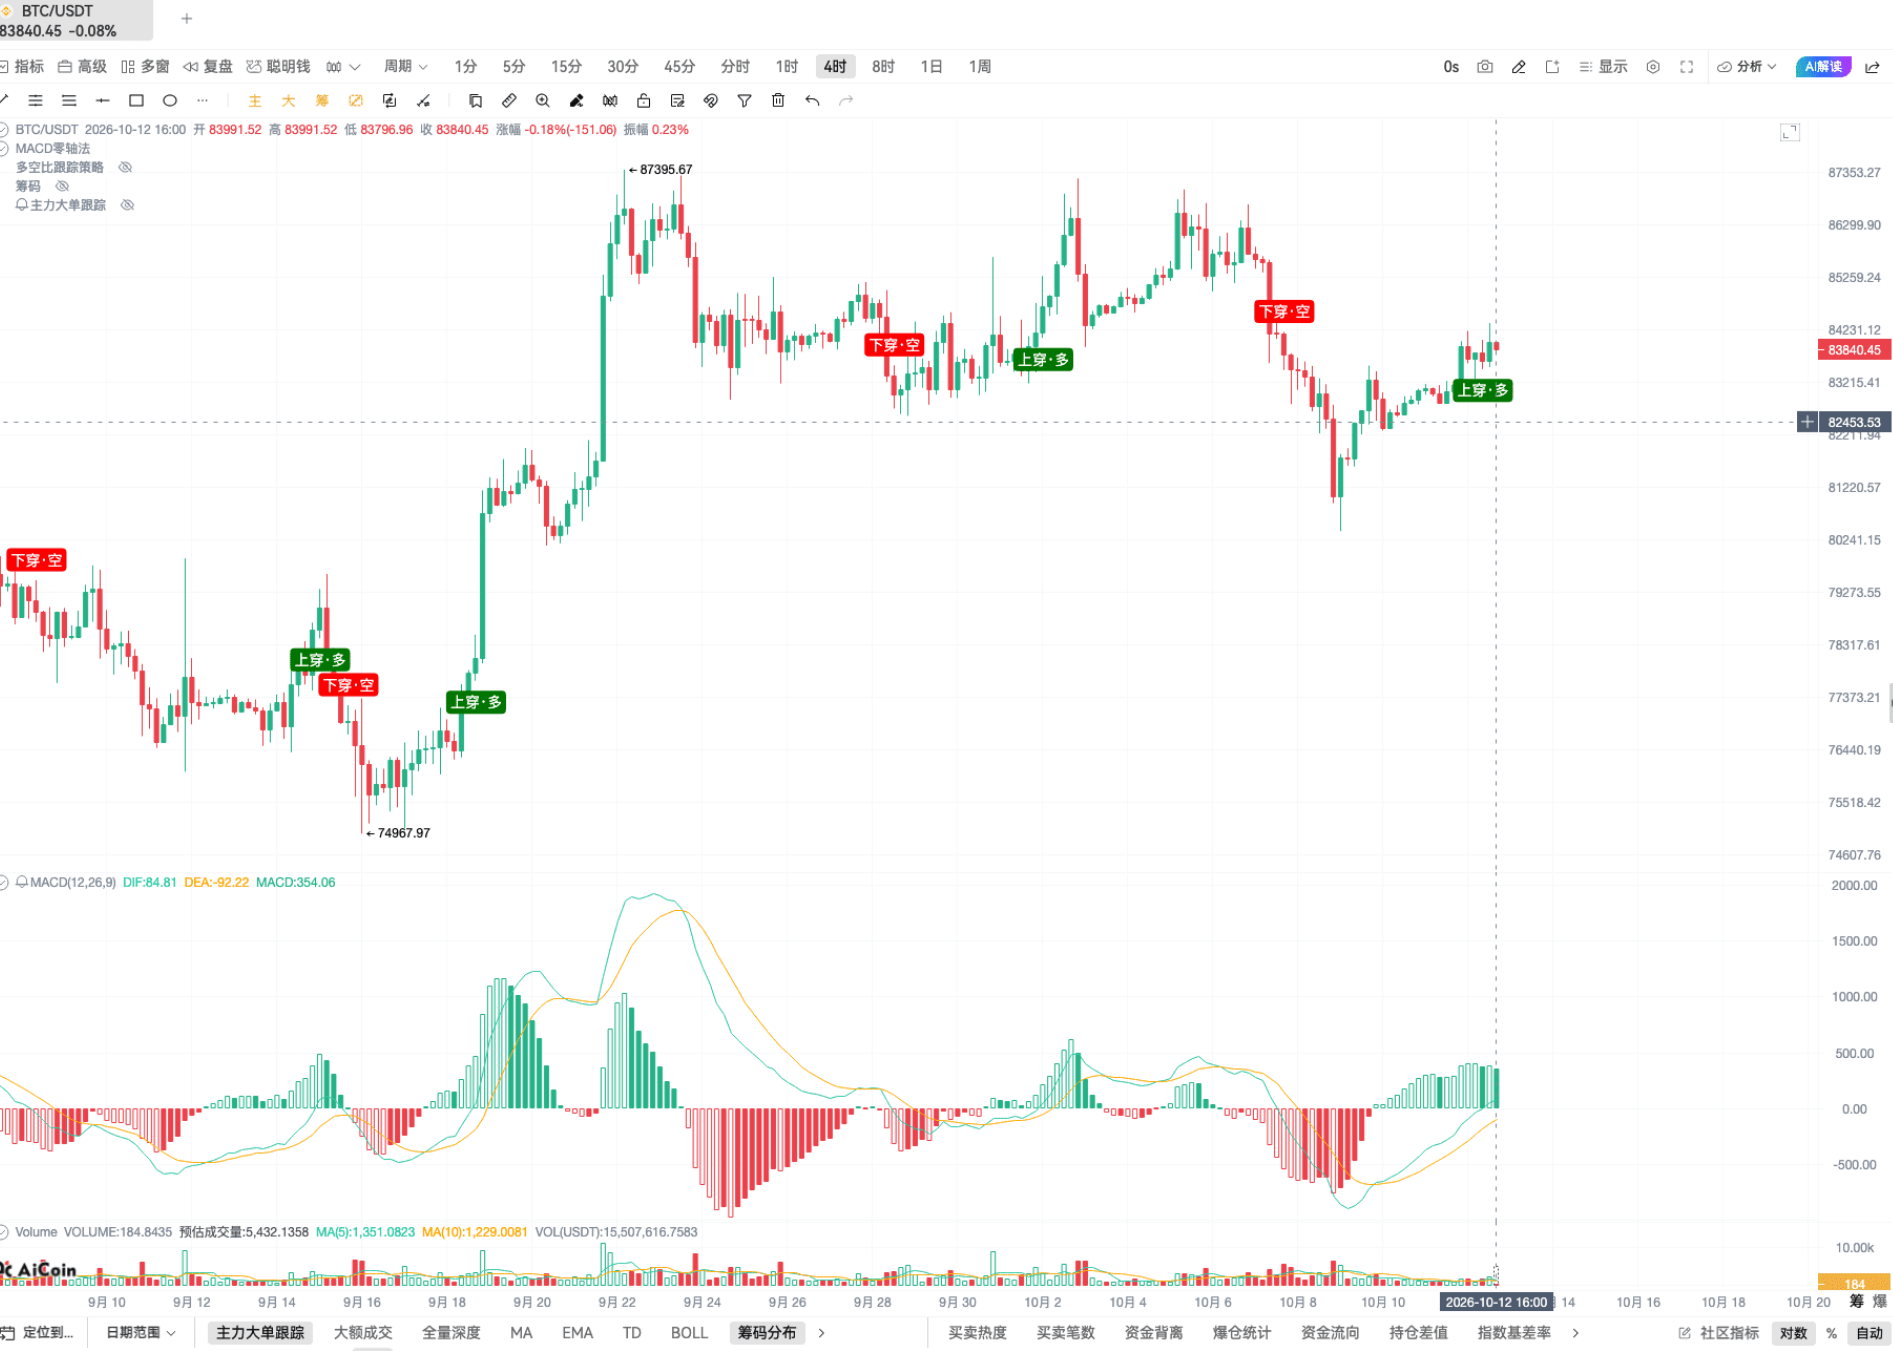
Next, looking at ETH, it has not yet managed to break above.
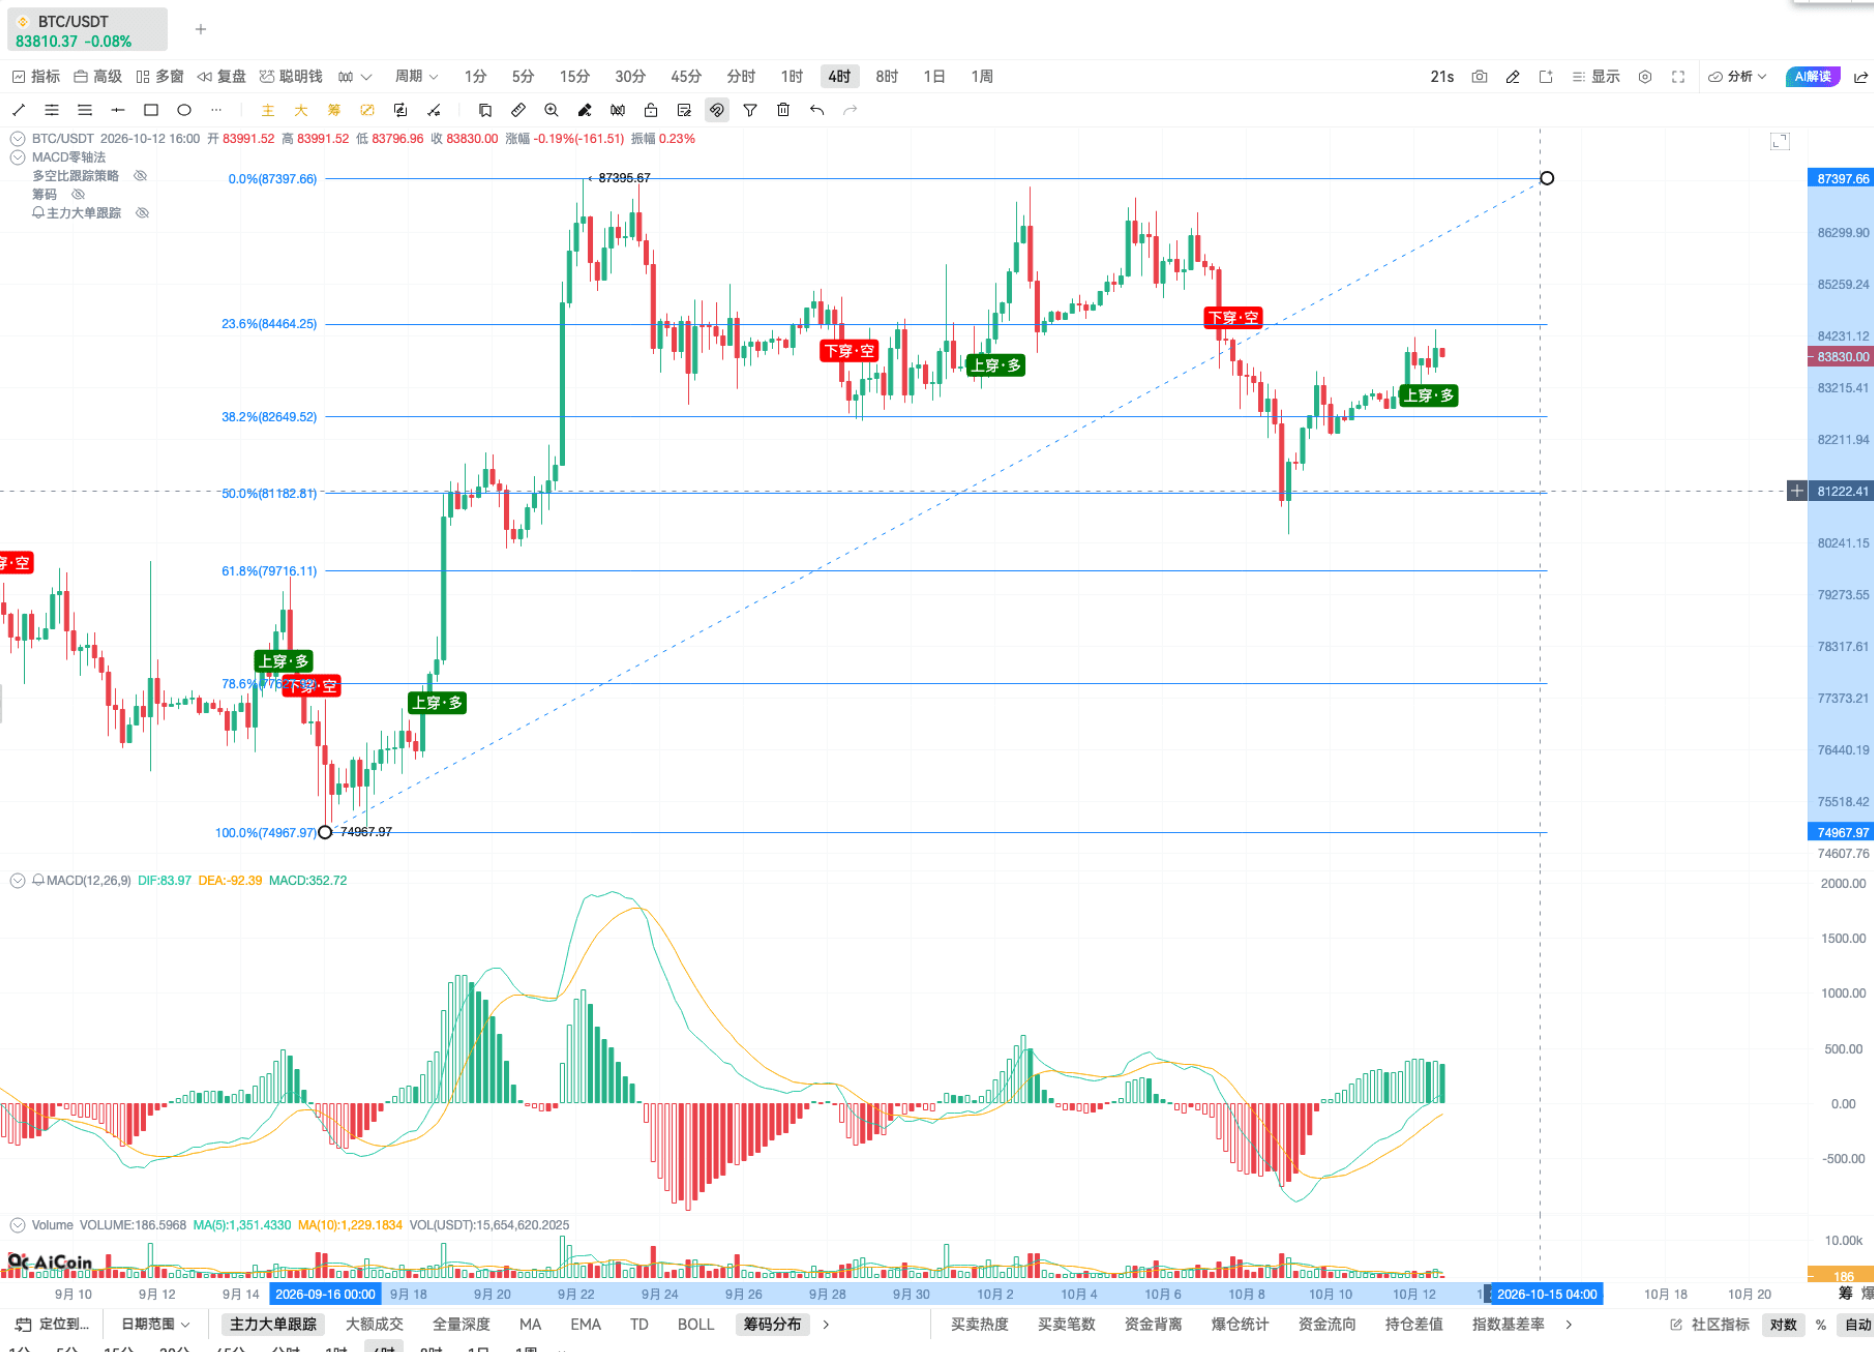
Therefore, based solely on the effectiveness of the MACD zero axis method, Bitcoin currently holds a higher cost-performance ratio than ETH. This set of indicators is effective for identifying trend turning points and has consistently performed well, with high historical backtesting returns. We won’t elaborate further, and let’s get straight to today’s theme — Long-Short Ratio Trading Method.
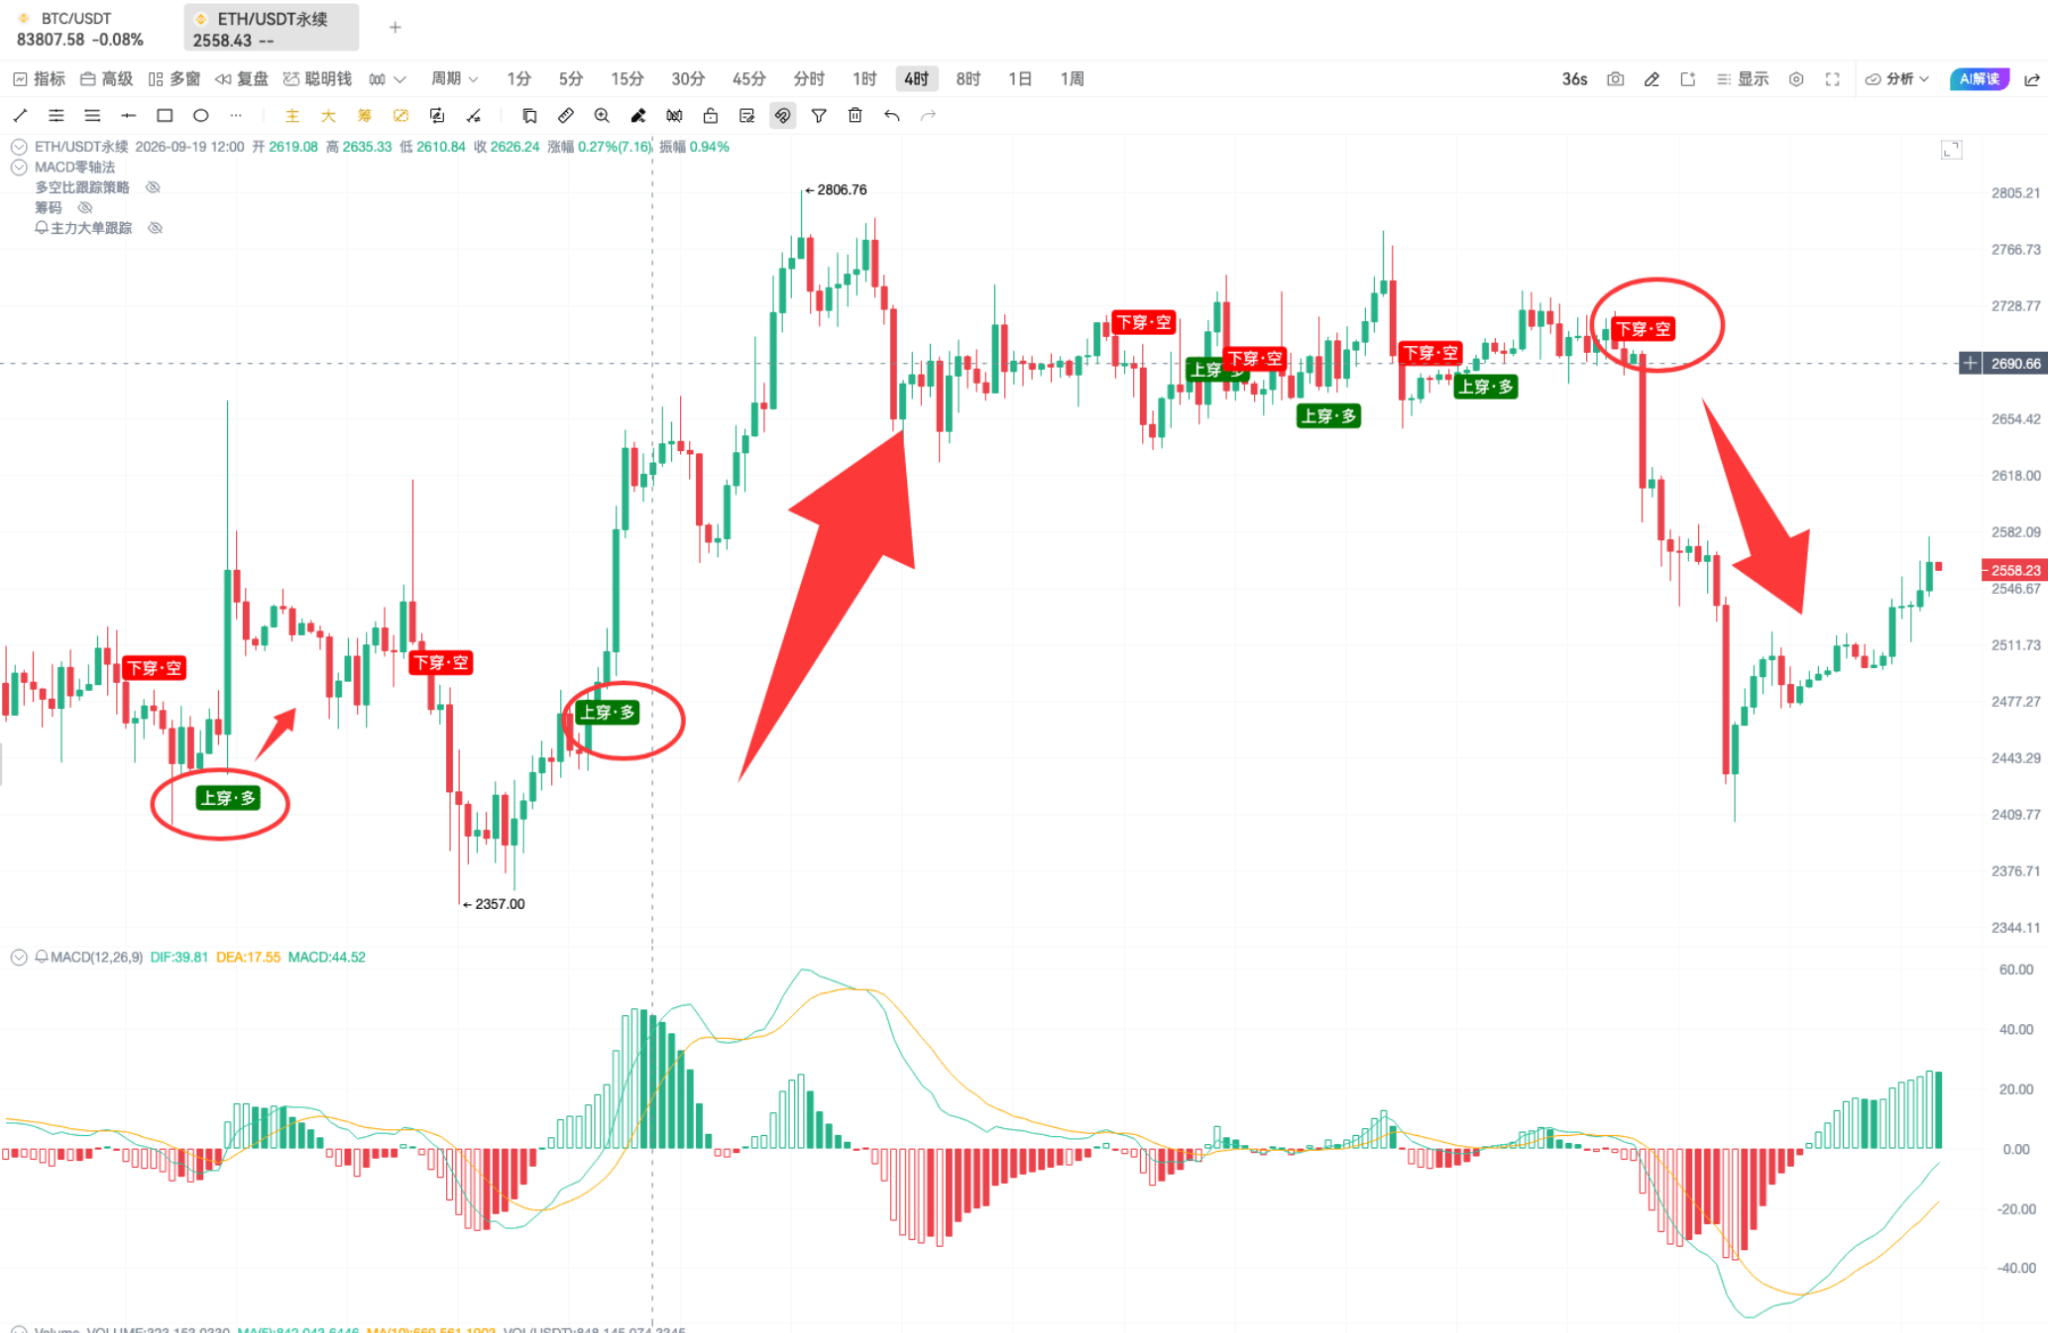
Old players should remember that a few years ago, the long-short ratio was a core indicator that must be mastered. In order to really make big money in the market, one basically had to fully understand it. Even now, it remains effective and is a very important emotional reference indicator. First, let me show you the complete set of strategies I’ve written, directly loaded onto the K-line effect, starting with the performance on ETH.
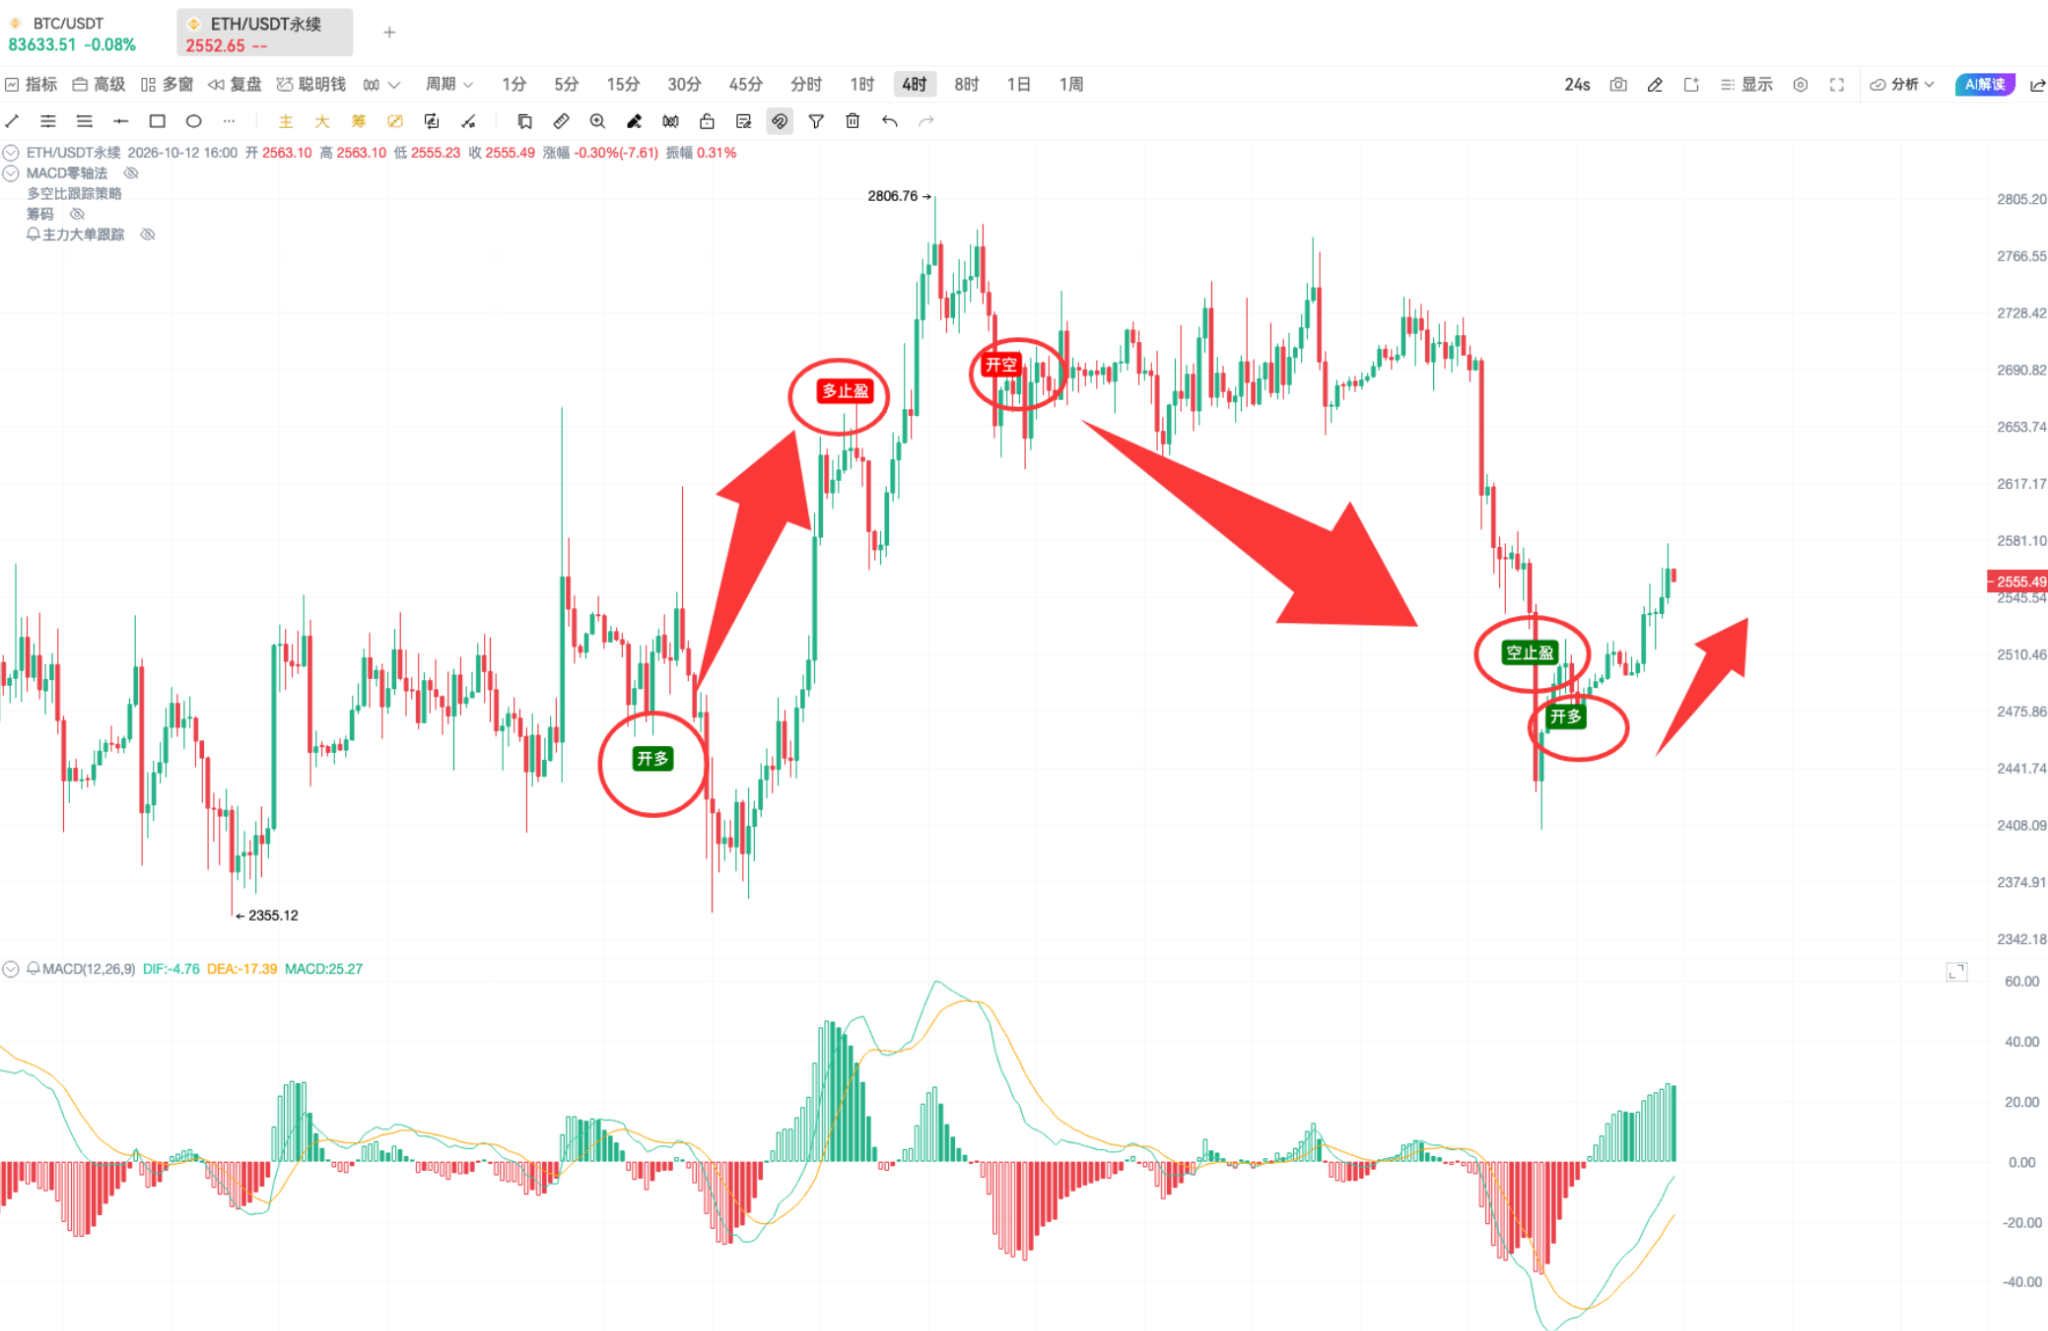
All three signals captured significant market movements, and the results are still outstanding. By the way, expect that our research institute’s next series will cover US stock investments, disassembling from perspectives of fundamentals, financial reports, capital markets, and technical analysis each issue, providing a comprehensive view of US stocks. Friends who want to truly build an investment system can keep following us.
Returning to the long-short ratio strategy, let’s first look at its performance on BTC, which is equally excellent.
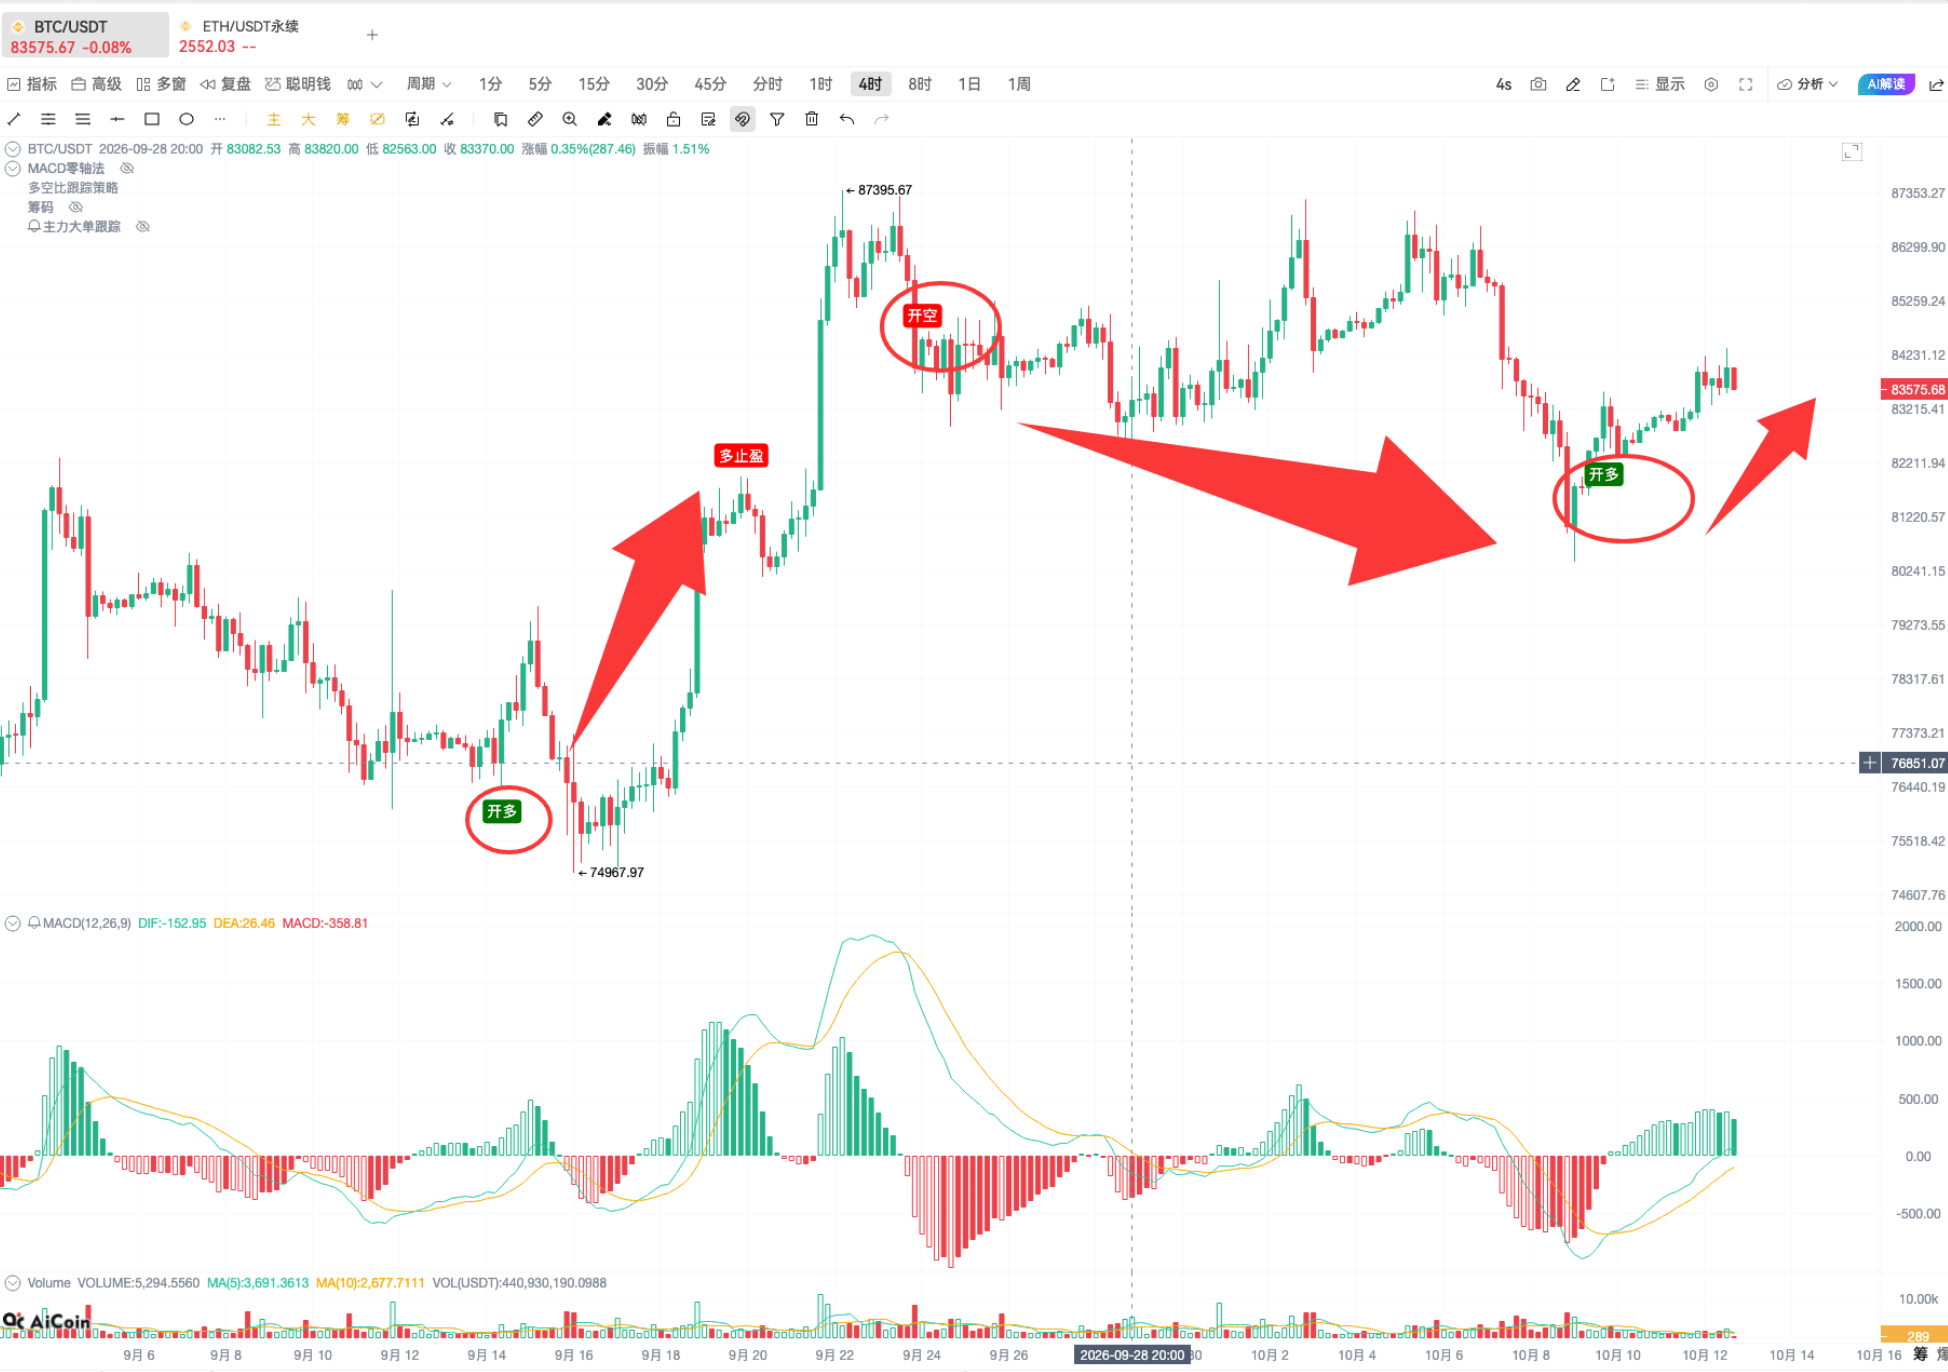
What is the underlying logic of this set of indicators? Let’s break it down step by step.
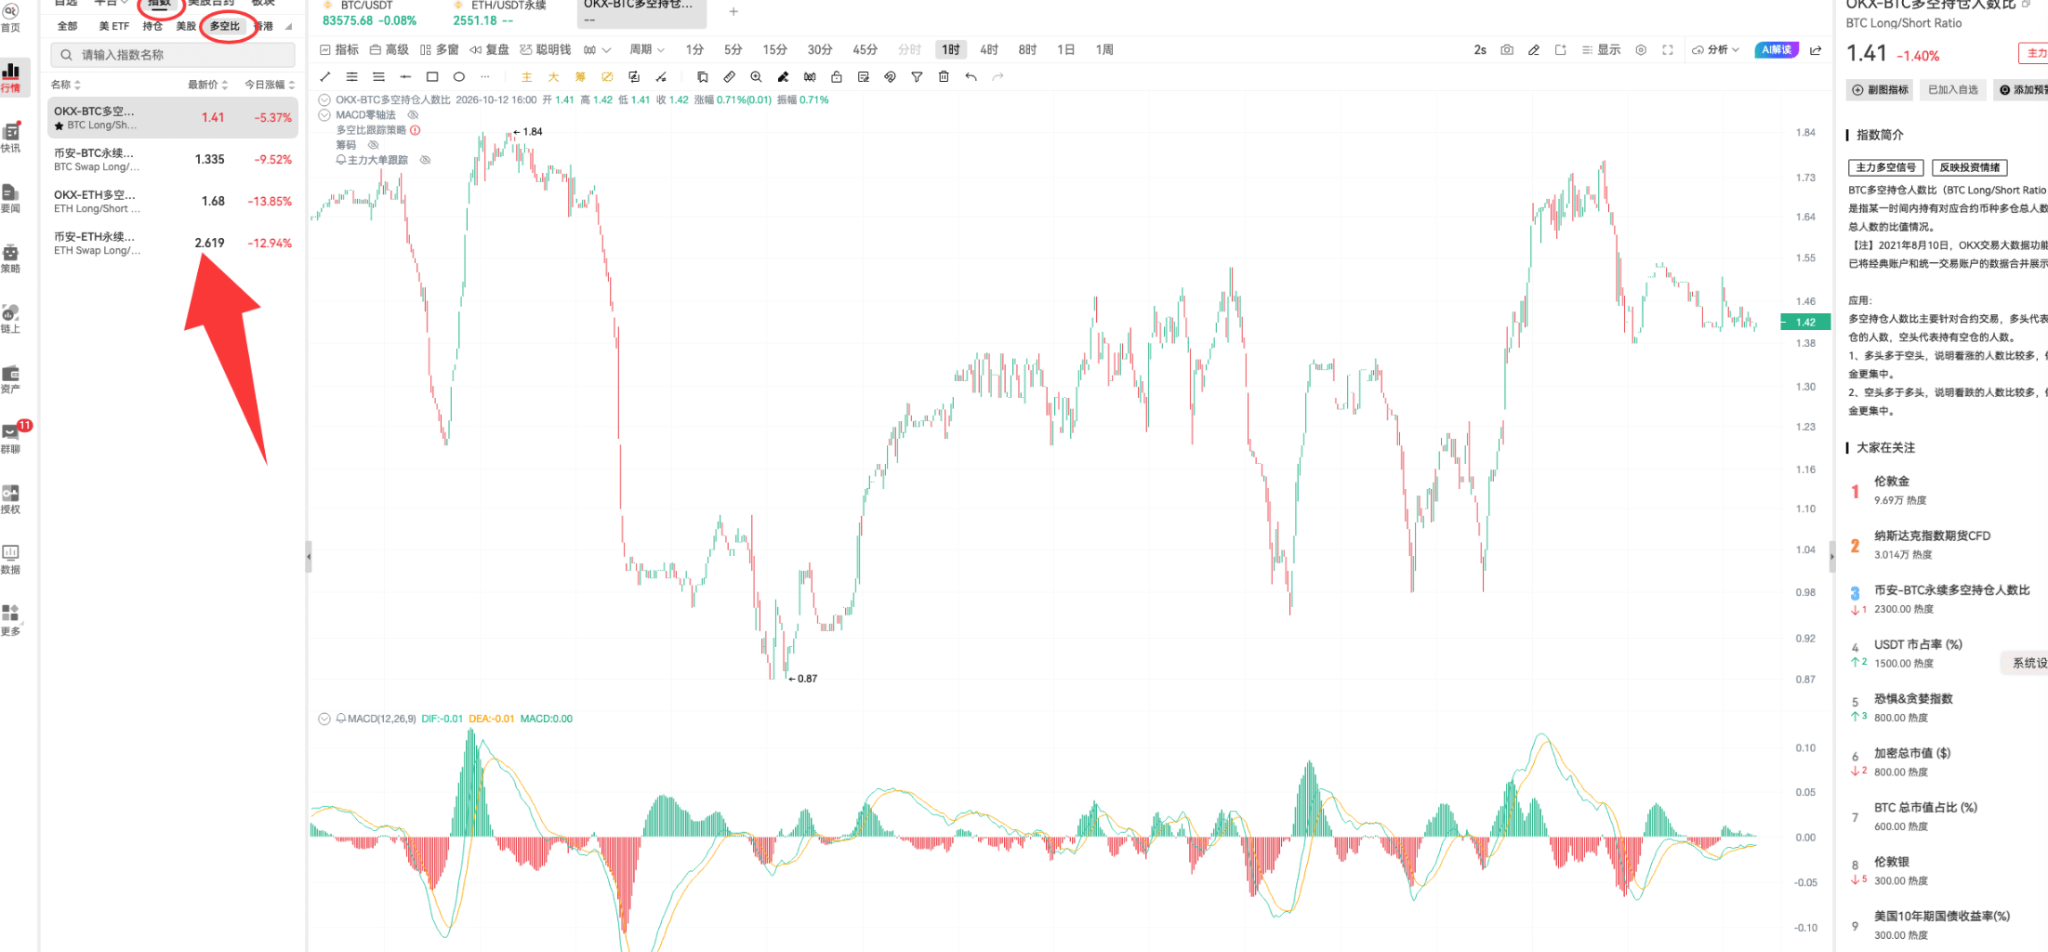
The long-short position participant ratio essentially measures the distribution of market participants' emotional state. Many people are unaware that the mechanism of the futures market dictates that the total position value of longs and shorts is always equal. Therefore, the real long-short advantage never manifests in position size, but in the comparison of the number of participants.
Don't worry about remembering complex details; just keep in mind the core conclusion: The main force always goes against the retail investors, so the main force is hidden in the side with fewer positions. The ratio can be easily viewed as: long position participants ÷ short position participants
- If the ratio is greater than 1, it indicates that there are more retail investors going long, and the main force hides on the short side.
- If the ratio is less than 1, it indicates that there are more retail investors going short, and the main force hides on the long side.
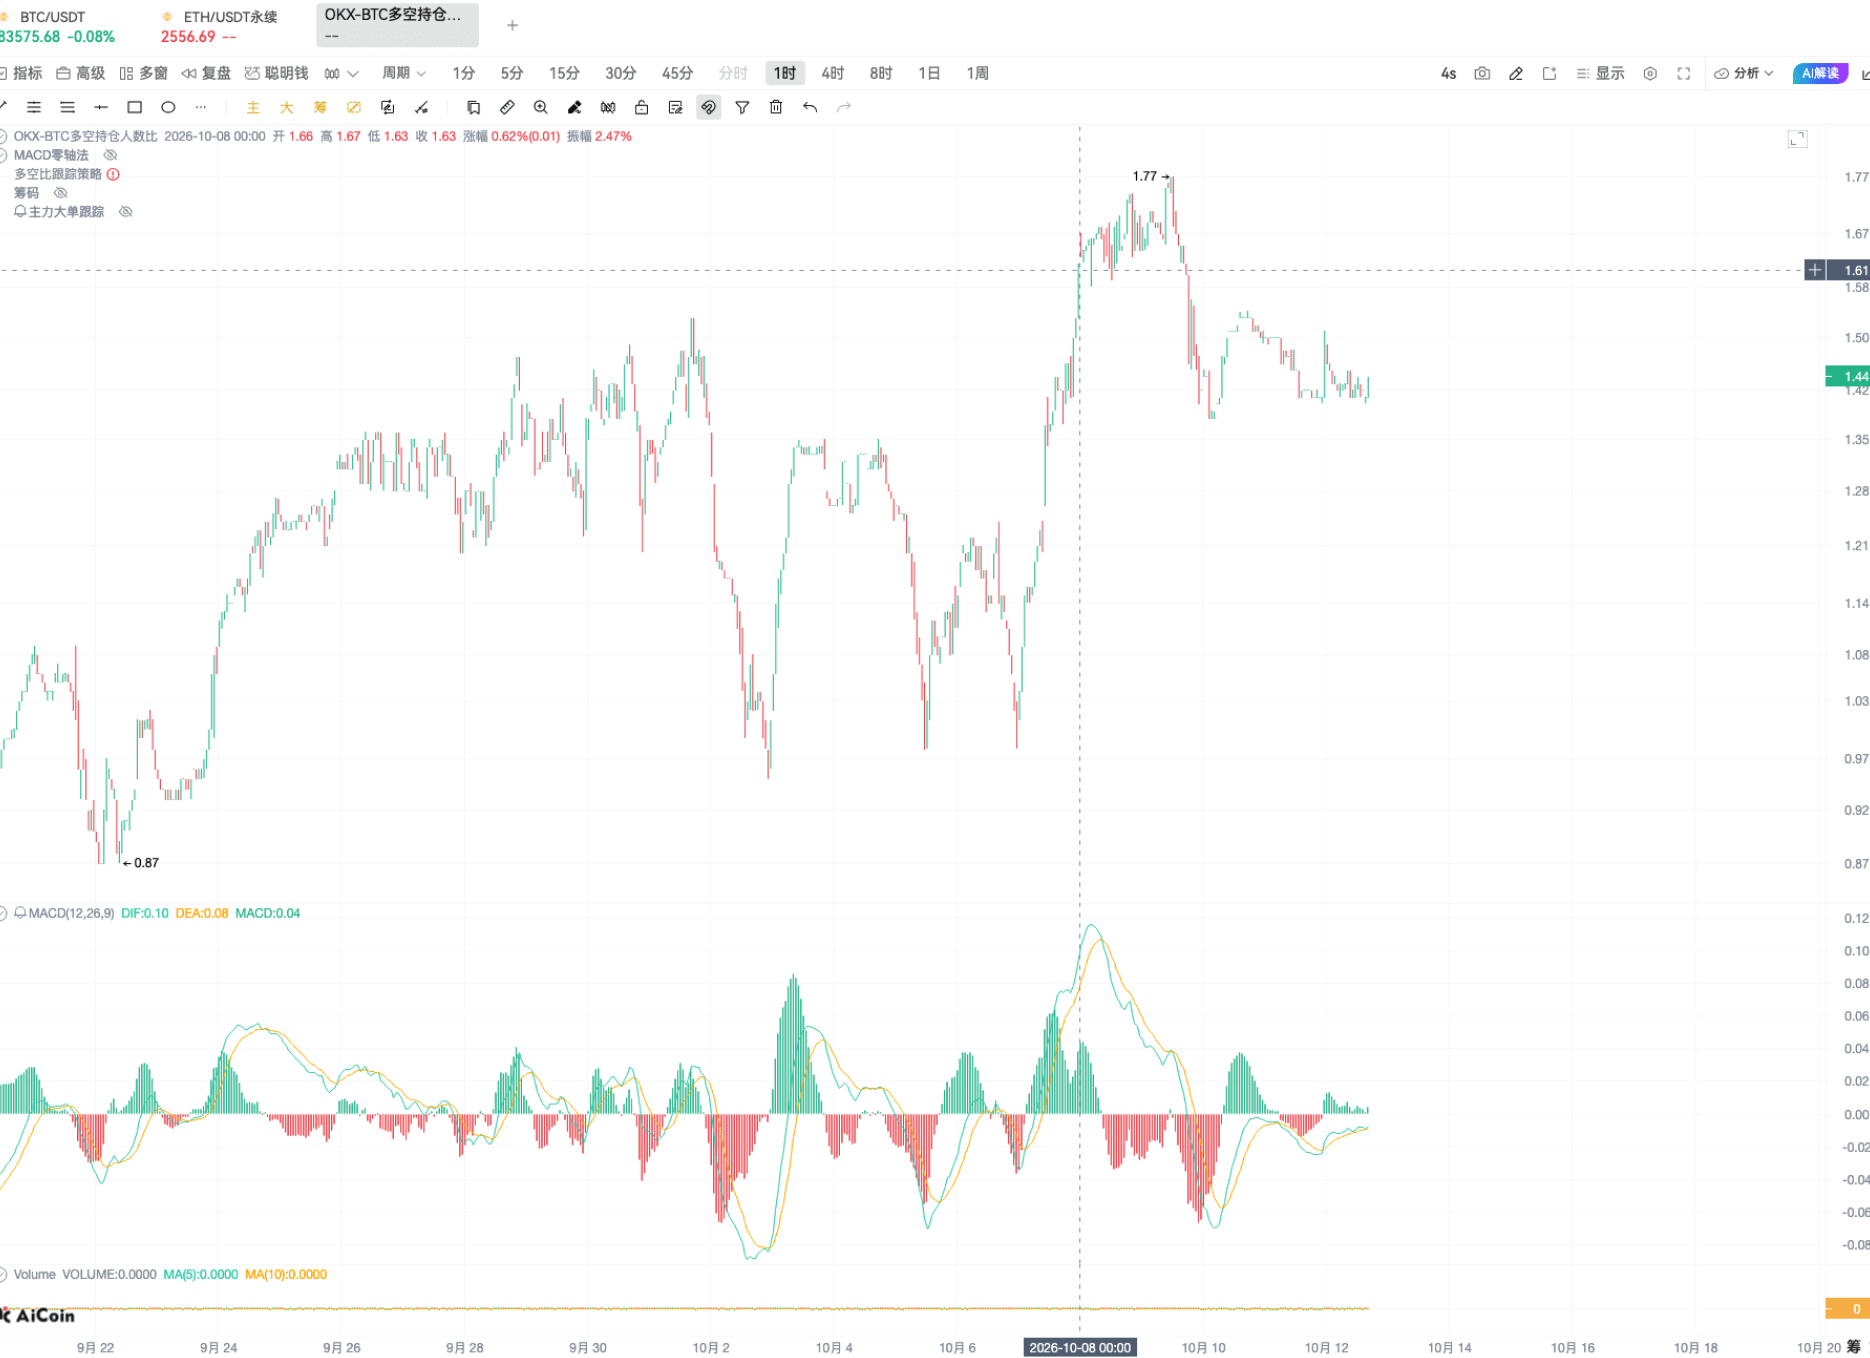
The long-short ratio and the market are usually inversely correlated: when the market is falling, the long-short ratio continues to rise; when the market is rising, the long-short ratio tends to drop. When this divergence occurs, it often indicates that the current market direction will continue. According to our backtesting, it is sufficient to focus on two key values. The first threshold: 1.6. When the long-short ratio breaks above 1.6, it indicates that market sentiment is overwhelmingly bearish, and the overall probability of downward pressure increases. The second threshold: 1.08. When the long-short ratio falls below 1.08, it suggests that the main force is gradually returning to bullish funding, warming sentiment, and increasing the overall probability of an upward trend.
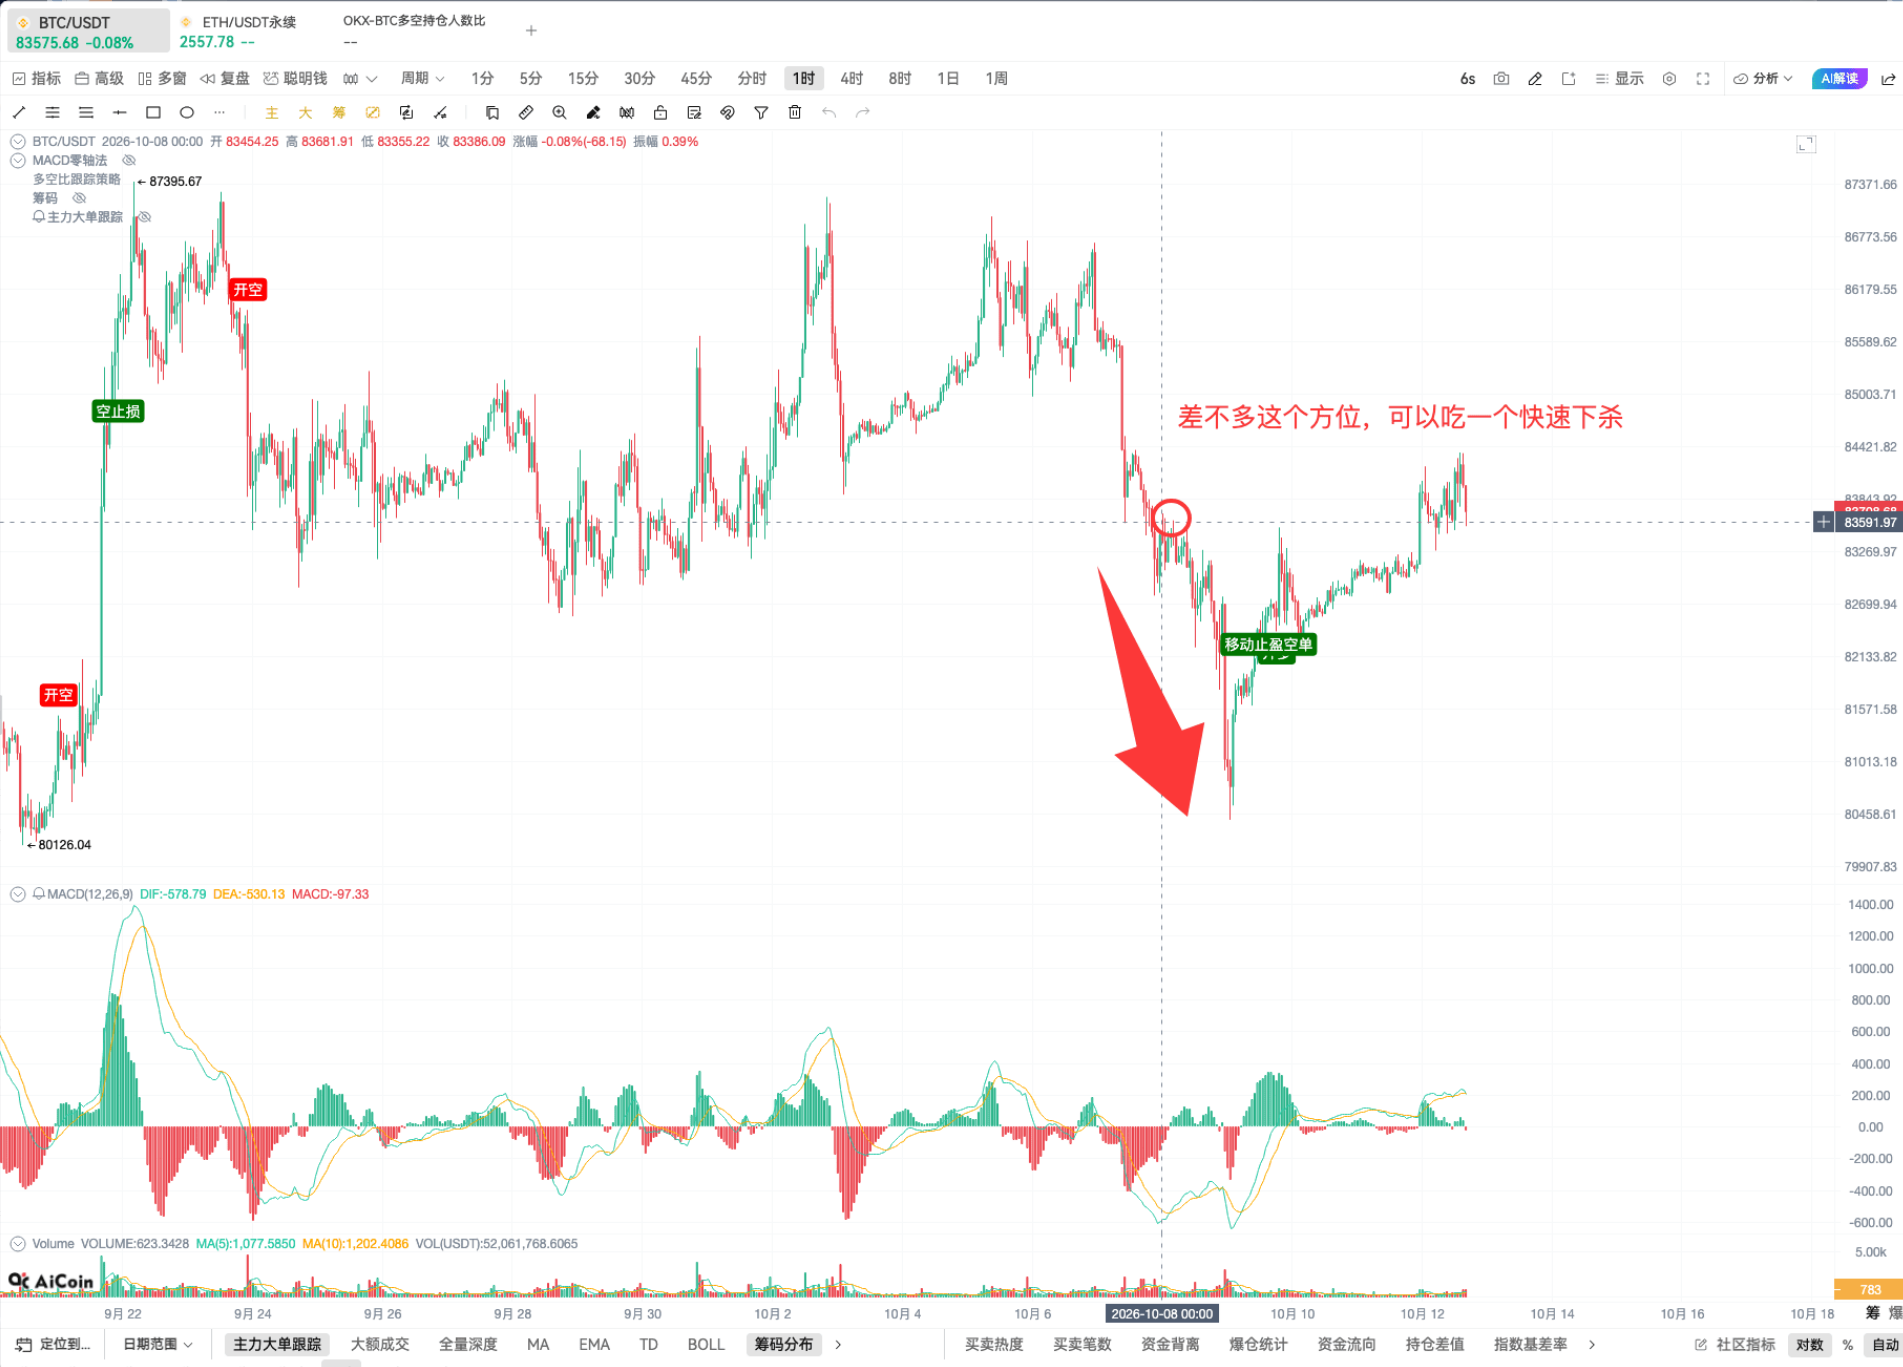
Of course, these values are not fixed and will fluctuate slightly with time and market conditions. After all, the market is like this, with new participants constantly entering and others leaving, each thinking the other is counter-trading 😂. Let me show you the most recent instance when the long-short ratio exceeded 1.6, which was at midnight on October 8th; everyone probably remembers what happened afterward.
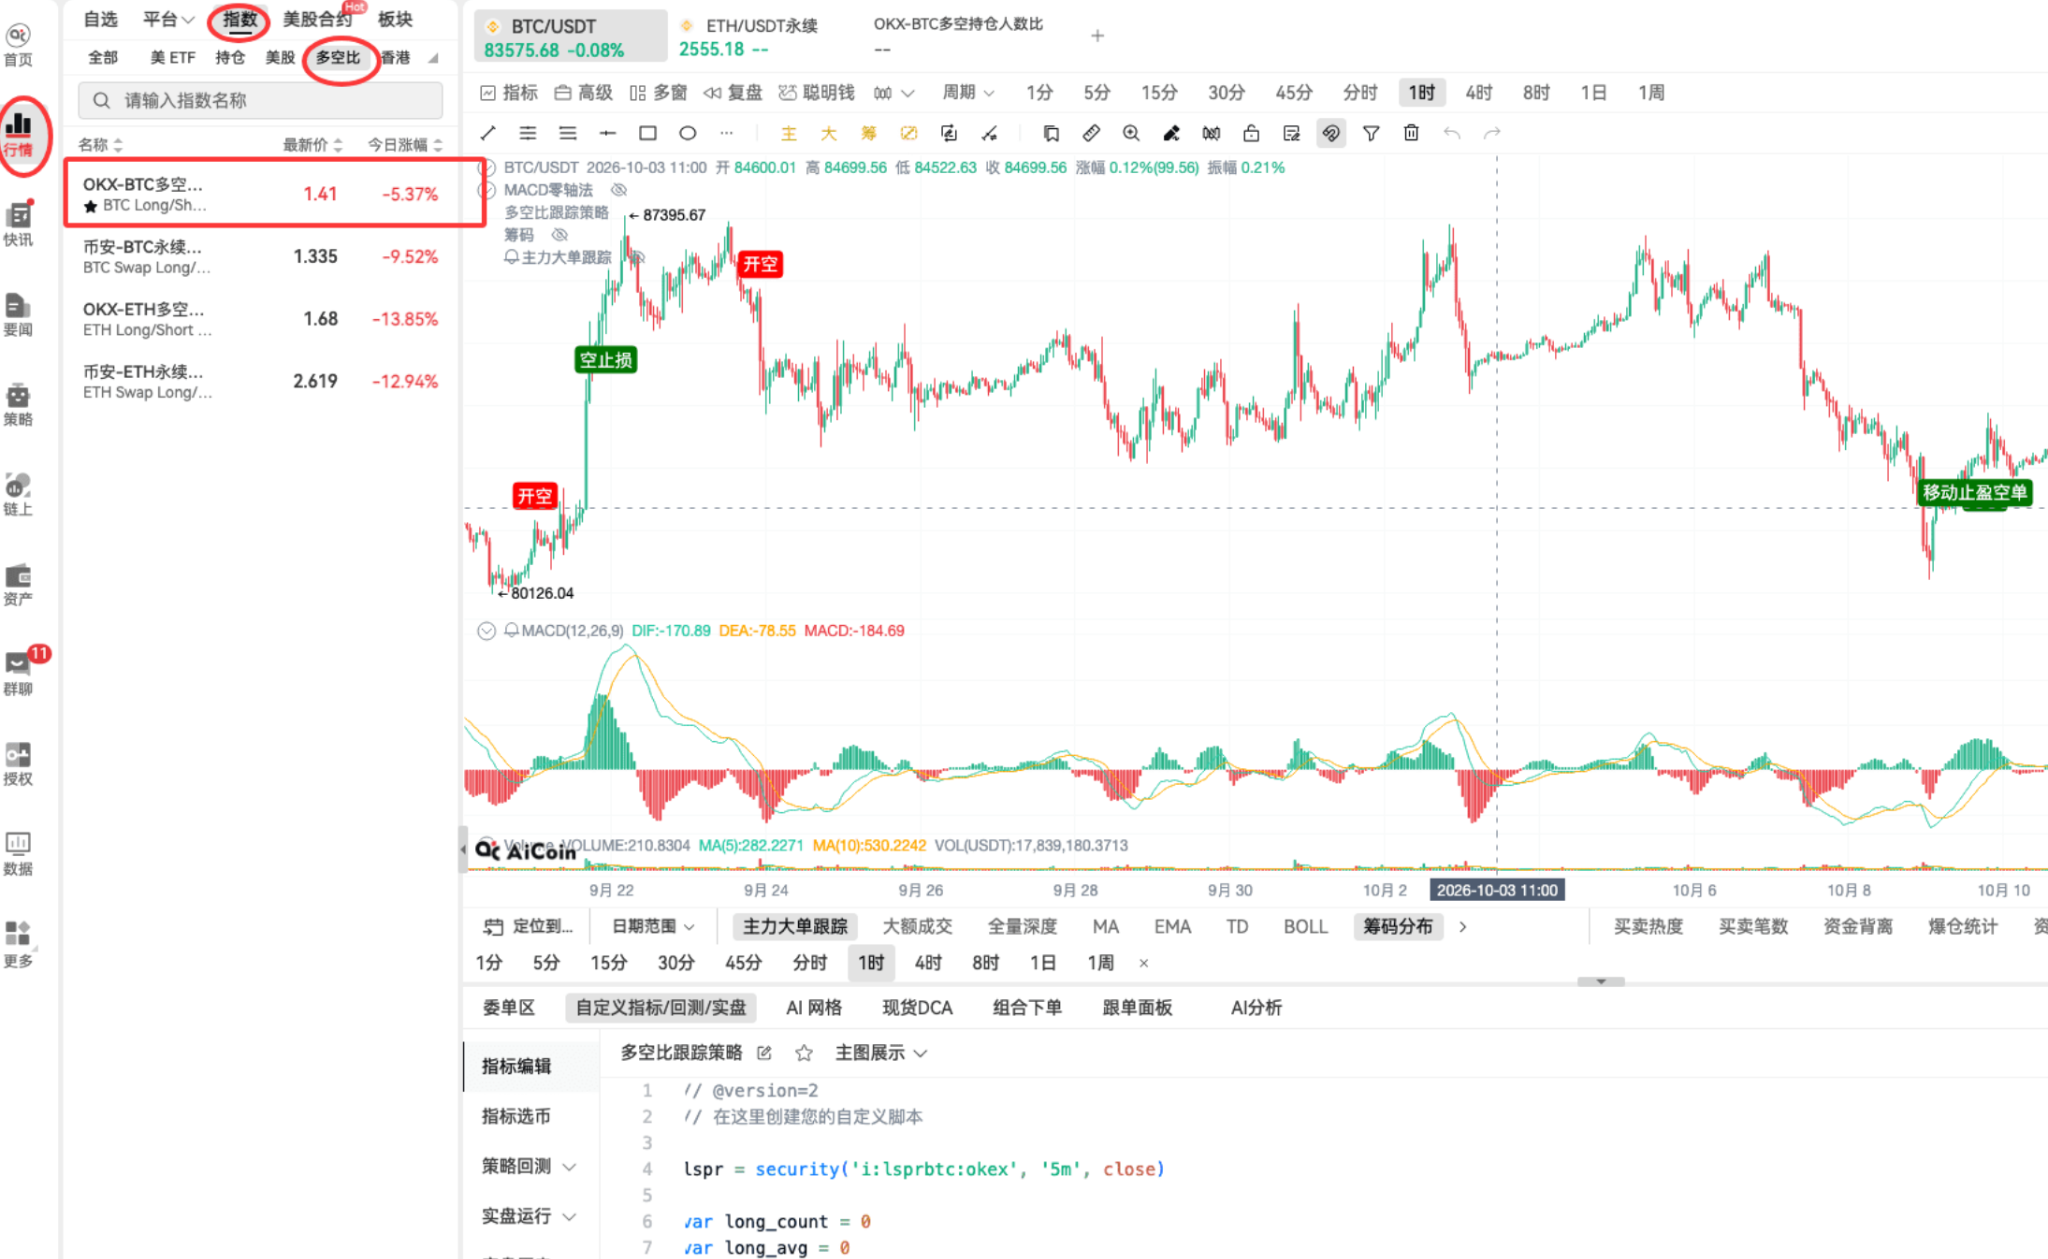
Below is the complete strategy code that you can use directly if you want to import it yourself.
// @version=2
// Create your custom script here
lspr = security('i:lsprbtc:okex', '5m', close)
var long_count = 0
var long_avg = 0
var long_max_profit = 0
var active_long_profit_monitor = false
var active_long_drawdown_order = false
var short_count = 0
var short_avg = 0
var short_max_profit = 0
var active_short_profit_monitor = false
var active_short_drawdown_order = false
var frozen_interval = 60 * 60
var finish_time = 0
// max_lspr = highest(lspr, 500);
// min_lspr = lowest(lspr, 500);
// lspr_ratio = (lspr - min_lspr)/(max_lspr - min_lspr)
lspr_ratio = lspr
lc = 1.6
sc = 1.08
take_profit = 0.05
stop_loss = 0.05
long = crossdown(lspr, lc) and long_count == 0 and time - finish_time > frozen_interval
short = crossup(lspr, sc) and short_count == 0 and time - finish_time > frozen_interval
long_take_profit_order = close/long_avg - 1 > take_profit and long_count == 1
long_stop_loss_order = close/long_avg - 1 < -1 * stop_loss and long_count == 1
short_take_profit_order = short_avg/close - 1 > take_profit and short_count == 1
short_stop_loss_order = short_avg/close - 1 < -1 * stop_loss and short_count == 1
exitLong(short, price='market', amount=1000)
exitShort(long, price='market', amount=1000)
enterLong(long, price='market', amount=1000)
enterShort(short, price='market', amount=1000)
alertcondition(long, title='Go Long', direction='buy');
alertcondition(short, title='Go Short', direction='sell');
plotText(long, title='long', text = 'Open Long', refSeries = low, bgColor='green', color='white', fontSize=14, placement='bottom' ,display=true);
plotText(short, title='short', text = 'Open Short', refSeries = high, bgColor='red', color='white', fontSize=14, placement='top' ,display=true);
exitLongPercent(long_take_profit_order or long_stop_loss_order, id = 'cond4', price='market', percent=100)
exitShortPercent(short_take_profit_order or short_stop_loss_order, id = 'cond8', price='market', percent=100)
plotText(long_take_profit_order, title='long_take_profit_order', text = 'Long Take Profit', refSeries = high, bgColor='red', color='white', fontSize=14, placement='top' ,display=true);
plotText(long_stop_loss_order, title='long_stop_loss_order', text = 'Long Stop Loss', refSeries = high, bgColor='red', color='white', fontSize=14, placement='top' ,display=true);
plotText(short_take_profit_order, title='short_take_profit_order', text = 'Short Take Profit', refSeries = low, bgColor='green', color='white', fontSize=14, placement='bottom' ,display=true);
plotText(short_stop_loss_order, title='short_stop_loss_order', text = 'Short Stop Loss', refSeries = low, bgColor='green', color='white', fontSize=14, placement='bottom' ,display=true);
long_signal = long // true or false Long Signal
short_signal = short // true or false Short Signal
active_trail = 0.03 // Activate trailing stop at 3% increase
drawdown = 0.5 // Close position at 50% drawdown from peak
if (long_signal and long_count == 0) {
long_count := 1
long_avg := close
active_long_profit_monitor := false
}
if (short_signal and short_count == 0) {
short_count := 1
short_avg := close
active_short_profit_monitor := false
}
if (short_signal or long_stop_loss_order or long_take_profit_order or active_long_drawdown_order) {
long_count := 0
finish_time := time
}
if (long_signal or short_stop_loss_order or short_take_profit_order or active_short_drawdown_order) {
short_count := 0
finish_time := time
}
if (long_count > 0) {
profit = (close - long_avg) / long_avg
if (profit > long_max_profit) {
long_max_profit := profit
}
if (profit > active_trail and long_max_profit > active_trail) {
active_long_profit_monitor := true
}
if (active_long_profit_monitor) {
back = profit / long_max_profit
if (back < drawdown) {
active_long_drawdown_order := true
}
}
} else {
active_long_drawdown_order := false
active_long_profit_monitor := false
long_max_profit := -99999999
long_avg := 0
}
if (short_count > 0) {
profit = (short_avg / close) - 1
if (profit > short_max_profit) {
short_max_profit := profit
}
if (profit > active_trail and short_max_profit > active_trail) {
active_short_profit_monitor := true
}
if (active_short_profit_monitor) {
back = profit / short_max_profit
if (back < drawdown) {
active_short_drawdown_order := true
}
}
} else {
active_short_drawdown_order := false
active_short_profit_monitor := false
short_max_profit := -99999999
short_avg := 0
}
exitLongPercent(active_long_drawdown_order, id = 'Long Take Profit', price='market', percent=100)
exitShortPercent(active_short_drawdown_order, id = 'Short Take Profit', price='market', percent=100)
plotText(active_long_drawdown_order, title='Trailing Stop Long Position', text = 'Trailing Stop Long Position', refSeries = high, bgColor='red', color='white', fontSize=14, placement='top' ,display=true);
plotText(active_short_drawdown_order, title='Trailing Stop Short Position', text = 'Trailing Stop Short Position', refSeries = low, bgColor='green', color='white', fontSize=14, placement='bottom' ,display=true);
Those who do not want to mess with custom indicators can simply remember the two threshold values I provided and add them to watchlist indicators:
👉 When the long-short ratio exceeds 1.6, progressively view it as bearish;
👉 When the long-short ratio falls below 1.08, progressively view it as bullish.
Just these two numbers can help you understand the general direction, avoiding buying at the highest point and selling at the lowest point. Many people are always kicking themselves in investments because they clearly saw the right direction but couldn't resist reckless operations, ultimately ending up with nothing.
Currently, there are live sessions every day, and you are welcome to continue following AiCoin friends! Reserve in advance 👇
https://www.aicoin.com/zh-Hans/live/list?tab=upcoming
Join our community, let’s discuss together and become stronger together!
Official Telegram community: https://t.me/aicoin_support
AiCoin Chinese Twitter: https://x.com/AiCoinzh
Aster Rebate: https://www.asterdex.com/zh-CN/referral/9C50e2
Hype Rebate: https://app.hyperliquid.xyz/join/AICOIN88
Binance Rebate: https://jump.do/zh-Hans/xlink-proxy?id=3 Invitation code: aicoin668
Coinbase Rebate: https://jump.do/xlink?checkProxy=true&proxyId=25 Invitation code: Y8L23JL
免责声明:本文章仅代表作者个人观点,不代表本平台的立场和观点。本文章仅供信息分享,不构成对任何人的任何投资建议。用户与作者之间的任何争议,与本平台无关。如网页中刊载的文章或图片涉及侵权,请提供相关的权利证明和身份证明发送邮件到support@aicoin.com,本平台相关工作人员将会进行核查。