Academician of the Cryptocurrency Circle: The First Significant Adjustment After the Doubling of Ethereum (ETH) on October 13
The current price of Ethereum is 2525, it was still at 2800 last week, now it has dropped to 2460 and is bouncing back to 2500? I write these analyses daily, not for you to follow my levels, but to hope that after reading, you can think clearly about why you open a position, what to do if you're wrong, and when to exit if you're right. Surviving in the futures market is more important than making quick money. I’ll just write this one article tonight and then go to sleep; if there are any changes tonight, I will update.
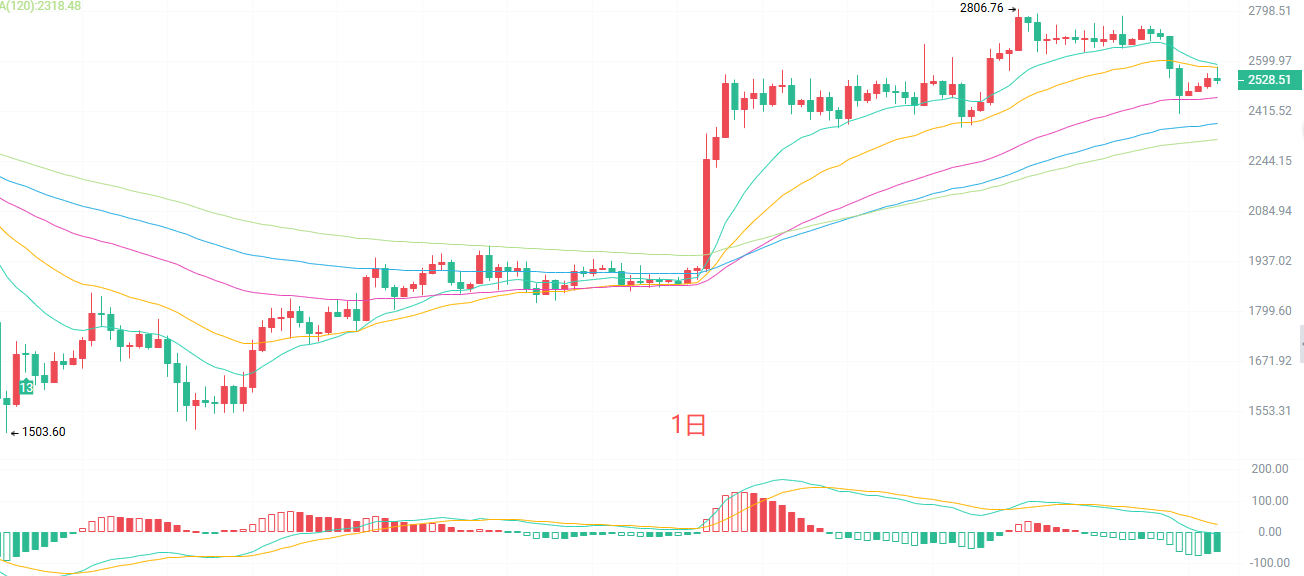
The daily K-line has fallen below the short-term moving averages EMA15 and EMA30, but is still above EMA60, EMA90, and EMA120, and the medium-term uptrend line has not been broken. In terms of MACD, the DIF has crossed below the DEA with green bars expanding, indicating that the short-term bullish momentum at the daily level is weakening. The middle track of the Bollinger Bands is 2639, the upper track is 2804, and the lower track is 2473. The current price is running between the middle and lower tracks, which is a consolidation after a strong pullback. There is indeed selling pressure at high levels.
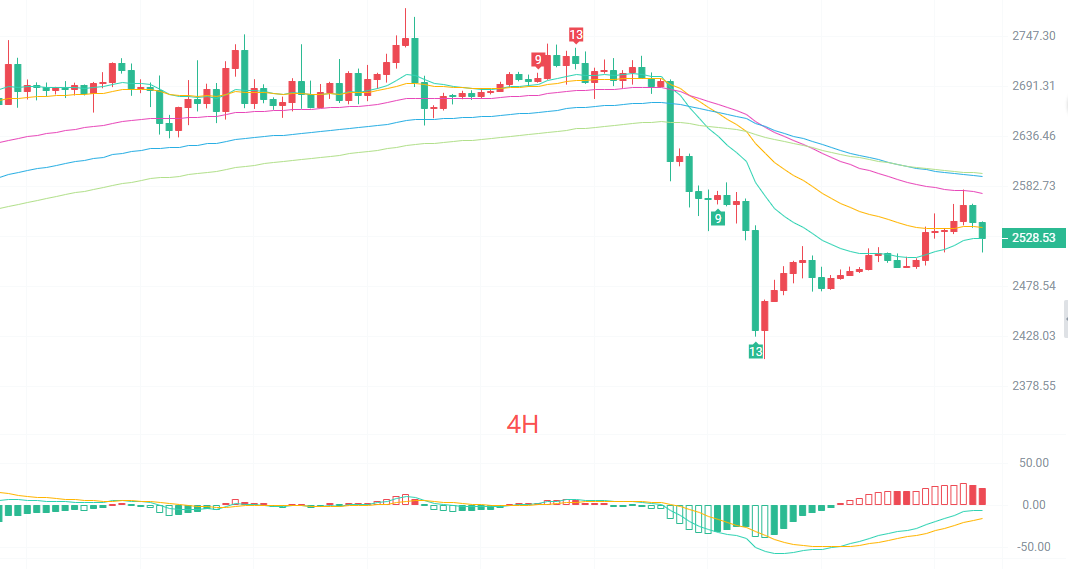
The four-hour K-line is just standing near EMA15 but is pressed below EMA30, EMA60, EMA90, and EMA120, indicating that the short-term moving averages are arranged in a bearish manner. However, the MACD has produced a golden cross, with the DIF crossing above the DEA, and the red bars are beginning to enlarge. This is a signal of a corrective rebound after a sharp decline. The middle track of the Bollinger Bands is 2512, the upper track is 2559, and the lower track is 2466. The price is currently slightly above the middle track. The overall movement from 2806 to 2355 and then back up is a process of building a bottom after a significant drop.
Short-term reference:
For upward movement, stop losses if it drops from 2510 to 2480 with a stop loss of 40 points, and the target looking at 2535 to 2580.
For downward movement, if it stagnates from 2570 to 2580, stop losses with 40 points, targeting 2520 to 2460.
Specific operations should be primarily based on real-time market data; for more details, you can consult the author. There may be a delay in the publication of the article, so it is advised for reference only, and risks are self-assumed.

Friendly reminder: The above content is solely created by the author of the public account, and the advertisements at the end of the article and in the comment area have no relation to the author. Please discern carefully, thank you for reading.
免责声明:本文章仅代表作者个人观点,不代表本平台的立场和观点。本文章仅供信息分享,不构成对任何人的任何投资建议。用户与作者之间的任何争议,与本平台无关。如网页中刊载的文章或图片涉及侵权,请提供相关的权利证明和身份证明发送邮件到support@aicoin.com,本平台相关工作人员将会进行核查。