Cryptocurrency Academy: On October 13, the Bitcoin (BTC) moving average bullish arrangement hasn’t worsened; only your impatient heart wanting to recover losses is bad.
The current price of Bitcoin is 82700. Some say it will drop to 70,000, while others say it will surge to 90,000. I never participate in discussions about betting on directions because until the K-line is complete, anyone’s call is just a guess. The truly professional approach is to lay out all the support, resistance, moving averages, and MACD, then ask yourself one question — if the price reaches here, what should I do? What to look for on the daily chart, what to watch on the 4-hour chart, where each side should enter, and where to place stop losses.
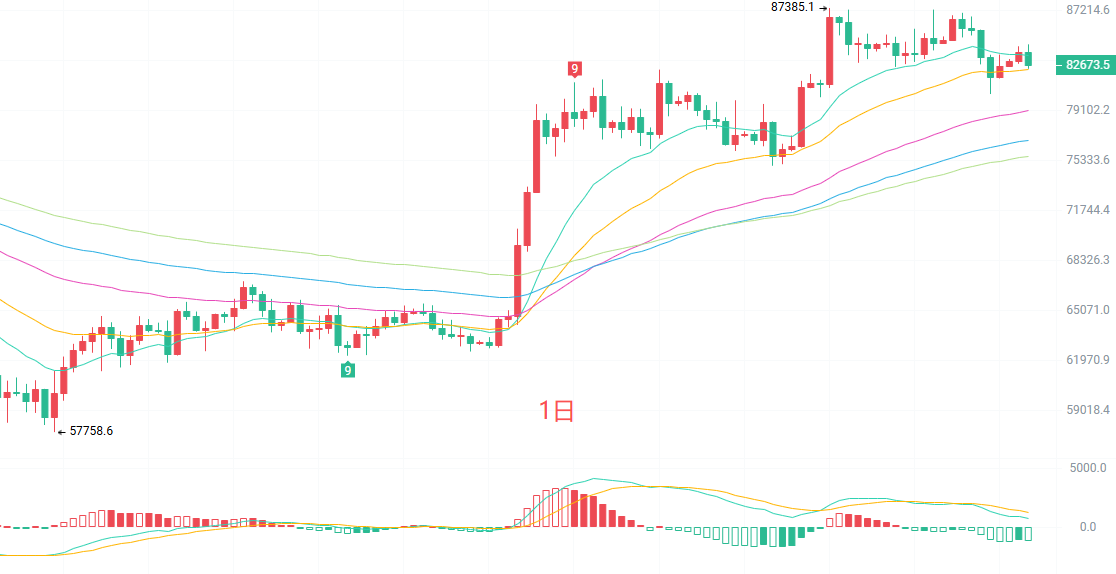
The daily K-line has already broken below EMA15 but is still firmly above EMA30, while EMA60 is still far below supporting it, indicating that the medium to long-term bullish structure hasn’t worsened. The green bars on the MACD side are still expanding, indicating that short-term momentum is indeed receding, which is a normal pullback after a significant rise. The upper band of BOLL is 86269, the middle band is 84046, and the lower band is 81822, with the price just between the middle and lower bands, indicating a normal correction within the channel.
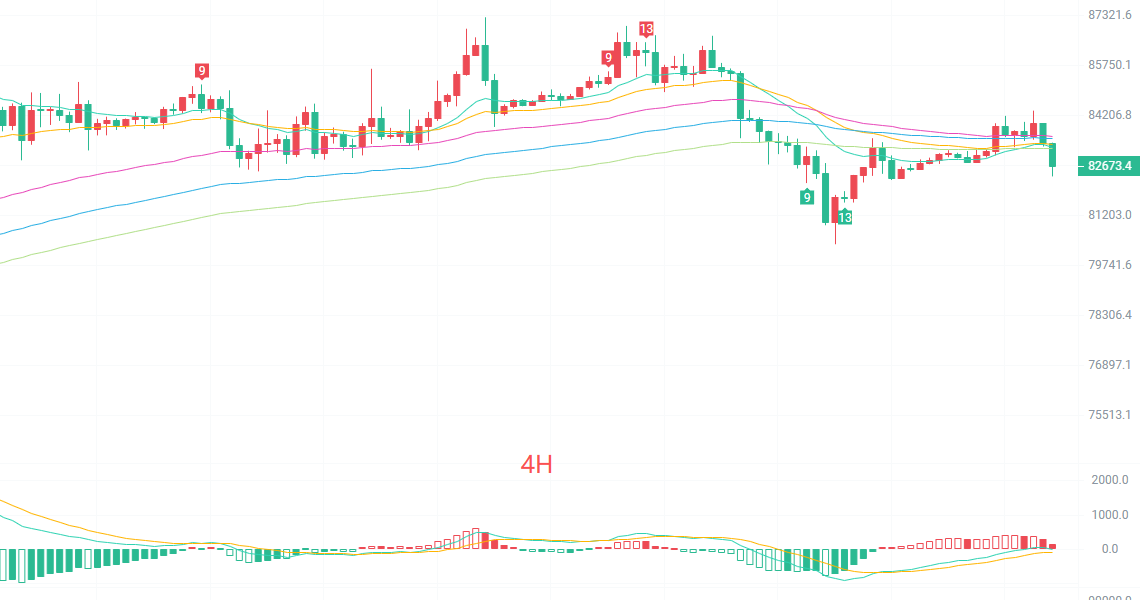
The four-hour K-line has broken below EMA15 and EMA30 and is currently retracing towards EMA60. The good news is that the lower band of BOLL at 82183 hasn’t been broken, with the price temporarily consolidating between the middle and lower bands. The MACD at the 4-hour level has started to see funds coming in at low levels, and the bearish momentum is not as fierce as it appears on the daily K-line. However, as long as the range of 82180-82300 is maintained, the 4-hour level will be a sideways consolidation, not a trend reversal.
Short-term reference
For a northern movement, buy between 82300 and 81800 with a stop loss of 500 points, targeting 83500 to 84300.
For a southern movement, sell between 83900 and 84400 with a stop loss of 500 points, targeting 83200 to 82300.
Specific operations should be based on real-time market data. For more information, you can consult the author. The article is published with a delay; recommendations are for reference only, and risks are undertaken by the individual.

Kind reminder: The above content is solely created by the author of the public account. The advertisements at the end of the article and in the comment area are unrelated to the author. Please distinguish carefully, thank you for reading.
免责声明:本文章仅代表作者个人观点,不代表本平台的立场和观点。本文章仅供信息分享,不构成对任何人的任何投资建议。用户与作者之间的任何争议,与本平台无关。如网页中刊载的文章或图片涉及侵权,请提供相关的权利证明和身份证明发送邮件到support@aicoin.com,本平台相关工作人员将会进行核查。