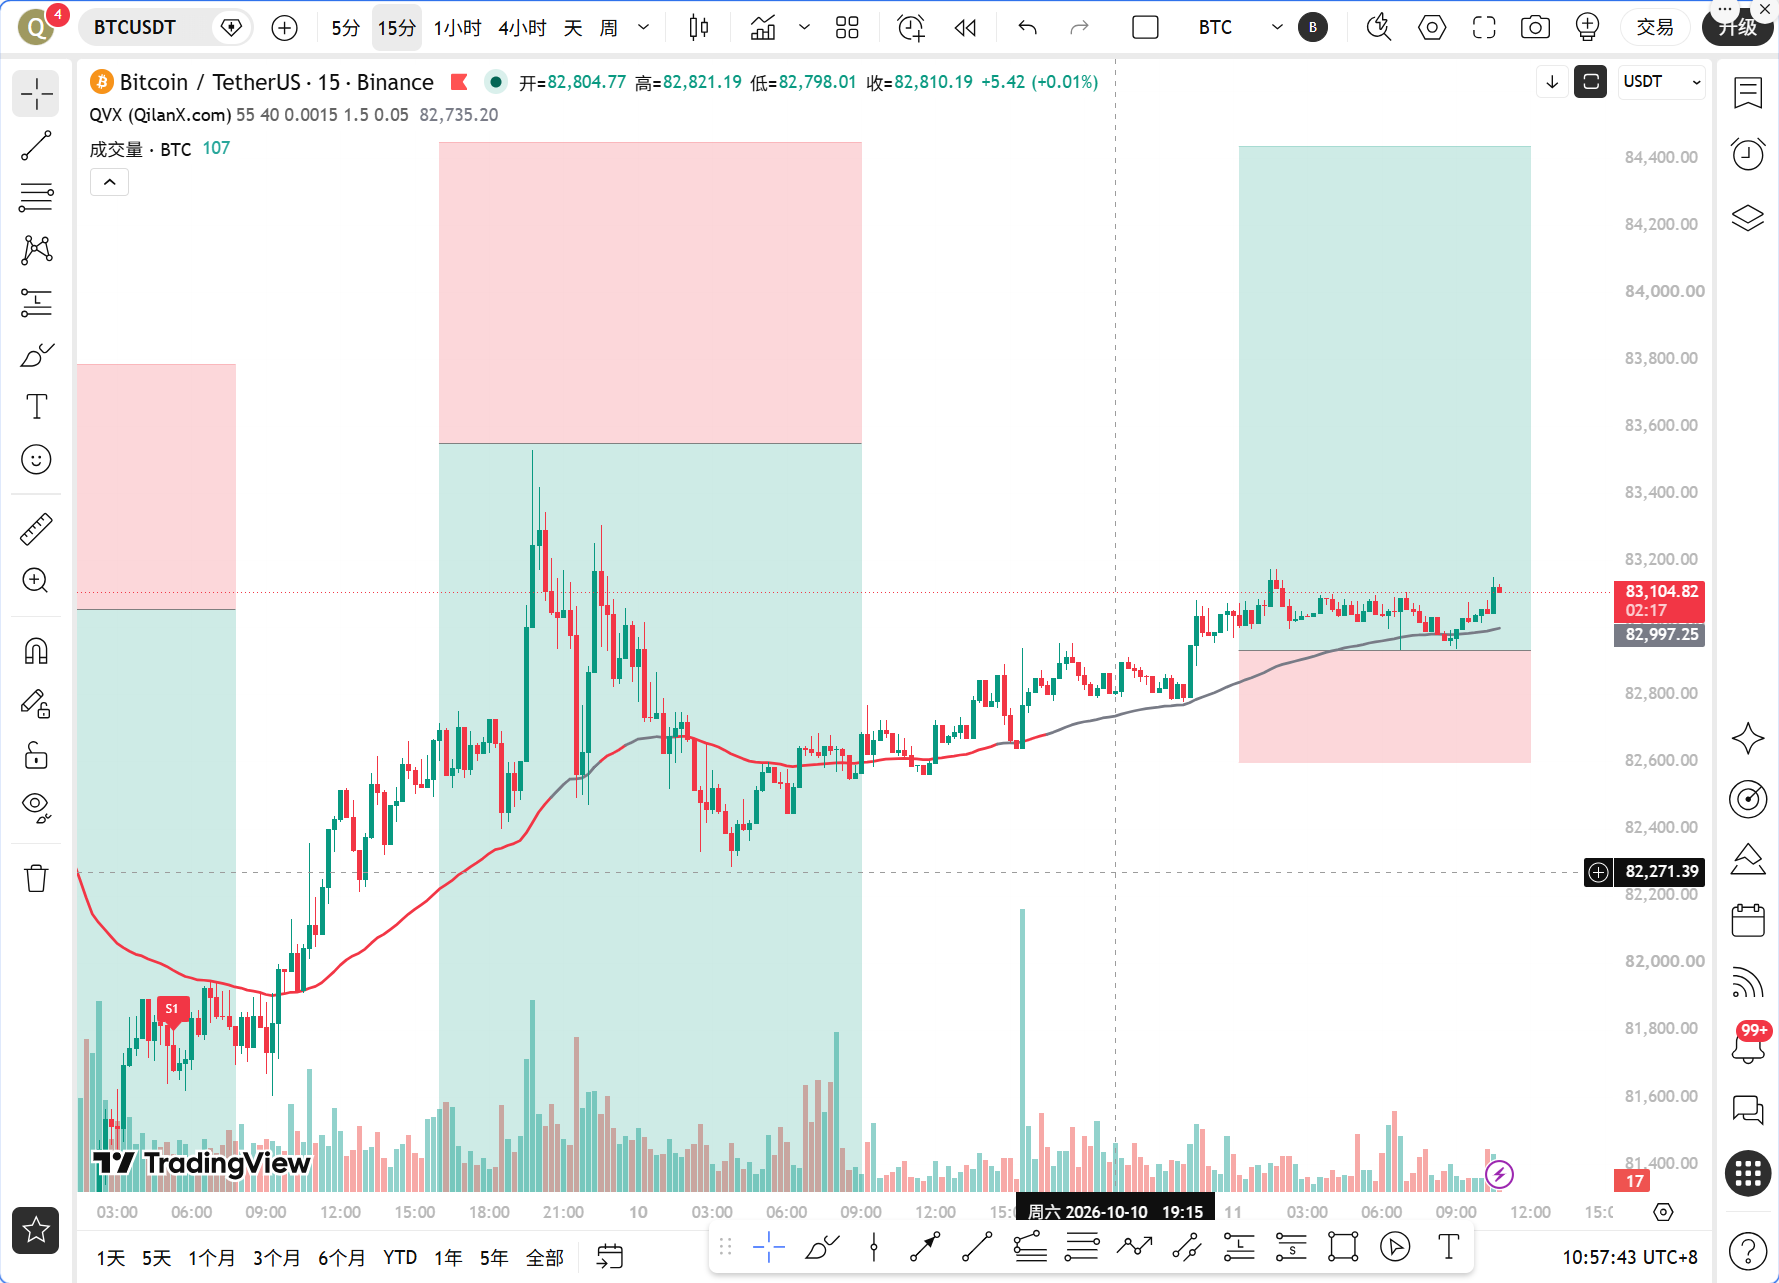
Today, there are two things that must be said upfront. The first, a U.S. envoy will visit Moscow within two weeks, bringing new developments in Ukrainian peace negotiations, with expectations for reduced geopolitical risks rising, which presents a clear benefit for risk assets, including Bitcoin. The second, today marks the anniversary of the epic liquidation event of 1011 in cryptocurrency history, looking back at the storm of $19.1 billion in liquidations, market sentiment is inevitably under pressure, and the warning bell of leveraged risks is still echoing. On one side is the warming winds of peace talks, and on the other side is the chill of the liquidation anniversary, with BTC currently standing above 83,000; the answer to the long and short battle is hidden in the market data.
Current Price and Time
It is now October 11, 10:56 AM, with the latest BTC price at 83,106 USDT, a 24-hour change of +0.45%, which is not a large movement but the structure is quietly changing. The Fear and Greed Index reports 61, in the greedy range, indicating that market sentiment is not pessimistic, but it cannot be described as enthusiastic either. The BTC market share is 59.11%, with funds still concentrated on Bitcoin, and the altcoin season has not fully started.
Multi-Cycle Status Overview
First, look at the daily chart. The daily MA5 is 82,761.24, MA10 is 84,092.46, and MA30 is 82,504.09. The price is currently between MA5 and MA10, with MA10 creating pressure above, while MA5 and MA30 form a support zone below. The daily MACD’s DIF is 875.21, DEA is 1,424.31, and the histogram value is -549.09, with DIF still running below DEA, indicating that the adjustment momentum at the daily level has not fully dissipated. The daily RSI is at 43.75, in a neutral to weak area, neither overbought nor oversold, indicating the daily chart is still in a repair stage.
Next, look at the 4-hour chart. The 4-hour MA5 is 83,021.65, MA10 is 82,836.91, MA30 is 83,348.85. The price is above MA5 and MA10 but pressured by MA30. The 4-hour MACD’s DIF is -290.59, DEA is -447.31, and the histogram value is 156.72, with DIF having crossed above DEA, and the histogram continuously positive, which is a clear signal of strengthening momentum at the 4-hour level. The 4-hour RSI is 69.21, close but not yet in the overbought area, still has upward space.
The 1-hour level is the core for today. The 1-hour MA5 is 83,037.61, MA10 is 83,050.55, MA30 is 82,866.76, with the three moving averages tightly bound in the narrow range of 82,866 to 83,050. The 1-hour MACD’s DIF is 95.45, DEA is 102.97, and histogram value is -7.52, with DIF slightly below DEA, and the histogram slightly negative, indicating that short-term momentum at the 1-hour level has weakened, but the extent is minimal. The 1-hour RSI is 67.11, somewhat strong but not overbought. The most critical point is that the 1-hour EMA55 is 82,821.70, and the current price of 83,106 is clearly standing above EMA55, by about 0.34%.
At the 15-minute level, MA5 is 83,071.85, MA10 is 83,033.13, and MA30 is 83,041.03, with moving averages closely intertwined. The 15-minute MACD’s DIF is 13.34, DEA is 3.46, and histogram value is 9.88, indicating short-term momentum is slightly bullish. The 15-minute RSI is 57.53, neutral and slightly strong.
TPV Signal Verification
According to the core rules of the Qinglan TPV system, we verify each condition.
First, EMA55 condition. The current price of 83,106 is greater than the 1-hour EMA55 of 82,821.70, and all of the last 8 one-hour closing prices are above EMA55, satisfying 8/8, with a crossing count of 0. The condition of two consecutive one-hour closing prices stabilizing above EMA55 has been far exceeded. The price distance from EMA55 is 0.34%, which is above the 0.3% oscillation threshold, indicating that it does not meet the judgment criteria for oscillating market conditions and may be in a unilateral trend. This is a clear signal of a bullish trend area.
Second, support stabilizing shape. From the 1-hour candlestick structure, the price has received support multiple times in the 82,800 to 83,000 range, and MA30 has formed an effective low point support near 82,866, with the price bouncing back upon touching, which conforms to the characteristics of effective low point rebounds.
Third, downwards momentum exhaustion. The 1-hour MACD histogram value is -7.52, although still negative, the extent is very small, and DIF and DEA are nearly glued together, indicating that downward momentum is nearing exhaustion. The 1-hour RSI is 67.11, continuously rebounding from previous low points, with no signs of overbought pullback. In summary, among the three conditions for going long in the TPV system, the EMA55 condition is fully satisfied, the support stabilizing condition is basically met, and the momentum exhaustion condition is being fulfilled but requires one bullish confirmation candle.
On-chain Funding Overview
In terms of on-chain data, the Fear and Greed Index of 61 is in the greedy range, indicating that market sentiment is leaning towards optimism but not extreme. The BTC market share of 59.11% remains high, with no large-scale fund movement to altcoins. Hyperliquid's cumulative revenue has surpassed $1.4 billion, with perpetual contracts contributing nearly 90%, validating the sustainability of the on-chain derivatives business model, which boosts confidence in the entire DeFi sector. On the other hand, Ledger has confirmed a supply chain attack, with at least one device having unauthorized hardware implanted, and fake Ledger websites topping Google search results to deceive users' mnemonic phrases, potentially leading to asset transfer and selling worries due to a trust crisis in hardware wallet security. In the whale segment, one address withdrew 5,965 ETH from Binance in 20 minutes, building a position of about $14.89 million, indicating that whales continue to accumulate ETH, sending bullish signals. A proposed amendment on crypto taxes in France was rejected, with no successful outcomes on stablecoin exchange taxes and exit taxes, thus temporarily alleviating compliance pressure in Europe. However, the SEC's lawsuit against former Linqto executives for fraud against retail investors over $430 million has not changed the tone of tightening regulatory enforcement.
Key Offense and Defense Levels
The first pressure level above looks at the vicinity of the 1-hour MA10 at about 83,050, with the price having repeatedly crossed here; once broken, we look at the 4-hour MA30 at 83,348, which is the most significant resistance at the 4-hour level. Further above, we see the daily MA10 at 84,092, which is the mid-term dividing line between bulls and bears. The first support level below looks at the 1-hour EMA55 at 82,821, which is the lifeline of the TPV system. The second support level looks at the support zone formed by the daily MA30 at 82,504 and daily MA5 at 82,761. If 82,821 is effectively broken and two consecutive one-hour candlesticks close below, the TPV system will switch to a bearish trend area, at which point a decisive adjustment of thought is necessary.
Trading Thoughts
Direction: Bullish bias, but need to wait for confirmation signals.
Entry Conditions: The current price of 83,106 has stood above the 1-hour EMA55, but the 1-hour MACD histogram is still slightly negative, suggesting waiting for closing confirmation of the MACD histogram turning positive or for a clear bullish engulfing pattern to enter long. Aggressive traders may enter with light positions in the range of 82,850 to 83,000, while conservative traders should wait for a breakout above 83,350 and confirm a pullback before entering.
Stop Loss: Set below the 1-hour EMA55 at about 82,700, which is 82,821 minus about 120 USDT for buffer space. If the price closes below 82,821 for two consecutive one-hour candlesticks, exit unconditionally.
Target Levels: First target 83,350, second target 84,090, third target ranges from 84,800 to 85,000. The risk-reward ratio is calculated based on an entry at 83,000, stop loss at 82,700, and the first target at 83,350, about 1 to 1.2; if held to the second target at 84,090, the risk-reward ratio can reach 1 to 3.6.
Risk Warning
The 10/11 liquidation anniversary combined with Ledger's security incident has left the market sentiment fragile; leverage positions must be controlled, and stop-loss discipline strictly executed.
Follow Qinglan Crypto Classroom to seize more trading opportunities! Welcome to visit the official website www.qinglan.org
📊 Qinglan TPV Trading Strategy Backtest Reference
🕒 Last backtest time 10-11 07:00:01
Total Analysis: 4323 Backtest: 4316 Accuracy: 77.6% (3351/4316)
免责声明:本文章仅代表作者个人观点,不代表本平台的立场和观点。本文章仅供信息分享,不构成对任何人的任何投资建议。用户与作者之间的任何争议,与本平台无关。如网页中刊载的文章或图片涉及侵权,请提供相关的权利证明和身份证明发送邮件到support@aicoin.com,本平台相关工作人员将会进行核查。