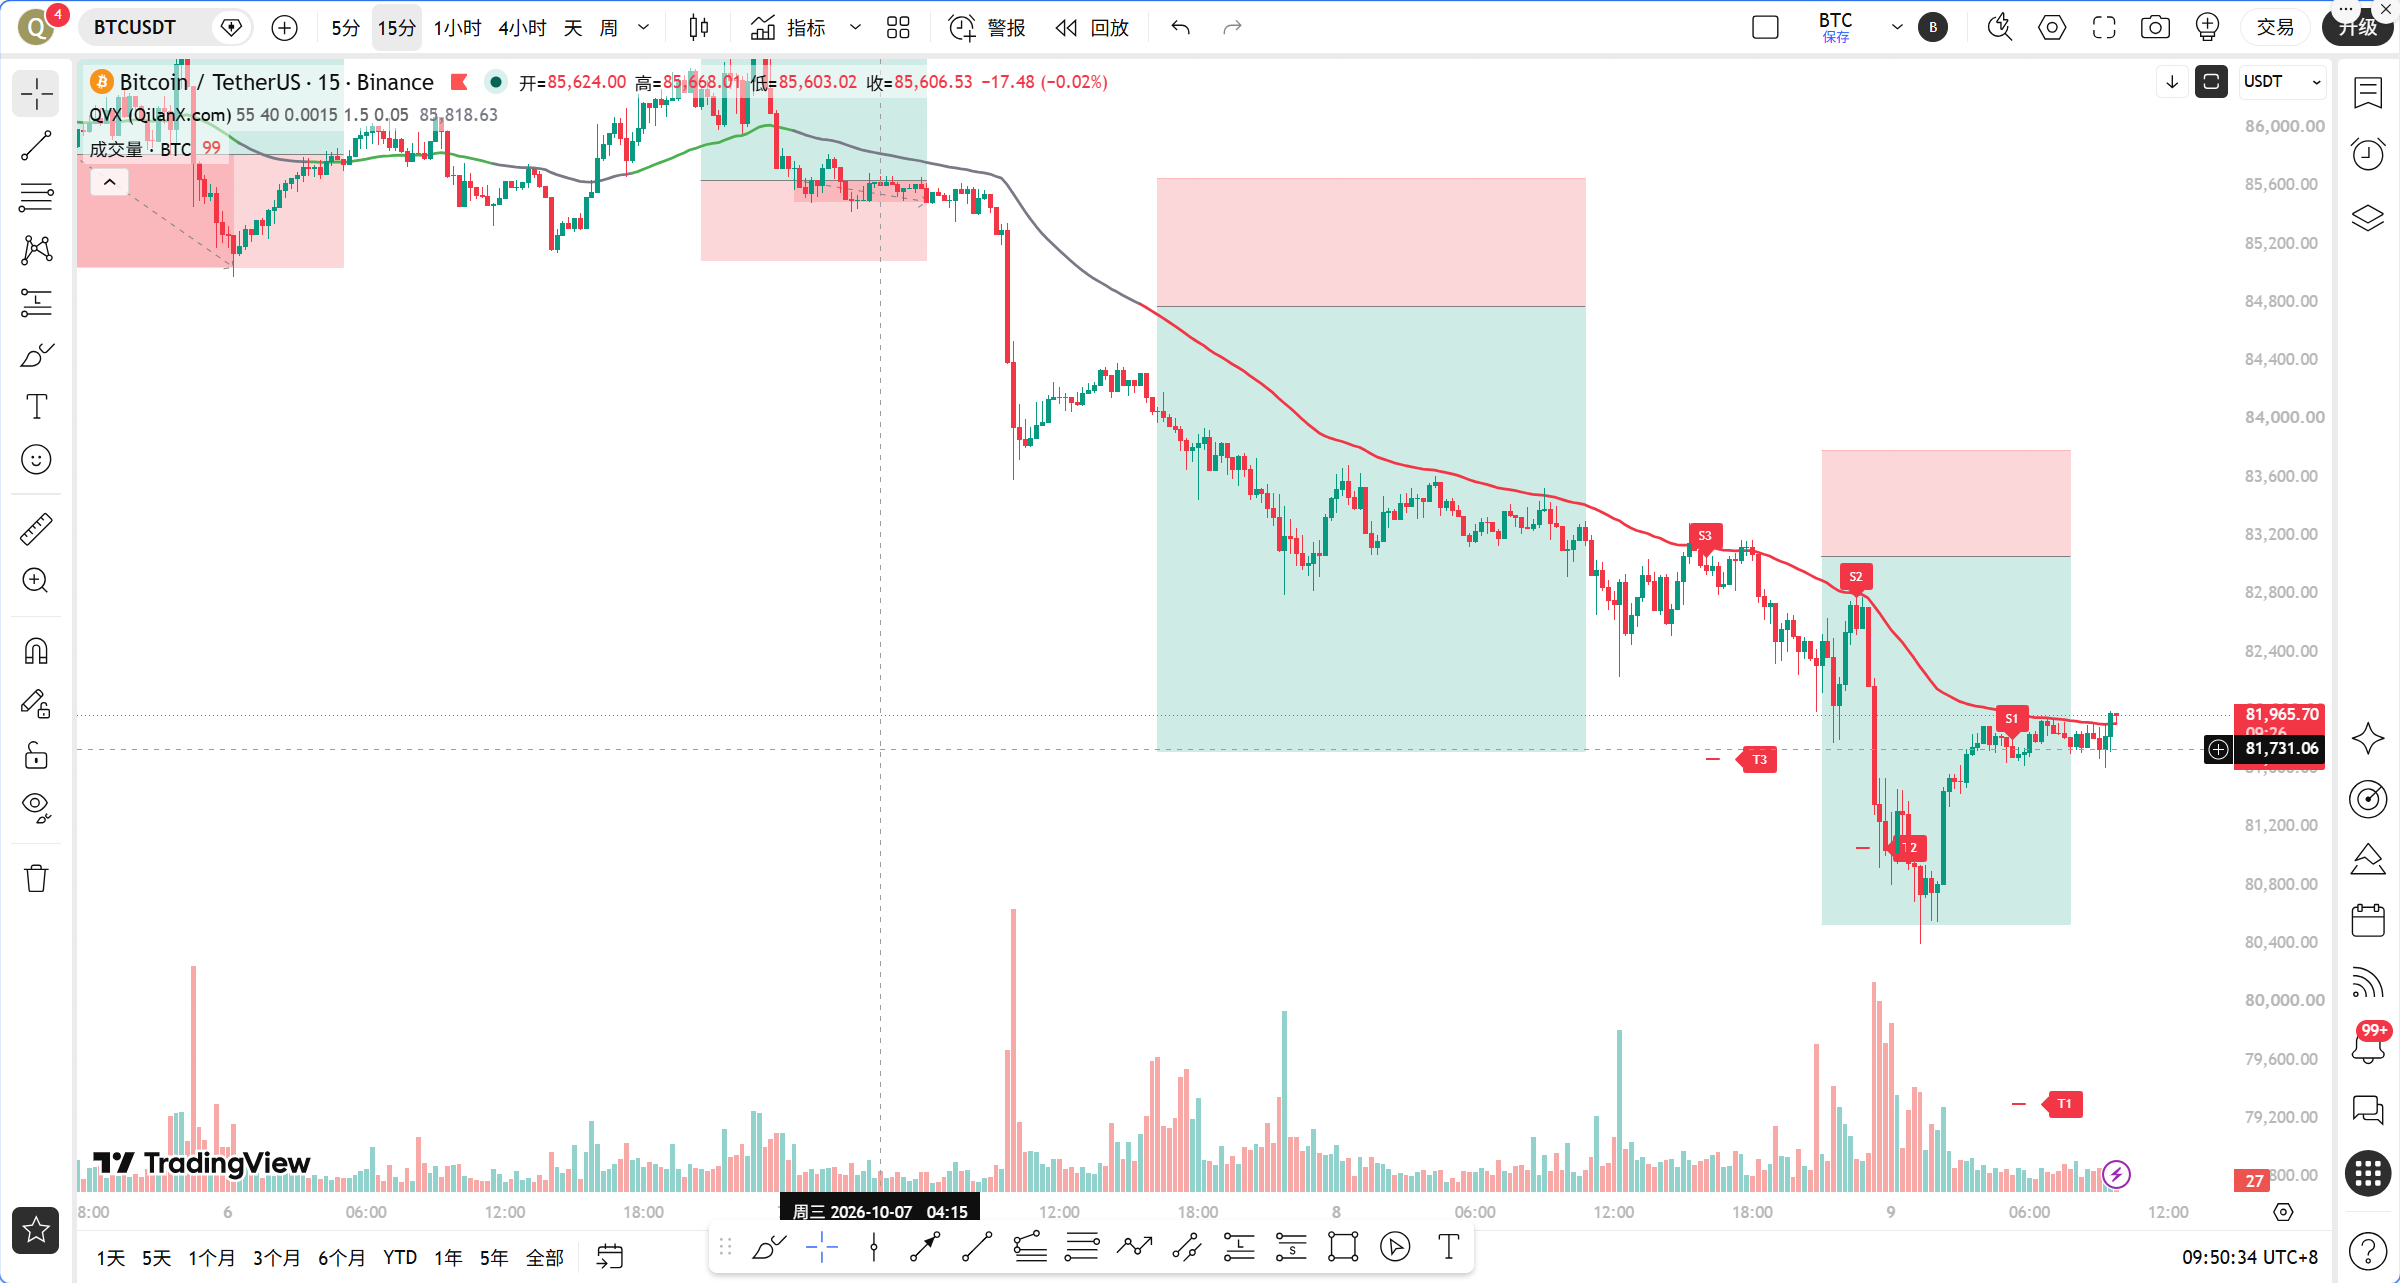
Federal Reserve official Musalem recently stated that further interest rate hikes may be needed in the next 6 to 9 months, leading to a sudden increase in expectations for tighter liquidity, which directly suppresses the valuation of risk assets such as BTC. Meanwhile, after Bitcoin fell below the 82,000 mark, the liquidation amount across the network reached as high as $684 million in just 12 hours, with funding rates turning negative, and market sentiment rapidly deteriorating. These two messages combined form the core contradiction of today's market: the game between tightening macro liquidity expectations and the clearing of short-term bullish leverage.
The current time is October 9 at 09:48, with the latest BTC quote at 81,903 USDT, a 24-hour drop of 1.69%, and BTC's market share at 59.06%. The fear and greed index is at 59, still in the greed range. Note this detail: prices are falling, but the greed index has not entered the panic zone, indicating that market sentiment has not fully capitulated, which means the bottom may still require further confirmation.
First, let's look at the multi-cycle status. On the daily level, MA5=83,659.21, MA10=84,260.13, MA30=82,069.67. The current price of 81,903 has fallen below the daily MA30, which is a signal that has not appeared since this round of increases and warrants high alert. The daily MACD bar value is -605.91, DIF=1,079.09, DEA=1,685.00. DIF is still operating below DEA, and the adjustment pressure at the daily level has not been lifted. The daily RSI=39.13, leaving some space before reaching the oversold zone.
On the 4-hour level, MA5=81,795.39, MA10=82,494.34, MA30=84,470.70. The moving averages show a clear bearish arrangement, struggling near the MA5. The 4h MACD bar=-262.48, DIF=-908.82, DEA=-646.33, with bearish momentum still being released. However, the 4h RSI=18.90, which has entered an extremely oversold zone, is one of the lowest RSI readings in the 4-hour level since 2026, indicating that short-term bearish momentum may be overstretched, and a technical rebound may be needed.
On the 1-hour level, MA5=81,815.23, MA10=81,588.00, MA30=82,403.09. The price is above MA5 and MA10, but MA30 acts as resistance. The 1h MACD bar=80.39, DIF=-395.15, DEA=-475.54. Note that the MACD bar has turned positive, and DIF has crossed above DEA, forming a golden cross state. Although the crossover is marked as neutral, the shift from negative to positive in column value itself is a signal of short-term momentum improvement. The 1h RSI=43.21, is in the neutral weak zone, neither oversold nor overbought.
On the 15-minute level, MA5=81,849.00, MA10=81,823.82, MA30=81,775.80. The moving averages show a bullish arrangement, with the price operating above the averages. The 15m MACD bar=9.95, DIF=42.39, DEA=32.44, indicating a short-term bullish momentum. The 15m RSI=55.70, neutral but leaning towards strong. The 15-minute level shows signs of short-term stabilization.
Now let's use the TPV system for signal validation. The core rule is that the 1-hour EMA55 serves as the boundary between bullish and bearish. Currently, the 1h EMA55=83,050.43, while the price is far below this level at 81,903, with a gap of 1.38%. In the past 8 1-hour K candles, the number of closing prices above the EMA55 is 0/8, with no crossings, meaning the price has been running below EMA55 for 8 consecutive hours, which is in a clear bearish trend area, not in line with oscillation market assessment criteria.
For long conditions validation: First, the price must hold above the 1H EMA55, requiring two consecutive 1-hour K candles to close above EMA55, which is currently not satisfied. Second, regarding stabilization support patterns, there are signs of stabilization at the 15-minute level, but on the 1-hour level, there has not been a clear long lower shadow or bottom formation structure. Third, concerning the exhaustion of downward momentum, the 1h MACD bar has shortened for two consecutive cycles, closing in on zero and turning positive, which is the only condition met. Only one of the three conditions is satisfied, and the TPV system does not recommend actively going long at this time.
For short conditions validation: First, the price is under pressure below 1H EMA55, with 8 consecutive candles closing below EMA55, fully satisfied. Second, regarding pressure resistance patterns, the price encountered resistance near the 1h MA30 around 82,400 and fell back, which matches the characteristics of a valid high point followed by a decline. Third, concerning the lack of strength in rebounds, the 1h MACD bar turning positive indicates that short-term rebound momentum is accumulating, which does not satisfy the short-selling conditions. In summary, the short conditions meet two points, but momentum conditions do not support chasing shorts.
On-chain data shows that the fear and greed index of 59 is in the greed range, diverging from the price drop, indicating that market sentiment has not fully released. BTC market share of 59.06% is at a relatively high level, with funds trending toward BTC. The U.S. government transferred 833.6 BTC to Coinbase Prime, worth $71.6 million, increasing short-term supply pressure. Miner hashrate and income have both recovered, alleviating some selling pressure, which is one of the few bullish signals. The funding rate turning negative means shorts begin to pay fees to longs, historically often seen near stage bottoms.
Key attack and defense positions can be summarized. The first resistance level above is near 82,400, corresponding to the intersection area of 1h MA30 and 4h MA10. The second resistance level is at 83,050, where the 1h EMA55 is located, which is the boundary line in the TPV system for long and short. Only by reclaiming this position can a trend reversal be confirmed. The first support level below is in the range of 81,500 to 81,700, corresponding to the dense area of the 15-minute moving average and 1h MA10. The second support level is near 79,000, which is the whale cost line and psychological level mentioned in the news.
Trading ideas. Direction: Short-term technical rebound, medium-term wait for trend confirmation. Entry conditions: Aggressive traders may lightly try to go long in the range of 81,500 to 81,800 but must wait for clear bullish engulfing or volume stagnation signals at the 15-minute level. Conservative traders should wait for the price to regain above 1h EMA55 at 83,050 and confirm two consecutive 1-hour closing prices above it before entering long. Stop-loss settings: Aggressive long stop-loss below 80,800, i.e., breaching previous low structure. Conservative long stop-loss below 82,000. Target positions: First target 82,400, second target 83,050, third target 84,000. If the price encounters resistance in the range of 82,400 to 83,050 and the 1h MACD bar shortens again, then consider taking a position to short, setting the stop-loss above 83,500, targeting 81,500 and 80,000.
Risk warning: Continued fermentation of expectations for Fed interest rate hikes may trigger a new wave of selling. If BTC falls below the key support of 79,000, all long logic needs to be reassessed.
Follow Qinglan Crypto Classroom to grasp more trading opportunities! Welcome to visit the official website www.qinglan.org
📊 Qinglan TPV Trading Strategy Backtest Reference
🕒 Last backtest time 10-09 07:00:02
Total analysis: 4277 Backtest: 4270 Accuracy: 78.1% (3335/4270)
免责声明:本文章仅代表作者个人观点,不代表本平台的立场和观点。本文章仅供信息分享,不构成对任何人的任何投资建议。用户与作者之间的任何争议,与本平台无关。如网页中刊载的文章或图片涉及侵权,请提供相关的权利证明和身份证明发送邮件到support@aicoin.com,本平台相关工作人员将会进行核查。