Cryptocurrency Scholar: 10.9 Bitcoin (BTC) TD nine-turn flashes in the oversold zone, the technical aspect is brewing a violent rebound
The current price of Bitcoin is 81200. Every time there is a major drop, someone asks me: Is it crashing? Is the bull market over? My answer is always the same: If you extend the candlestick chart, this slight drop in the current situation is just a small wave in historical trends. I'm not saying it won't drop, but don't scare yourself. The worst thing in trading is being driven by emotions; feeling excited and chasing highs when it rises, and feeling fear and cutting losses when it falls. This isn't trading, this is being traded.
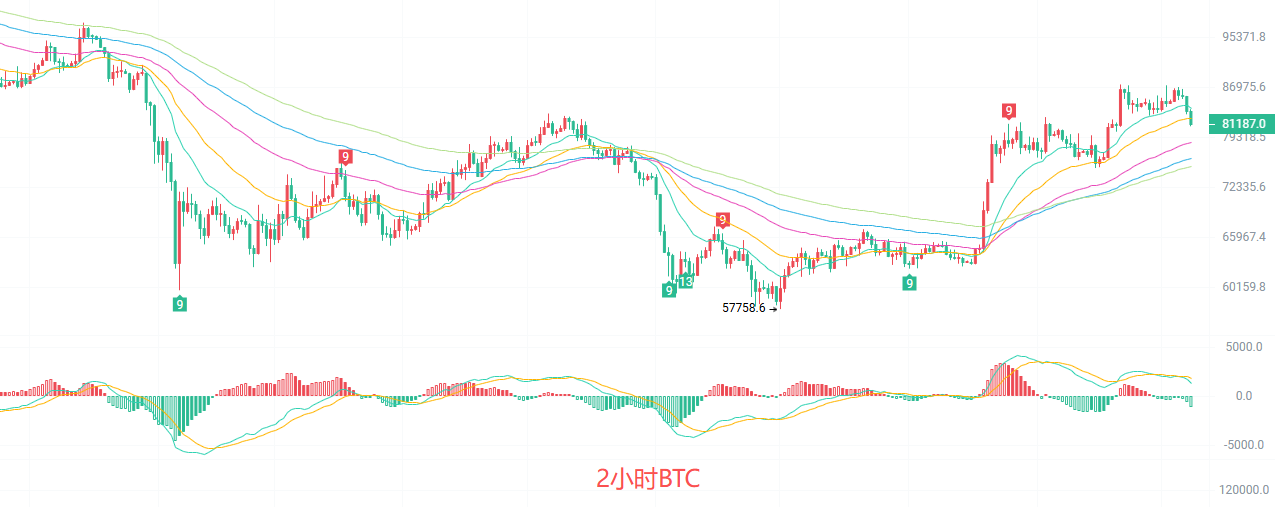
The daily K-line Bollinger Band lower track is around 81052, and the current price is just at this position. On the short-term moving average front, EMA15 is at 83703, EMA30 is at 85756, and the price has already dropped below these two short moving averages, indicating that short-term bullish momentum is weakening. However, looking at it in the long run, EMA60 is at 78536, EMA90 is at 76270, EMA120 is at 75142, and the price is still above these medium and long-term moving averages; the mid-term upward structure has not been broken. In terms of MACD, DIF has crossed below DEA and is still in an adjustment cycle. The daily Bollinger Band lower track at 81050 is the first line of defense to watch today; if it holds, there will still be a chance for a rebound.
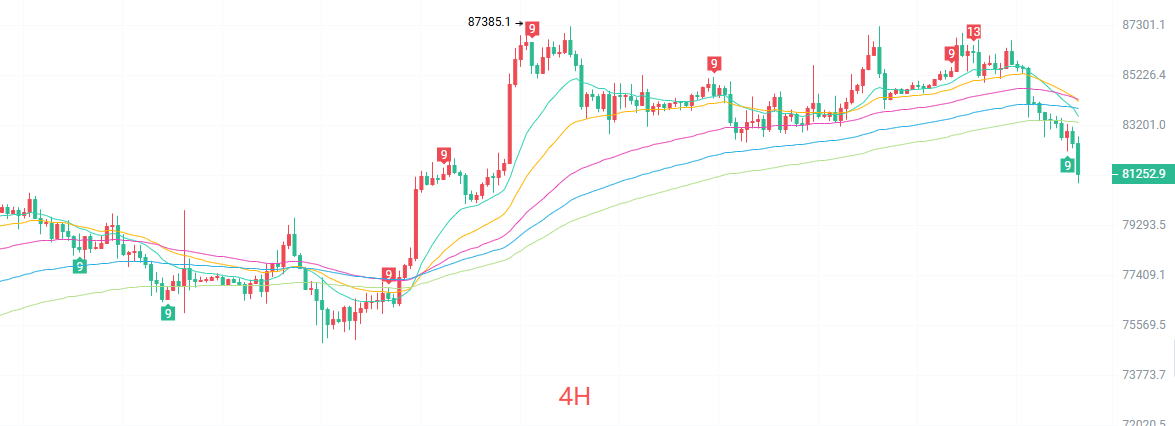
The four-hour K-line has broken below the Bollinger Band lower track at 81564, which is in a short-term oversold state. All four EMA moving averages are pressing down on the price: EMA15 is at 83552, EMA30 is at 84167, EMA60 is at 84239, and EMA90 is at 83863, forming a typical bearish arrangement. The bearish momentum of MACD has not yet been fully released. However, pay attention, a TD nine-turn buy signal has already appeared near today's low of 80901, which usually indicates that a technical rebound may occur at any time in the short term. Now is not the time to short; it is time to wait for a rebound or stabilization.
Short-term Reference
Go up from 81000 to 80500 to stop the fall, stop loss at 500 points, target at 83500 to 84000
Go down from 83500 to 84000 to stagnate, stop loss at 500 points, target at 82500 to 81500
Specific operations should be based on real-time market data. For more information, you can consult the author. There may be a delay in article publication; it is recommended for reference only, and risks are to be borne by yourself.

Warm reminder: The above content is created by the author of the public account. The advertisements at the end of the article and in the comment area are unrelated to the author. Please be cautious in distinguishing, thank you for reading.
免责声明:本文章仅代表作者个人观点,不代表本平台的立场和观点。本文章仅供信息分享,不构成对任何人的任何投资建议。用户与作者之间的任何争议,与本平台无关。如网页中刊载的文章或图片涉及侵权,请提供相关的权利证明和身份证明发送邮件到support@aicoin.com,本平台相关工作人员将会进行核查。