Crypto Circle Academician: A large bearish candlestick on October 9th rewrites the entire market structure for Ethereum (ETH)!
The current price of Ethereum is 2450. I've noticed a pattern: whenever the market seems most hopeless, a turnaround is often not far away. Ethereum has fallen from 2800 to the current 2450, dropping over three hundred dollars in four days, and there is a lot of wailing in the crypto circles. Some have asked me if the bull market is over. I do not directly answer because the market does not have a standard answer, only probabilities. What I can do is break down the current market structure for you, highlighting the key support and resistance levels. As for how to make decisions, that's up to you.
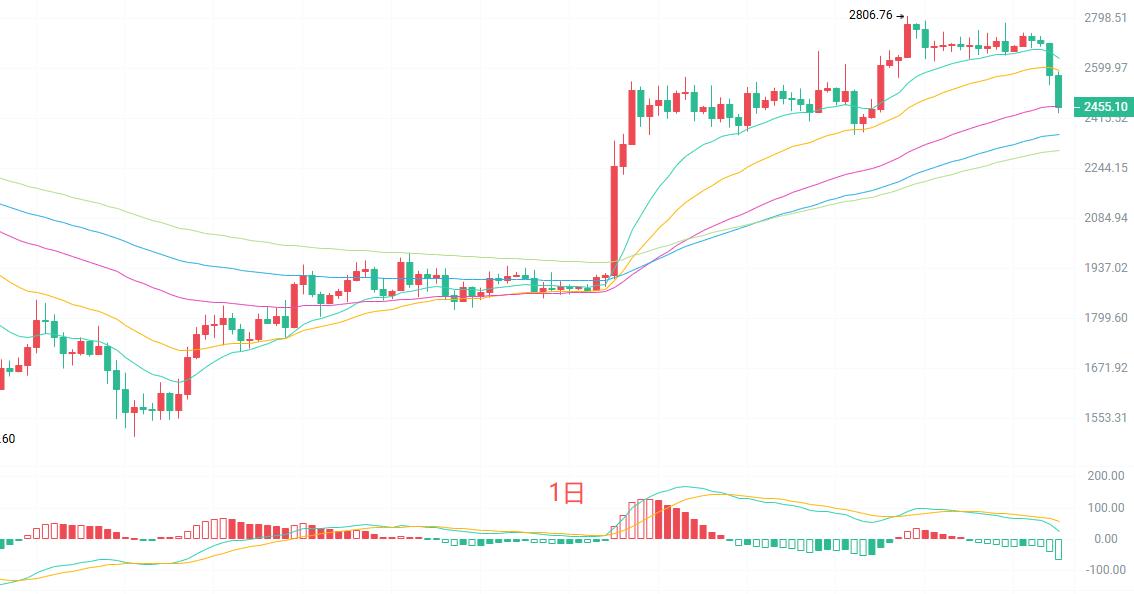
The daily candlestick has directly engulfed nearly two weeks of gains, with a retracement of over 12% from the high of 2806. Technically, the price has dropped below the lower Bollinger Band at 2544, with the middle band at 2675 and the upper band at 2806. In the moving average system, EMA15 is at 2636 and EMA30 is at 2593, both have been decisively rejected, and the EMA60 at 2456 is currently being tested. The MACD green bars continue to grow, and the DIF has crossed below the DEA to form a death cross, with bearish momentum still being released. However, note that the large structure that has risen from 1503 on the daily chart hasn't been broken. The EMA90 at 2357 and EMA120 at 2304 create a strong support zone. This current pullback still appears to be a deep correction within an upward trend, not a trend reversal.
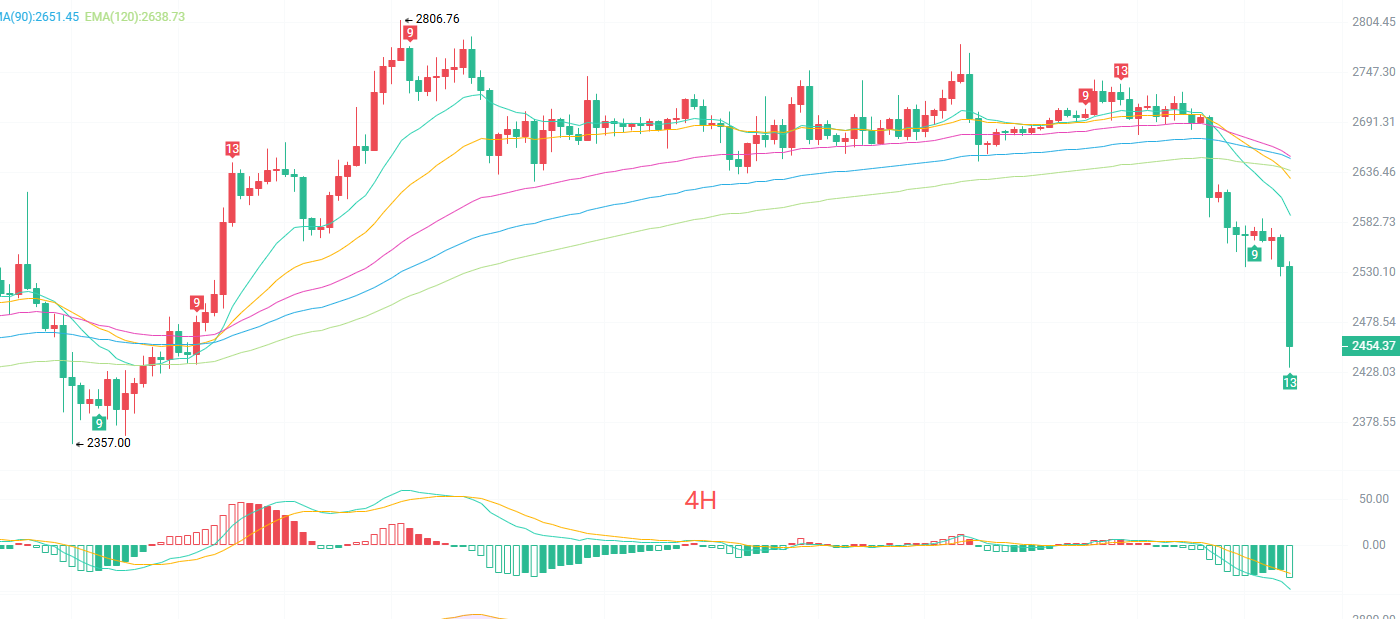
The four-hour candlestick shows consecutive large bearish bars breaking through all short-term moving averages. The current price is 2451, whereas EMA15 is at 2589, EMA30 at 2629, and EMA60 at 2653, all forming resistance above. This is a typical bearish arrangement. The Bollinger Bands are opening downward, and the lower band at 2479 has been broken effectively, indicating extreme short-term bearish sentiment. The MACD continues to expand below the zero line, with no signs of a reduction in the green bars. However, there is one signal worth noting— the TD sequence has produced 13 sell counts, indicating that the energy for this short-term decline has technically entered a countdown, and the cost-effectiveness of continuing to short is decreasing, with a technical rebound possible at any moment.
Short-term reference:
Going north, support at 2400 to 2350, stop loss at 40 points, target from 2500 to 2550.
Going south, resistance at 2500 to 2550, stop loss at 40 points, target from 2450 to 2400.
Specific operations should focus on real-time market data. For more detailed information, you can consult the author. There may be a delay in article publication; it is recommended for reference only, and risks are borne by yourself.

Warm reminder: The above content is authored solely by the author of the public account. The advertisements at the end of the article and in the comments section are unrelated to the author. Please discern carefully, and thank you for reading.
免责声明:本文章仅代表作者个人观点,不代表本平台的立场和观点。本文章仅供信息分享,不构成对任何人的任何投资建议。用户与作者之间的任何争议,与本平台无关。如网页中刊载的文章或图片涉及侵权,请提供相关的权利证明和身份证明发送邮件到support@aicoin.com,本平台相关工作人员将会进行核查。