Dear teammates, today's biggest shock in the market comes from Bitget. The massive theft of 387.5 million US dollars caused market confidence to collapse momentarily, and panic spread rapidly. However, the good news is that the platform has begun to restore withdrawals in phases, and the loophole has been fixed, so the most panicked stage is temporarily over. Meanwhile, the AI dialogues between China and the US will resume before the end of November, with both sides establishing risk communication channels, leading to a warming of risk appetite, which is indirectly favorable for the cryptocurrency market. But do not celebrate too early as this week will see the release of key PCE and non-farm data. If the PCE exceeds expectations, the cooling of interest rate cut expectations could directly hit BTC and ETH hard. The market is at a very sensitive crossroads with both long and short positions at play.
Current Price and Time
As of September 28th, 10:19 AM, BTC is quoted at 83642 USDT, with a 24-hour change of -0.42%. The Fear and Greed Index is at 74, still in the greed range but has retreated compared to the previous value. BTC's market share is at 58.68%, and funds are still concentrating towards Bitcoin, with altcoins under significant pressure.
Multi-Cycle Status Overview
First, let's look at the daily chart. MA5=84211.40, MA10=84071.12, MA30=80132.94, the moving average system is still in a bullish arrangement, with MA30 far below the current price, and the mid-term trend structure has not been damaged. Regarding the MACD, DIF=2318.95, DEA=2236.42, and the histogram=82.53, it remains in a golden cross state, but the histogram has begun to show signs of narrowing. RSI=65.66, has retreated from a high position, and has not yet entered the oversold area, with the overall daily assessment indicating a pullback phase within a bullish trend.
Now looking at the 4-hour chart. MA5=84442.21, MA10=84400.99, MA30=84363.18, the three moving averages are tightly clustered within a narrow range of 84363 to 84442, indicating that the 4-hour level is experiencing a directional choice. The MACD’s DIF=95.30, DEA=160.98, and the histogram=-65.68, has fallen into the negative range, suggesting bearish short-term momentum. RSI=44.41, is in a neutral but weak position. The 4-hour level shows a fluctuation pattern within a bullish trend that is somewhat weaker.
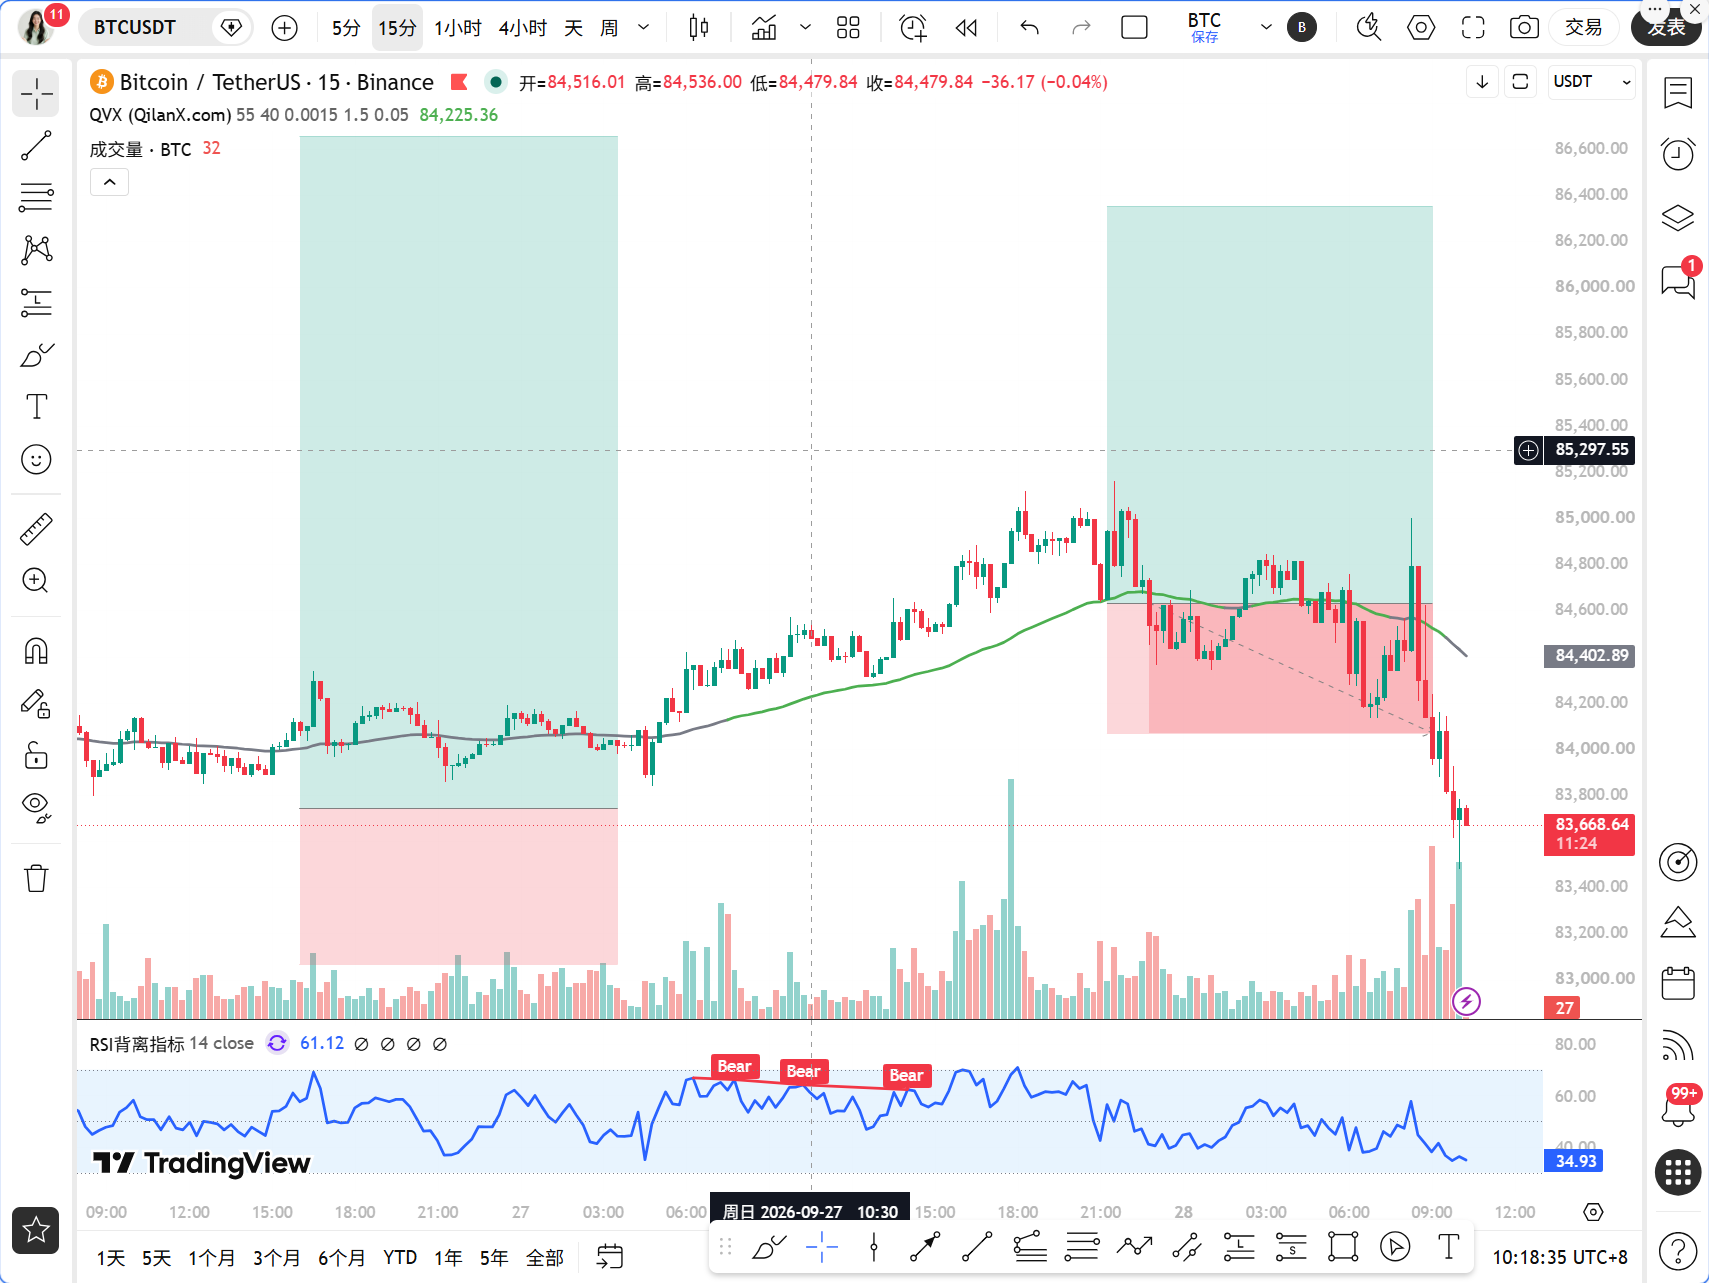
The 1-hour level is the key observational window. MA5=84028.67, MA10=84351.23, MA30=84497.62, the moving averages present a bearish arrangement, with the price running below the moving averages. The MACD's DIF=-117.44, DEA=13.58, and the histogram=-131.02, indicating that bearish momentum is still being released. RSI=32.03, is close to oversold but has not yet bottomed out. The most critical factor is the 1-hour EMA55=84357.67, the current price of 83642 is significantly below this position, with a gap of about 715 USDT, a magnitude of 0.85%.
At the 15-minute level, MA5=83794.99, MA10=84059.71, MA30=84382.16, the moving averages are in a bearish arrangement. The MACD’s DIF=-218.74, DEA=-147.81, and the histogram=-70.93, shows that bearish momentum has weakened but is still in the negative zone. RSI=37.99, has seen a slight rebound from a low position. The 15-minute chart indicates signs of stabilization in the short term, but the strength is limited.
TPV Signal Verification
According to the core rules of the Qinglan TPV system, we verify item by item.
First, EMA55 bullish and bearish dividing line. The current price of 83642 is below the 1-hour EMA55 of 84357.67, and in the last 8 1-hour candles, the number of closing prices greater than EMA55 is 4/8, with crossing occurrences at 3 times, and the absolute magnitude between the price and EMA55 is 0.85%. These three data points point to one conclusion: we are currently in a fluctuation market. According to the TPV system rules, in a fluctuating market, do not actively long or short, only provide a range.
Second, verification of long conditions. For the price to be stable above EMA55, there must be two consecutive 1-hour candles with closing prices greater than EMA55, which is currently not satisfied. In terms of support stabilization, the 15-minute level has a slight lower shadow but it is not long enough, and there is no clear bottom formation seen. Regarding the exhaustion of declining momentum, although the MACD histogram has shortened slightly, it has not shortened for two consecutive periods, and the RSI has slightly rebounded from 32.03 but has not returned above 30 to provide confirmation of a breakout. None of the three conditions are met, so we do not go long.
Third, verification of short conditions. For the price to be pressured below EMA55, there must be two consecutive 1-hour candles with closing prices less than EMA55, which is satisfied. However, in terms of pressure resistance, there have not yet been any long upper shadows or top formations, and there is no clear signal of touching an effective high point and then falling back. Regarding the weakness of rebounds, although the MACD histogram is indeed in the negative zone, no confirmation of continuous two-period shortening has occurred. Only one of the three conditions is met, which does not constitute a complete short signal.
In summary, the TPV system currently provides a signal of fluctuation, indicating not to actively long or short and only provide a range.
On-chain Capital Flow
On-chain data shows, with a Fear and Greed Index of 74, which has risen from the previous value of 70, but is still in the greed zone, indicating that market sentiment has not collapsed. BTC's market share is at 58.68%, and there is a clear tendency for funds to seek safety, with continued outflow from altcoins. The Coinbase Bitcoin premium index has been negative for four consecutive days at -0.0082%, which is a warning signal, indicating weak buying from US institutions and insufficient short-term upward momentum. However, listed companies have added 2305 BTC this week, with total holdings reaching 1.273 million BTC, led by Strategy with 846,000 BTC, indicating a sustained trend of institutional long positions. Riot has prepaid a $200 million loan, releasing 5821 BTC in pledged assets, reducing the risk of forced selling. After the theft at Bitget, the restoration of withdrawals has alleviated short-term panic, but confidence restoration will take time.
Key Attack and Defense Levels
The first resistance level above is near the 1-hour EMA55 at 84357, which is the core position of the bullish and bearish dividing line. If the price can regain 84357 and close two consecutive 1-hour candles above it, the fluctuation pattern may be broken, and the bulls are expected to regain control of the situation. The second resistance level above is in the dense area of the 4-hour moving averages ranging from 84400 to 84442; breaking through here would open further upward space.
The first support level below is at the psychological support level of 83000, which has been tested multiple times recently. The second support level below is near 82500; if this level is broken, the daily level pullback may deepen, with the next target looking towards the 81500 to 82000 range.
Trading Thoughts
Direction: Fluctuating market, do not actively long or short, wait for signal confirmation.
Long entry conditions: The price must be above the 1-hour EMA55 at 84357, with two consecutive 1-hour candles closing above EMA55, along with support stabilization patterns such as long lower shadows or bottom formations, and MACD histogram shortening for two consecutive periods or RSI rebounding from below 30. All three conditions must be met to enter a long position. Entry reference is from 84357 to 84500, with a stop-loss set below 83800, and the first target at 85000, and the second at 85500.
Short entry conditions: The price must be continuously pressured below the 1-hour EMA55, with two consecutive 1-hour candles closing below EMA55, along with pressure resistance patterns such as long upper shadows or top formations, and MACD histogram shortening for two consecutive periods or RSI falling back from above 70. All three conditions must be met to enter a short position. Entry reference is from 83800 to 84000, with a stop-loss set above 84500, with the first target at 83000, and the second at 82500.
In the current fluctuating pattern, the most taboo is chasing after rising and falling prices. The core logic of the TPV system is to wait for certain signals; it’s better to miss opportunities than to make mistakes. The crossing occurrences of the last 8 1-hour candles reached 3 times, indicating fierce bullish and bearish competition, with a high probability of fake breakthroughs, so strictly waiting for signal confirmation is the right strategy.
Risk Warning
This week's PCE and non-farm data, if they exceed expectations, could potentially lead to rapid drops in BTC below the support of 82500 as the expectations for interest rate cuts cool down, so it is crucial to strictly control positions.
Follow Qinglan Crypto Classroom to seize more trading opportunities! Welcome to visit our official website www.qinglan.org
📊 Qinglan TPV Trading Strategy Backtesting Reference
🕒 Last Backtesting Time 09-28 07:00:02
Total Analysis: 4138 Backtests: 4138 Accuracy Rate: 78.6% (3251/4138)
免责声明:本文章仅代表作者个人观点,不代表本平台的立场和观点。本文章仅供信息分享,不构成对任何人的任何投资建议。用户与作者之间的任何争议,与本平台无关。如网页中刊载的文章或图片涉及侵权,请提供相关的权利证明和身份证明发送邮件到support@aicoin.com,本平台相关工作人员将会进行核查。