Cryptocurrency Academician: 9.28 Bitcoin (BTC) bull market consolidation hides dangers; can we uncover turning point signals from a cyclical perspective? Latest market analysis and trading advice interpretation
The current price of Bitcoin is 84400. High-level fluctuations easily breed fantasies; those who are bullish always feel a new high is imminent, while those who are bearish believe a significant drop could happen at any moment. The market will not move based on individual opinions; everything relies on the K-line signals. Additionally, friends who are heading north from low levels should remain calm and not rush to exit, especially those heading north from 65000 and 75500 should reduce their holdings but not empty their shopping carts.
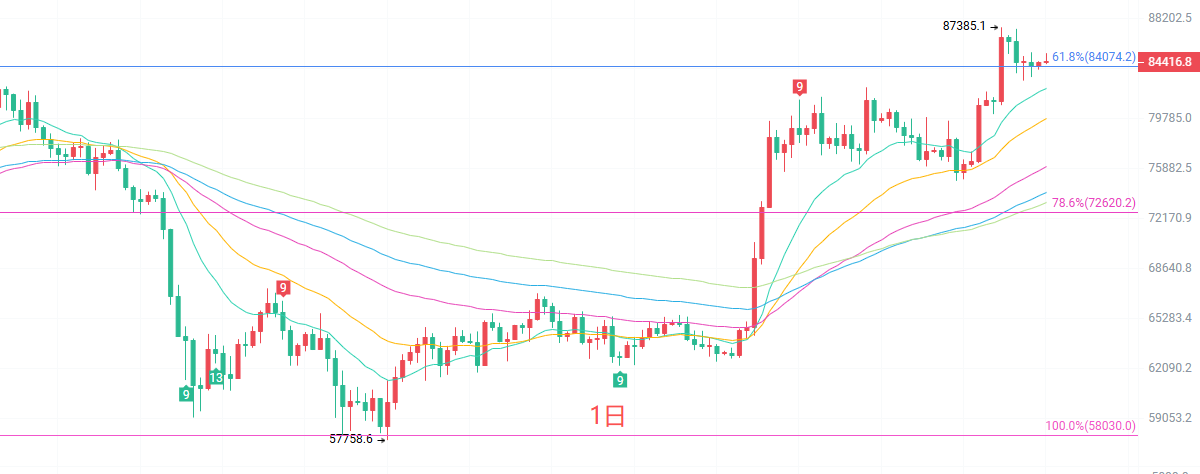
The daily K-line is in the upper middle bandwidth of the Bollinger Bands, with the upper band at 87753 and the lower band at 73087. The daily EMA15 is at 82261, and the short-term moving averages still maintain a bullish arrangement, while the mid to long-term moving averages support upward. The large cycle's bullish structure has not been broken. The MACD indicator shows that the upward momentum is beginning to weaken and the upward strength is slowing down, but no death cross reversal signal has formed. The previous high of 87385 is a strong resistance level on the daily chart. If it cannot stabilize with increased volume, it is likely to continue the high-level fluctuations; once the EMA15 moving average is effectively broken below, the short-term market will turn to a correction.
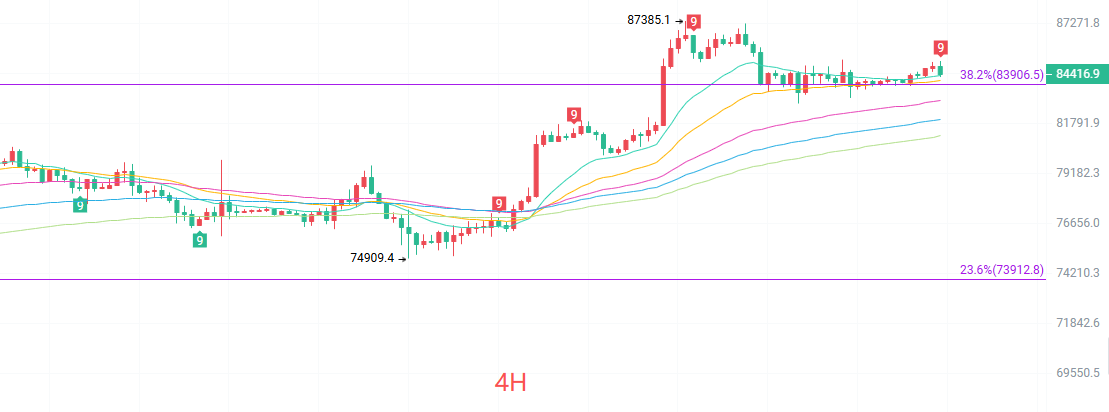
The four-hour K-line is running close to the middle track of the Bollinger Bands, with the upper band at 84857 and the lower band at 83559. The Bollinger Bands channel is narrowing, indicating that a trend change is imminent in the short term. EMA15 is at 84364, and the short-term moving averages are intertwined, with the long and short forces tending to balance. The MACD indicator's bullish momentum is basically stagnant, and on the 4-hour chart, it can be clearly seen that after the high of 87385, the price's center of gravity is slowly descending, with each rebound height gradually lowering, representing a consolidation pattern after an uptrend. The short-term lacks sustained upward momentum, and the consolidation range will continue to constrain price fluctuations.
Short-term reference
Upward from 86300 to 86700, stop loss 500 points, target 85500 to 84500.
Downward from 83500 to 83000, stop loss 500 points, target 85500 to 86500.
Specific operations depend primarily on real-time market data. For more detailed information, you can consult the author. There may be delays in article publication, so the suggestions are for reference only, and risks are to be borne by the reader.

Kind reminder: The above content is solely created by the author for the public account. Any advertisements at the end of the article and in the comment area are unrelated to the author, so please discern carefully. Thank you for reading.
免责声明:本文章仅代表作者个人观点,不代表本平台的立场和观点。本文章仅供信息分享,不构成对任何人的任何投资建议。用户与作者之间的任何争议,与本平台无关。如网页中刊载的文章或图片涉及侵权,请提供相关的权利证明和身份证明发送邮件到support@aicoin.com,本平台相关工作人员将会进行核查。