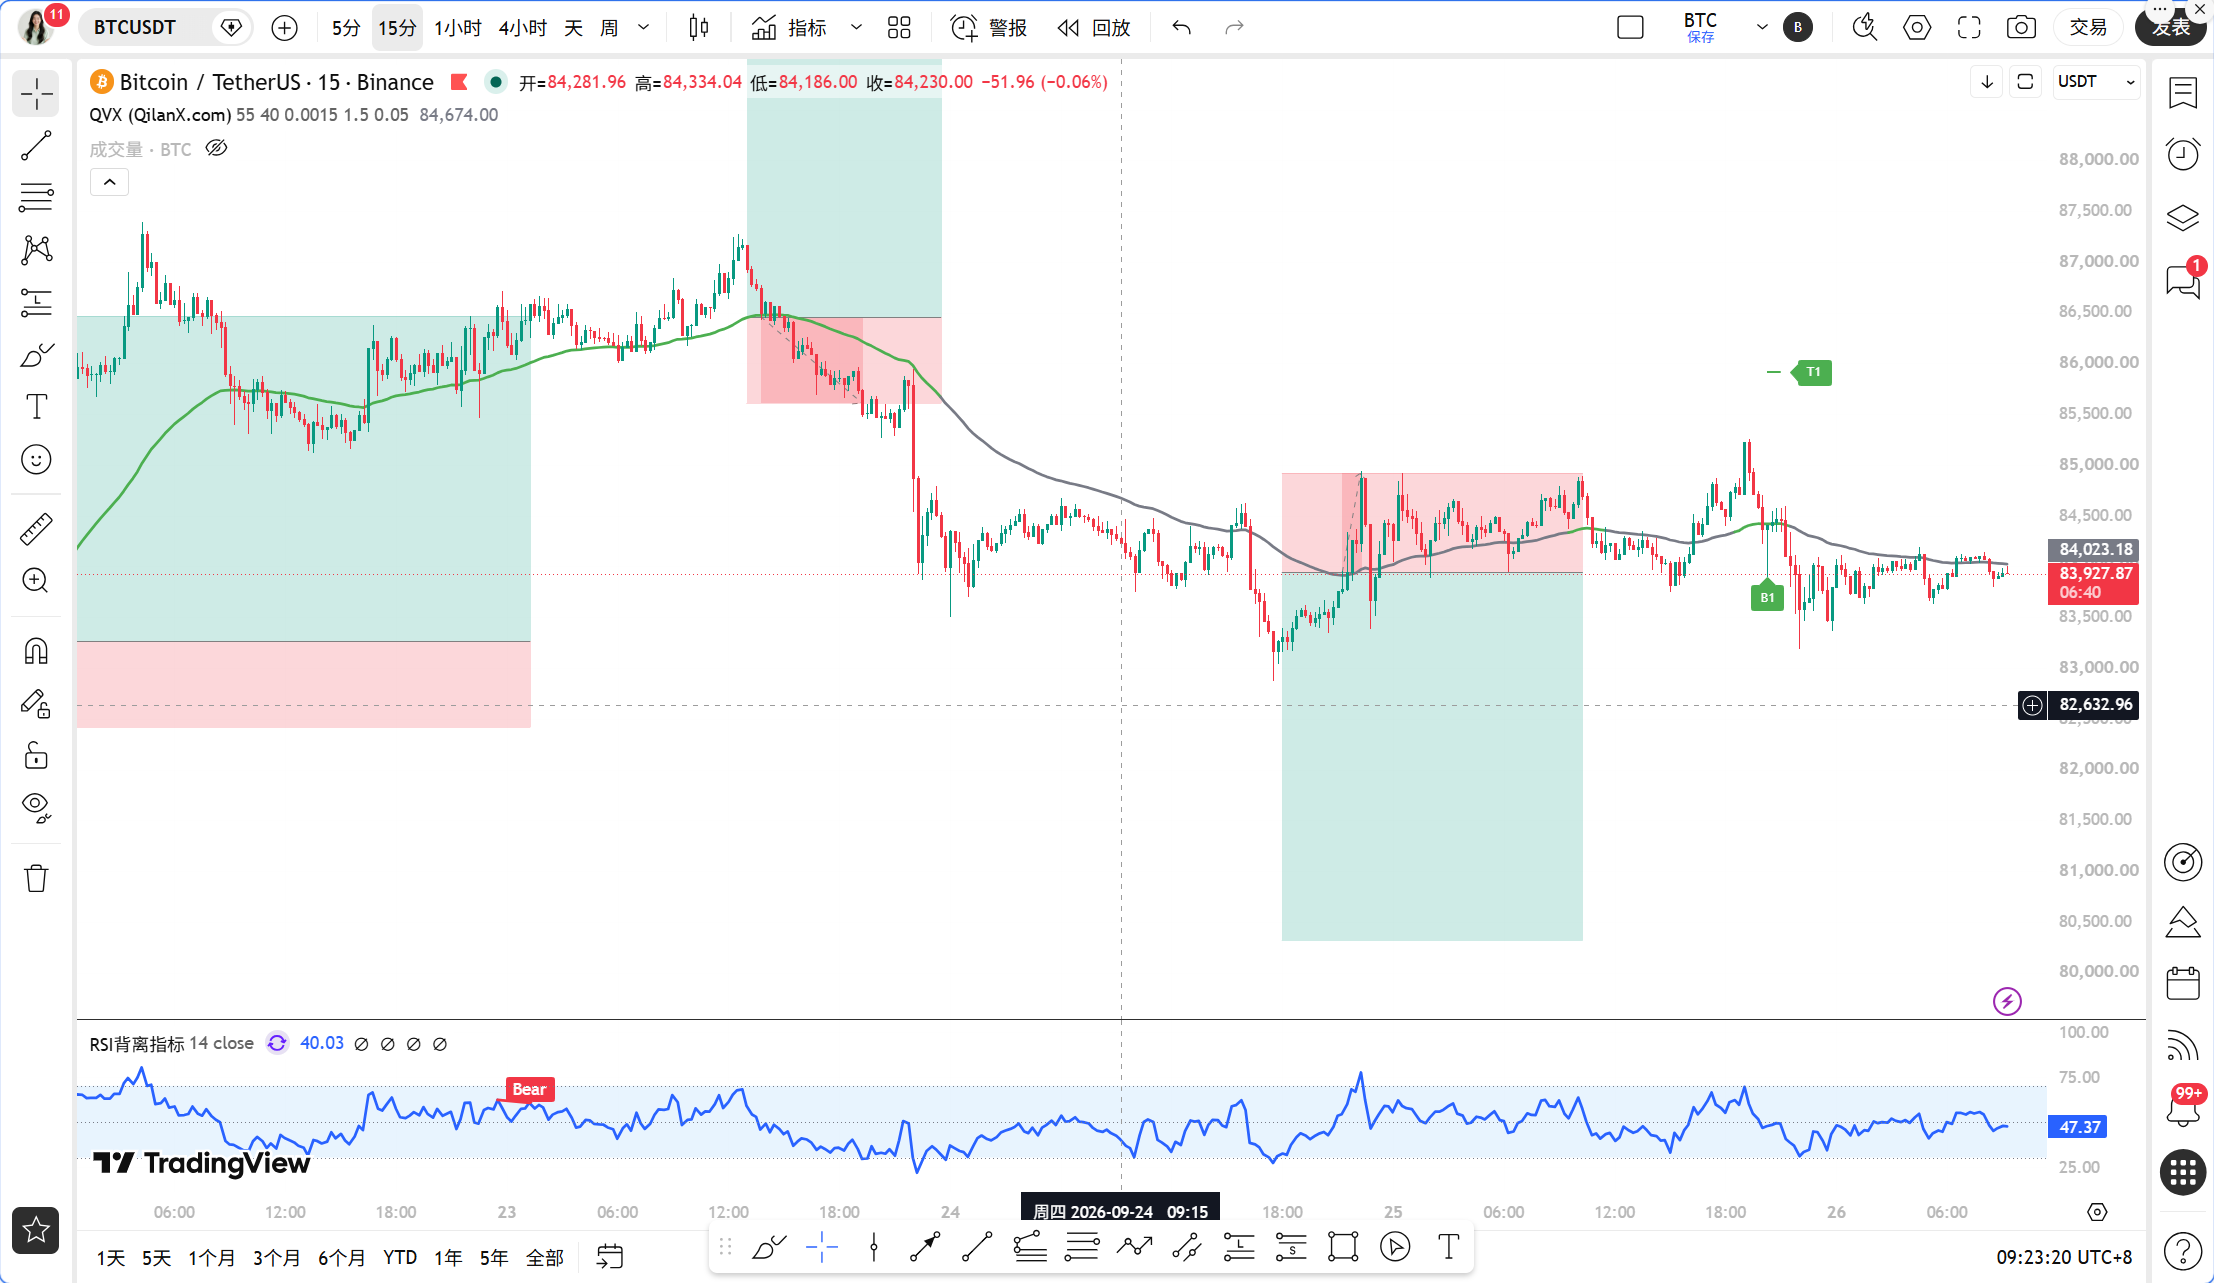
First, let’s discuss two major pieces of news worth paying attention to today. The first is that the U.S. SEC plans to adjust KYC rules, where on-chain tokenized securities may only require a single identity verification. This essentially lowers the compliance threshold, providing a tangible positive sentiment for RWA and DeFi sectors. The second is that Coinbase has launched bitcoin collateral fixed-rate USDC loans, which increases the demand for holding BTC and reduces selling pressure, representing a structural news benefit for BTC in the medium to long term. However, it is important to note that while good news piles up, the U.S. 10-year Treasury yield has skyrocketed to 5.23%, reaching a new high since 2007. The surge in risk-free rates will suppress risk asset valuations, posing a significant macro headwind today.
The current time is September 26, 09:26, with BTC’s latest price quoted at 83953 USDT, a 24-hour change of -0.92%, and a market share of 58.21%. The fear and greed index stands at 74, indicating a state of greed. The combination of a high greed index and stagnant prices suggests a warning about short-term chasing risks.
Let’s first look at the multi-timeframe state. On the daily chart, MA5 is at 84613.83, MA10 is at 82941.80, and MA30 is at 79715.67, with the price of 83953 trapped between MA5 and MA10. The MACD histogram is at 277.31, still positive, and DIF at 2431.88 is above DEA at 2154.57, indicating the daily trend structure has not been broken. The RSI is at 68.40, close to overbought but has not yet entered an extreme zone. On the 4-hour chart, MA5 is at 84090.28, MA10 is at 84196.75, and MA30 is at 84893.11, showing a bearish arrangement. The MACD histogram has turned negative at -219.49, with DIF at 160.97 having dropped below DEA at 380.46, clarifying a correction state on the 4-hour chart, and the RSI is at 44.64, slightly weak neutral. On the 1-hour chart, MA5 is at 83967.56, MA10 is at 83923.92, and MA30 is at 84175.98, with the price tangled around MA5 and MA10. Crucially, EMA55 is at 84368.00, and the current price of 83953 is clearly below this level. The MACD has just completed a golden cross, with DIF moving from -96.21 above DEA at -98.15, and the histogram value is at 1.94. RSI is at 34.80, showing a slight recovery from lower levels. On the 15-minute chart, MA5 is at 83925.66, MA10 is at 84003.93, and MA30 is at 83971.17, where the three lines are converging. The MACD histogram is at -6.32, with DIF at -4.04 below DEA at 2.28, and RSI at 60.95, indicating a short-term sideways movement.
Now let’s validate signals using the TPV system. First, the EMA55 condition. The current price of 83953 is below the 1-hour EMA55 at 84368. The past 8 hourly candle close prices have been above EMA55 0 times, with 0 crossings, and the price’s absolute deviation from EMA55 is at 0.49%. According to TPV rules, the price is under pressure below the 1-hour EMA55 and continuously meets this condition, which determines it as a bearish trend area. Second, the pattern condition. Currently, there are no clear long upper wicks or top formations on the 1-hour level, but the price has repeatedly attempted to rebound only to be suppressed near 84368, indicating a structure of hitting an effective high point and retreating. Third, the momentum condition. The 1-hour MACD has just completed a golden cross, with the histogram turning positive but only at 1.94. RSI is recovering from a low of 34.80, which signals a reduction in bearish momentum rather than a weak bounce. Here, there’s a contradiction: the trend positioning is bearish, but momentum indicators are recovering. According to the strict standards of the TPV system, shorting requires all three conditions to be satisfied, and currently, the momentum condition does not meet the shorting requirements, so active shorting is not recommended. Simultaneously, going long requires the price to close above EMA55 for two consecutive hourly candles, which is not currently met, hence active longing is also not recommended. In terms of oscillation judgment, the past 8 hourly close prices have had 0 instances above EMA55, with 0 crossings, failing to meet the oscillation threshold. The system determines that a unidirectional trend may be occurring, but the momentum contradiction suggests doubts about the sustainability of this unidirectional trend.
On-chain and financial perspectives show that the fear and greed index at 74 indicates that market sentiment remains greedy; however, the 24-hour slight decline of 0.92% in BTC shows that the greedy sentiment has not translated into buying. The market share of 58.21% is relatively high, and there are no significant signs of capital flowing out of BTC to altcoins. A critical piece of news indicates that long-term Bitcoin holders only have a profit of 72%, which is far below previous highs. This means long-term holders have not significantly cashed out, limiting selling pressure. Another signal is that a whale has increased their BTC long position to $98.15 million, with Hyperliquid ranking third, using 40x leverage for long positions. This is a clear bullish signal, but high-leverage long positions are also a double-edged sword; if the price falls below key support, it could trigger a chain liquidation. Regarding options expiration, the $1.56 billion in BTC options expiration has triggered a short-term pullback, which is one direct reason for today’s price pressure.
Key attack and defense levels must be remembered clearly. The first resistance above is the 1-hour EMA55 at 84368, which serves as the TPV system’s boundary between long and short. The price must close above this level for two consecutive hourly candles to confirm the return of the bullish trend. The second resistance above is the 4-hour MA30 at 84893, which is the last line of defense against the bearish arrangement of the 4-hour moving averages. The first support below is the daily MA10 at 82941, which has about 1000 USDT of space relative to the current price. The second support below is the daily MA30 at 79715, which is the lifeline of the medium-term trend. The current price of 83953 is just below the 1-hour EMA55 by about 415 USDT, indicating a pressured state with the window for potential price change narrowing.
Trading thoughts. Direction assessment: The TPV system indicates the current area is a bearish trend, but the momentum indicators are showing signs of recovery. This indicates a stage of momentum divergence within the bearish trend. Therefore, we will not actively short or long, but wait for signal confirmation. Long entry conditions: It requires two consecutive hourly candle close prices to be above 84368, and during the closing of the second candle, the MACD histogram must continue to expand, with RSI rising above 40. The entry point will be set with orders above 84368, and stop loss placed below 83900, with a first target of 84893 and a second target of 85500. Short entry conditions: If the price rebounds near 84368 and shows a clear long upper wick or top formation, and the 1-hour MACD histogram shortens while RSI retreats from a high position, a light position can be taken short below 84368, with stop loss above 84600, with a first target of 83500 and a second target of 82941. The current price of 83953 is in the middle zone, having met neither the long nor the short conditions, making the optimal strategy to stand by waiting for clear signal confirmation before acting. Oscillation range reference: If the price repeatedly crosses between 83500 and 84368, it should be treated as oscillation, taking shorts at the upper limit and longs at the lower limit, but with light positions.
Risk warning in one sentence: The SEC's favorable news and whale long positions are supportive from a sentiment perspective, but the macro suppression from the 10-year U.S. Treasury yield at 5.23% and the selling pressure from options expiration still exists. Until 84368 is breached, any bounce should be treated as a retracement.
Follow Qinglan Crypto Classroom to better seize more trading opportunities! Welcome to visit our official website www.qinglan.org
📊 Qinglan TPV Trading Strategy Backtest Reference
🕒 Last backtest time 09-26 07:00:02
Total analysis: 4138 Backtest: 4138 Accuracy: 78.6% (3251/4138)
免责声明:本文章仅代表作者个人观点,不代表本平台的立场和观点。本文章仅供信息分享,不构成对任何人的任何投资建议。用户与作者之间的任何争议,与本平台无关。如网页中刊载的文章或图片涉及侵权,请提供相关的权利证明和身份证明发送邮件到support@aicoin.com,本平台相关工作人员将会进行核查。