Cryptocurrency Academy: On September 26, the Ethereum (ETH) large cycle bullish framework remains intact; how to respond to short-term corrective trends? Latest market analysis reference
The current price of Ethereum is 2670. The most grueling aspect of trading contracts is not the drastic market fluctuations but rather the indecisive oscillations. Many people can't stand the silence and frequently open positions, getting swept away in losses. When the trend is good, hold onto your positions to earn profits; during oscillation phases, reduce your position size and take fewer actions. Don't fantasize about capturing every segment of the market; stick to your trading rules, manage your stop-loss effectively, and surviving is always more important than getting rich overnight.
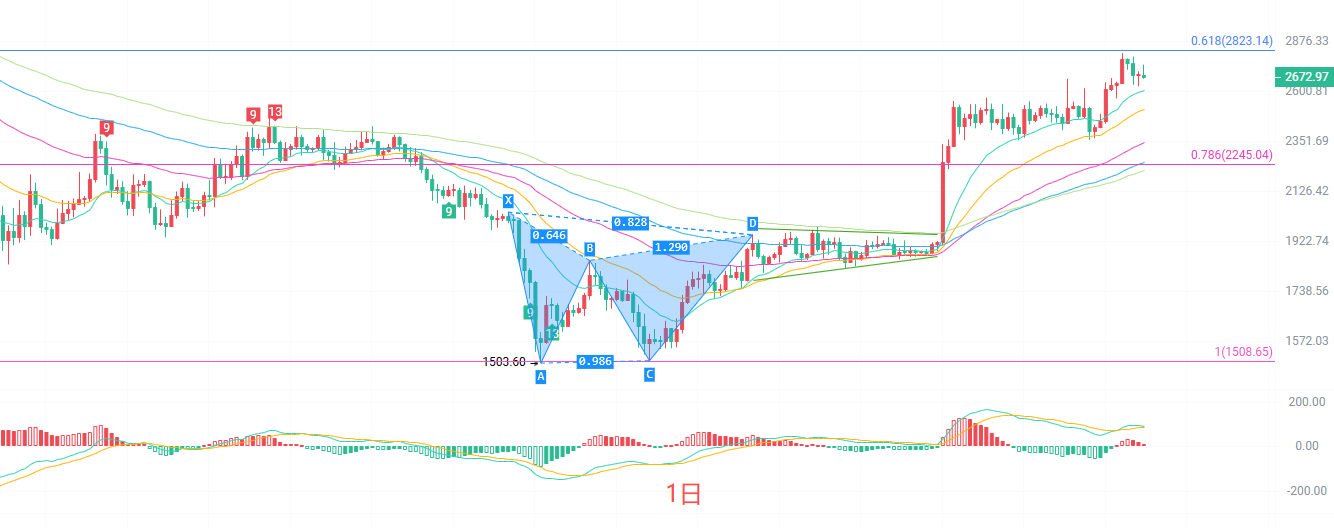
The daily candlestick chart is steadily operating above the moving average group, and the mid-term trend has not been broken. The Bollinger Bands are opening upward, with the upper band at 2782 forming strong resistance and the lower band at 2332 serving as mid to long-term support. The MACD indicator shows that the red bars are continuously shrinking, with DIF and DEA still above the zero axis; bullish momentum is weakening, indicating a high-level stagnation signal. Currently, there are no clear reversal signals on the daily level, but the upward momentum is weak, and it is highly probable to enter a high-level oscillation consolidation. To challenge the previous high again in the short term, it needs to stabilize above 2740; otherwise, it is likely to pull back to the moving averages for digestion and adjustment.
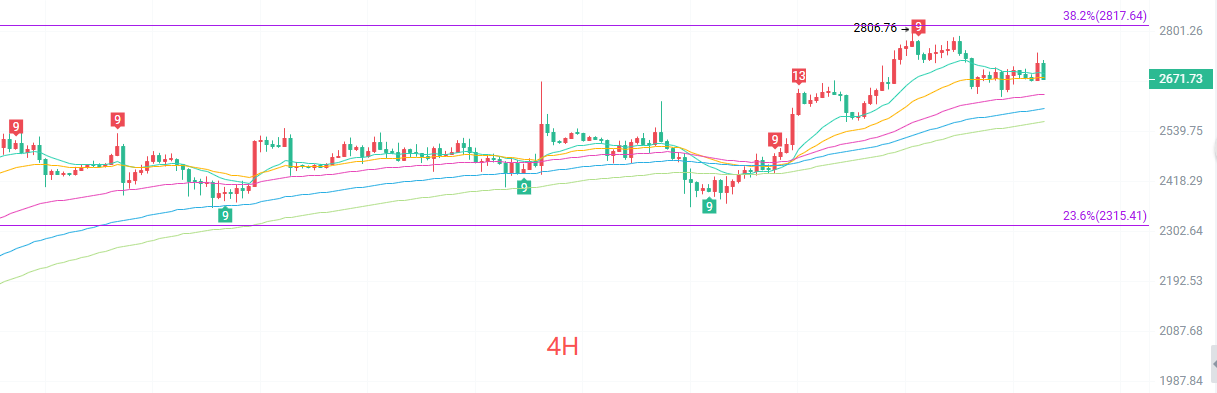
In the four-hour candlestick chart, the short-term price is finding support near the EMA15 and EMA30 moving averages. The current middle band of the Bollinger Bands is at 2703, the upper band at 2774, and the lower band at 2632. The price is operating below the middle band, transitioning from strong to weak in the short term. The MACD double lines have turned downward, with green bars continuously increasing, indicating that short-term bearish strength is being released. The high point of 2806 in the four-hour level corresponds to the peak of this uptrend. After the price retraced from the high, the peaks are gradually declining, and the short-term is entering a corrective repair phase. As long as it does not effectively break below the lower band at 2632, the overall structure still belongs to a correction after an uptrend and will not directly turn into a bear market.
Short-term reference:
If breaking up above 2650 to 2610, stop-loss at 40 points, target at 2720 to 2760.
If not breaking down below 2750 to 2770, stop-loss at 40 points, target at 2700 to 2660.
Specific operations should be based on real-time market data. For more information, feel free to consult the author. There may be a delay in the publication of this article; it is suggested for reference only and the risk is self-borne.

Warm reminder: The above content is created solely by the author's public account. The ads at the end of the article and in the comment section are unrelated to the author. Please be cautious and discerning. Thank you for reading.
免责声明:本文章仅代表作者个人观点,不代表本平台的立场和观点。本文章仅供信息分享,不构成对任何人的任何投资建议。用户与作者之间的任何争议,与本平台无关。如网页中刊载的文章或图片涉及侵权,请提供相关的权利证明和身份证明发送邮件到support@aicoin.com,本平台相关工作人员将会进行核查。