Crypto Circle Academician: After the main funds liquidated on 9.26 for Bitcoin (BTC), how to distinguish between true and false support during retracements? Latest market analysis and trading advice interpretation
The current price of Bitcoin is 84,400. The signals in the market have been changing continuously, but human greed and fear remain unchanged. This wave of ups and downs has washed out a group of late entrants. Do not always think about capturing every market wave; there are many opportunities, but the capital is limited. Wait for opportunities that align with your trading system before taking action; if you do not understand the market, observe from the sidelines. Trading is not about who makes more trades, but about who can preserve their capital.
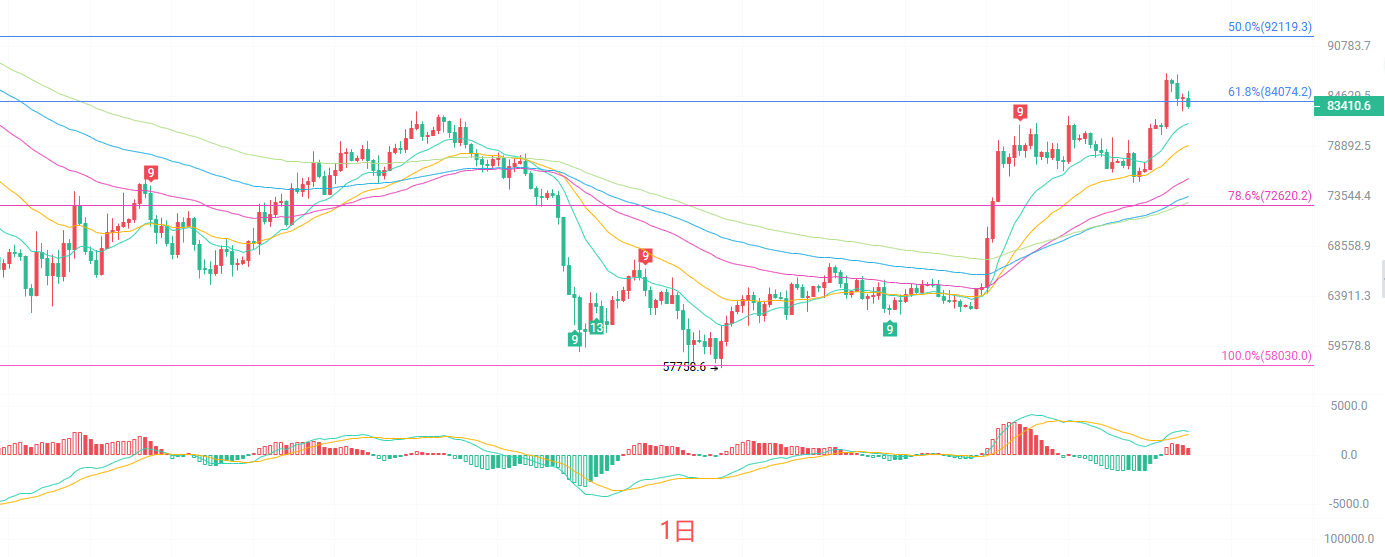
On the daily K-line moving average system, EMA15 and EMA30 are still arranged upward, with a solid medium to long-term bullish structure; EMA60, EMA90, and EMA120 form a strong support band below. The MACD indicator shows a continuous shortening of the red bars, and the DIF has turned downward, indicating a decrease in bullish momentum. In terms of the Bollinger Bands, the price touched the upper band and then retreated, currently running above the middle band, belonging to a pullback after an uptrend. The daily level is temporarily defined as a high-level consolidation without showing trend reversal signals, with key support seen around 81,500. If this level effectively breaks, it will further open deeper retracement space.
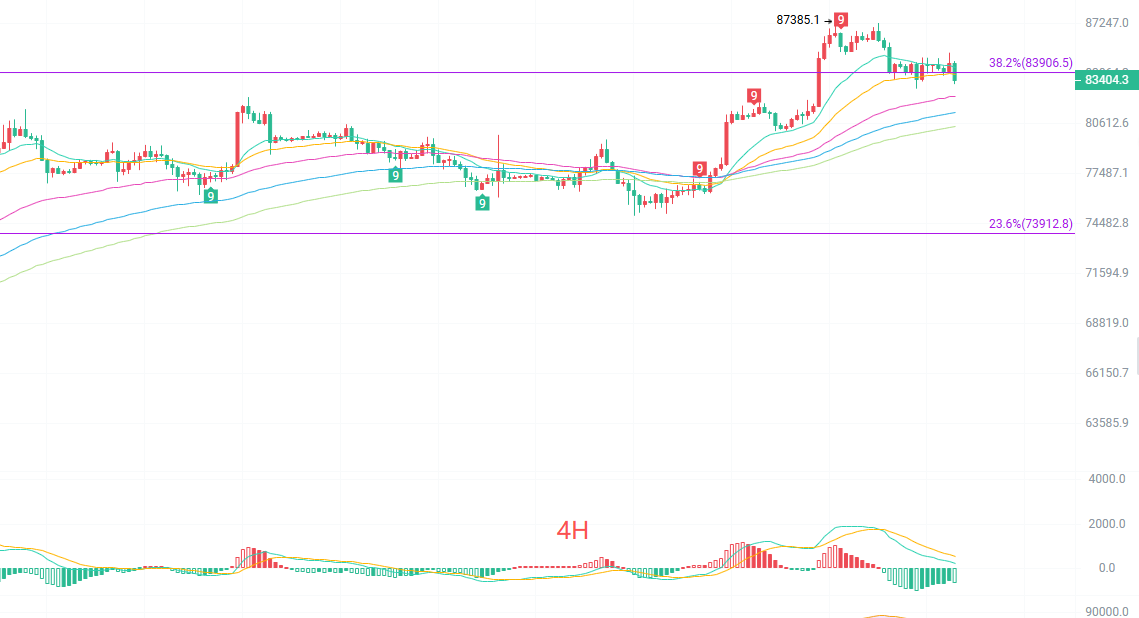
The four-hour K-line has continuously closed in the negative, with short-term bearish forces being released. The EMA15 has turned downward, forming pressure on the short-term averages, while EMA30 provides support around 82,400. The MACD dual lines have crossed downward, and green bars are continuously increasing, indicating a dominance of short-term bearishness. The Bollinger Bands' opening is gradually narrowing, with prices retreating from the upper band and currently contesting around the middle band. This belongs to a clear short-term retracement structure, with upper pressure at 85,200; if a rebound cannot break this position, the market will likely continue to dive further; if it stabilizes above 85,200, it is expected to challenge the previous high again.
Short-term reference
Targeting a rise from 82,200 to 81,800, with a stop loss of 500 points, aiming for 84,800 to 85,200
Targeting a drop from 84,800 to 85,200, with a stop loss of 500 points, aiming for 84,000 to 83,500
Specific operations should be based on real-time data; for more information, you can consult the author. There may be delays in the publication of the article, and it is suggested that this be for reference only, with risks assumed by the reader.

Warm tip: The above content is solely created by the author of the public account, and advertisements at the end of the article and in the comment section are unrelated to the author. Please exercise caution in distinguishing, thank you for reading.
免责声明:本文章仅代表作者个人观点,不代表本平台的立场和观点。本文章仅供信息分享,不构成对任何人的任何投资建议。用户与作者之间的任何争议,与本平台无关。如网页中刊载的文章或图片涉及侵权,请提供相关的权利证明和身份证明发送邮件到support@aicoin.com,本平台相关工作人员将会进行核查。