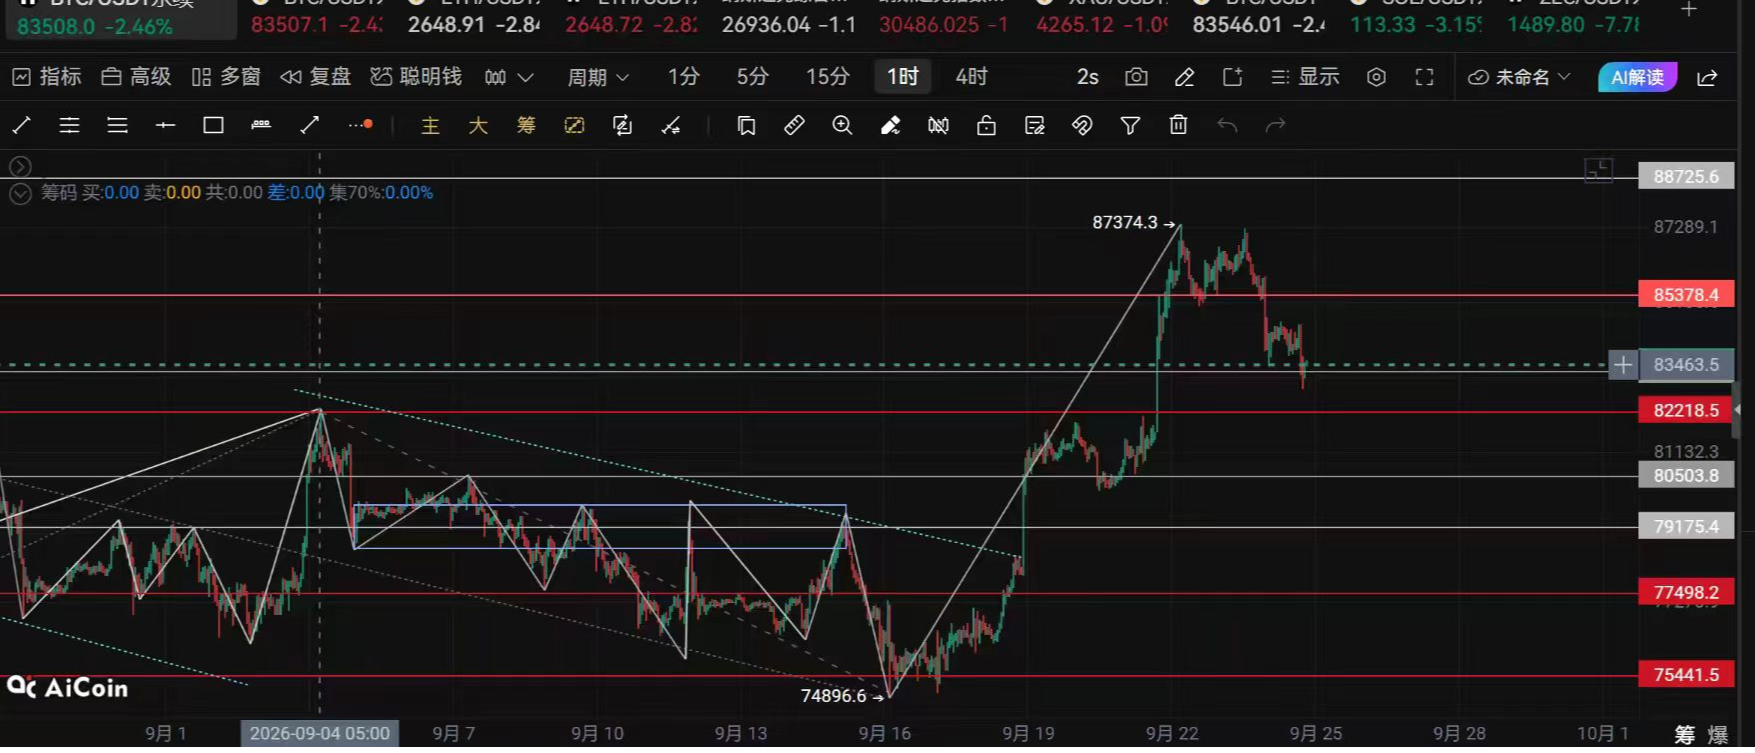
Crypto Academic: On September 25, the bullish background of Bitcoin (BTC) in the big cycle has not broken, what is the essence analysis of the short-term adjustment? Latest market analysis and operation suggestion analysis
The current price of Bitcoin is 84,400. Is it gathering strength to attack or is it a trap for selling? As the market approaches 84,000, the divergence within the market has become clearly larger. Those who are bullish believe this is just a normal pullback in the upward trend and new highs will come soon; while bearish funds feel that the top signal has appeared and a wave of deep retracement could come at any time. Trading at high positions should not rely solely on feelings; one must learn to rely on structures and indicators to judge opportunities,
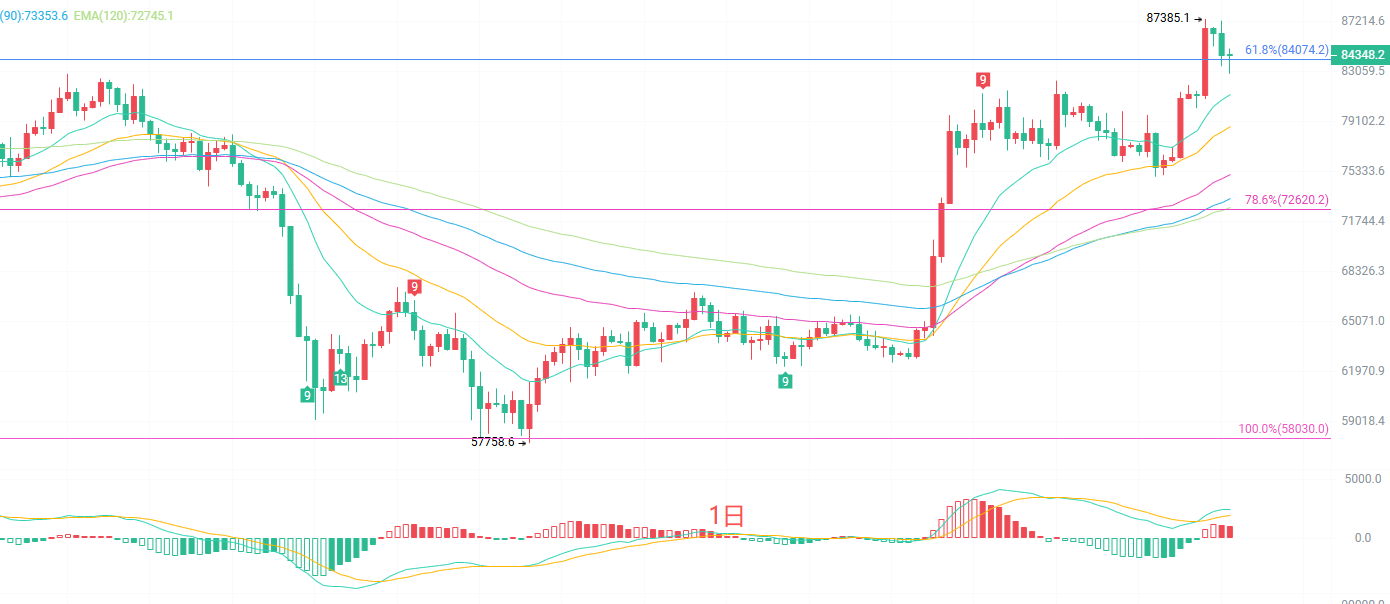
The daily K-line moving average system maintains a bullish arrangement. The EMA15 and EMA30 form support below the price, and the medium to long-term upward trend has not been broken. The upper Bollinger Band is at 86,290, and the price is under pressure and fell back near the upper band; currently, it is oscillating in the middle and upper band range of the Bollinger Band. The MACD indicator's DIF is still above the DEA, with the red bar slightly shrinking, indicating a momentum decay signal in the bullish market, not a direct reversal. No large bearish candlestick has broken below on the daily chart; the overall trend still leans bullish, but the short-term is under pressure from above. It's highly likely that it will maintain high-level oscillations to digest profit margins and wait for indicators to recover before choosing a direction.
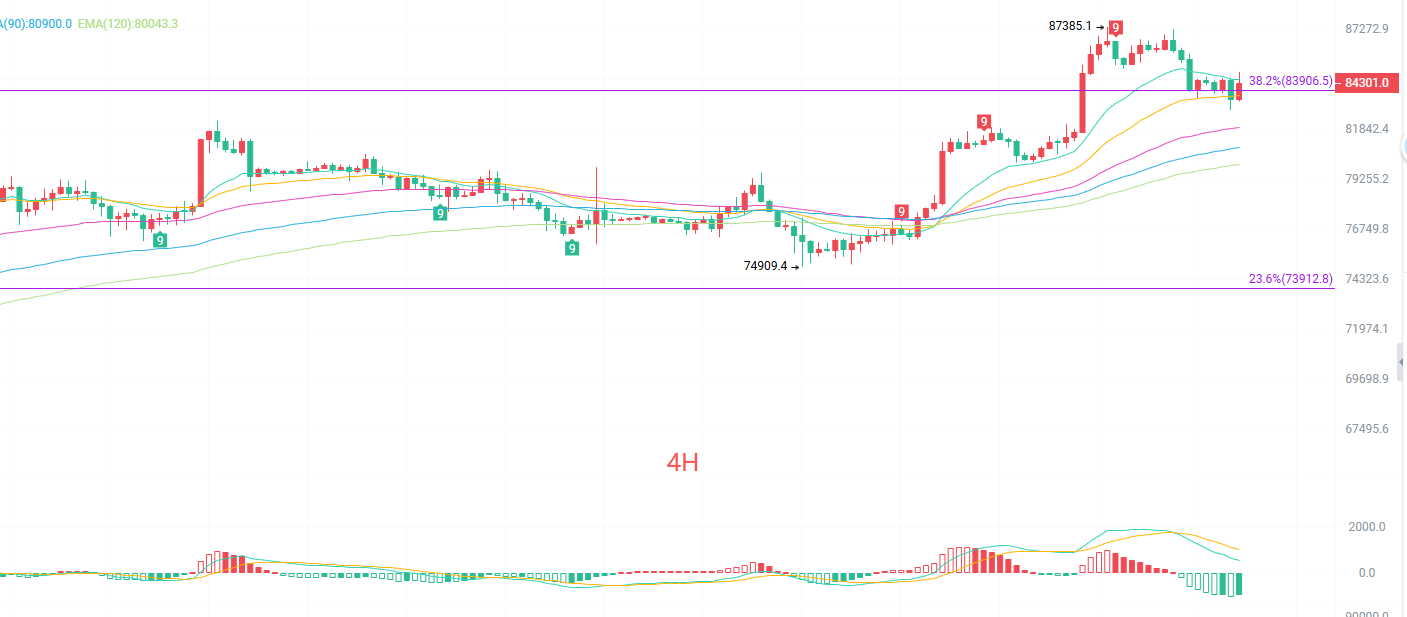
The four-hour K-line has formed a shape of high movement followed by a pullback. The short-term EMA15 moving average has been broken by the price, and the short-term bullish strength has weakened. The Bollinger Band is currently narrowing, with the upper band at 87,316 and the lower band at 83,350, and the price is competing near the middle of the Bollinger Band. The MACD indicator has formed a dead cross at a high position, with green bars continuously expanding, indicating a return to a corrective recovery market. However, several medium to long-term EMA moving averages below are still trending upwards, with a support band around 83,300. As long as this support is not effectively broken, it is merely a secondary adjustment in the upward process, and the large structure of the bullish pattern has not been completely destroyed.
Short-term reference
Buy from 83,500 to 83,000 with a stop loss of 500 points, aiming for 85,500 to the previous high.
Sell from 85,800 to 86,300 with a stop loss of 500 points, aiming for 85,000 to 84,000.
Specific operations should mainly refer to real-time data on the market. For more information and details, you can consult the author. The publication of the article has a delay, and the suggestions are for reference only; the risk is to be borne by oneself.

Warm reminder: The above content is solely created by the author of the public account. The advertisements at the end of the article and in the comments section are unrelated to the author. Please discern carefully, and thank you for reading.
免责声明:本文章仅代表作者个人观点,不代表本平台的立场和观点。本文章仅供信息分享,不构成对任何人的任何投资建议。用户与作者之间的任何争议,与本平台无关。如网页中刊载的文章或图片涉及侵权,请提供相关的权利证明和身份证明发送邮件到support@aicoin.com,本平台相关工作人员将会进行核查。