Crypto Circle Scholar: On September 24, do not be deceived by the illusion of the bull market regarding Bitcoin (BTC); a deep analysis of the pullback structure after this round of increases? Latest market analysis and operational advice breakdown
The current price of Bitcoin is 84400, hesitant to take such a good opportunity for a pullback? What is most feared in a bull market is not the major fluctuations but the lack of a trading framework; when prices rise, one imagines reaching 100,000, and when prices fall, one thinks the bull market has ended. The current market is a typical profit-taking scenario after a spike; it is neither a one-sided reversal nor a mindless rally. In the crypto bull market, sharp declines are the norm
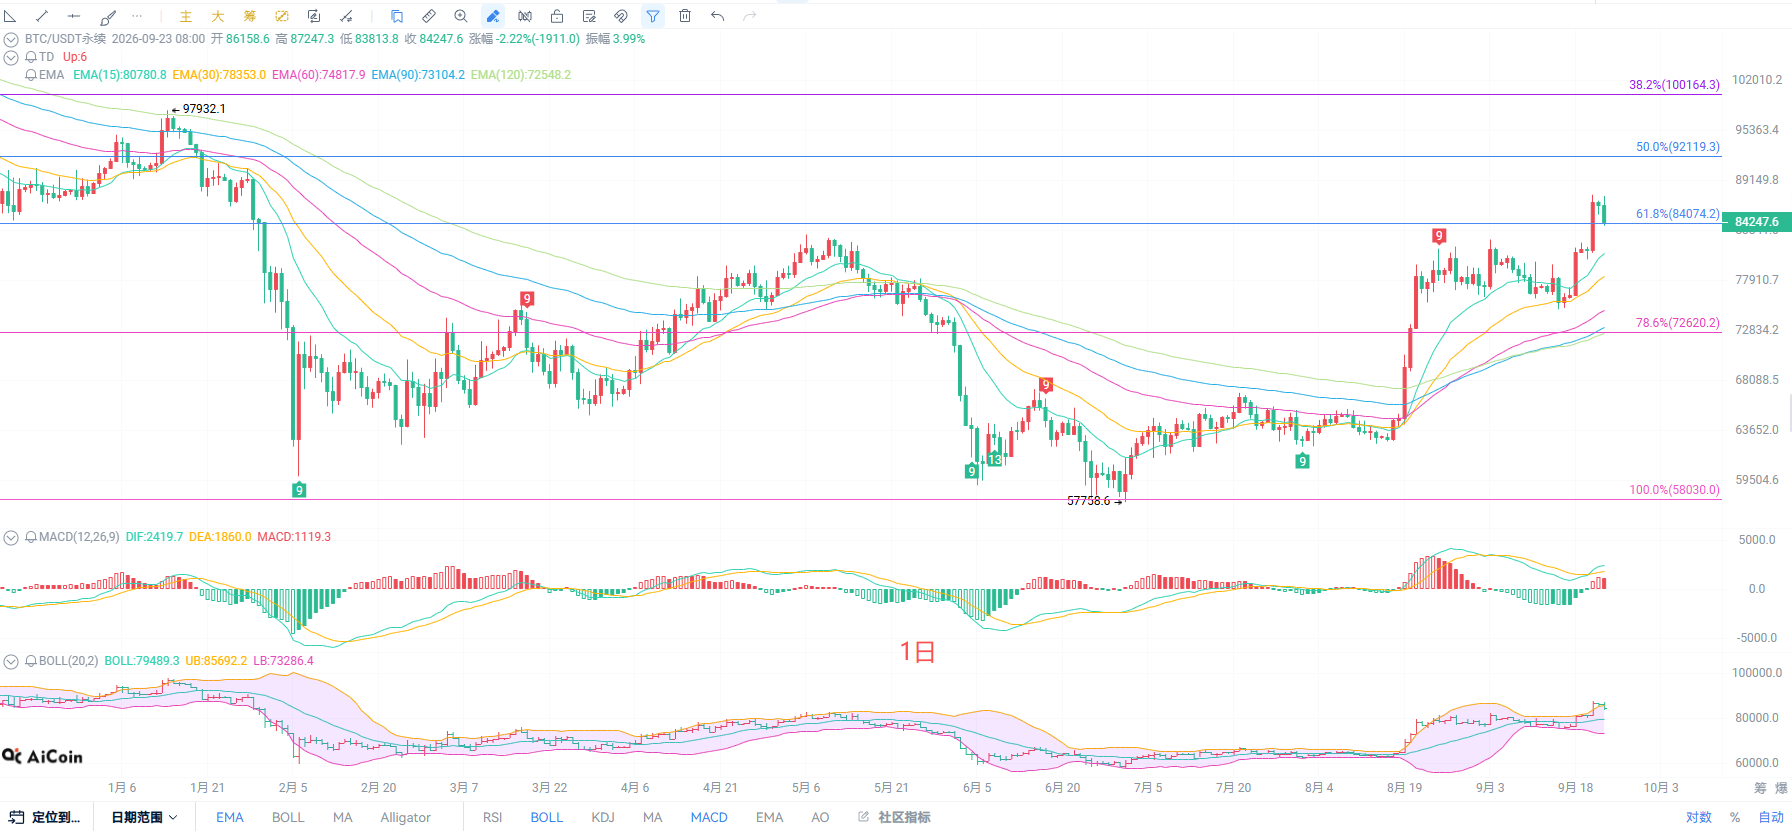
The daily K-line's current price is exactly around this critical position. The moving average system is still in a bullish arrangement, with the short-term EMA15 still providing support below the price. However, the MACD red bars are noticeably shrinking, indicating a decay in bullish momentum. The upper Bollinger Band at 85733 has been pierced by the price and then retraced, indicating heavy selling pressure above. The daily K-level has not yet turned bearish; it is in a high-level pullback after a significant increase, with the key support below at EMA30 and the 78.6% Fibonacci level of 72620. The short-term market has entered a phase of bullish and bearish struggle; if the bulls want to continue to make new highs, they must re-establish themselves above 86000
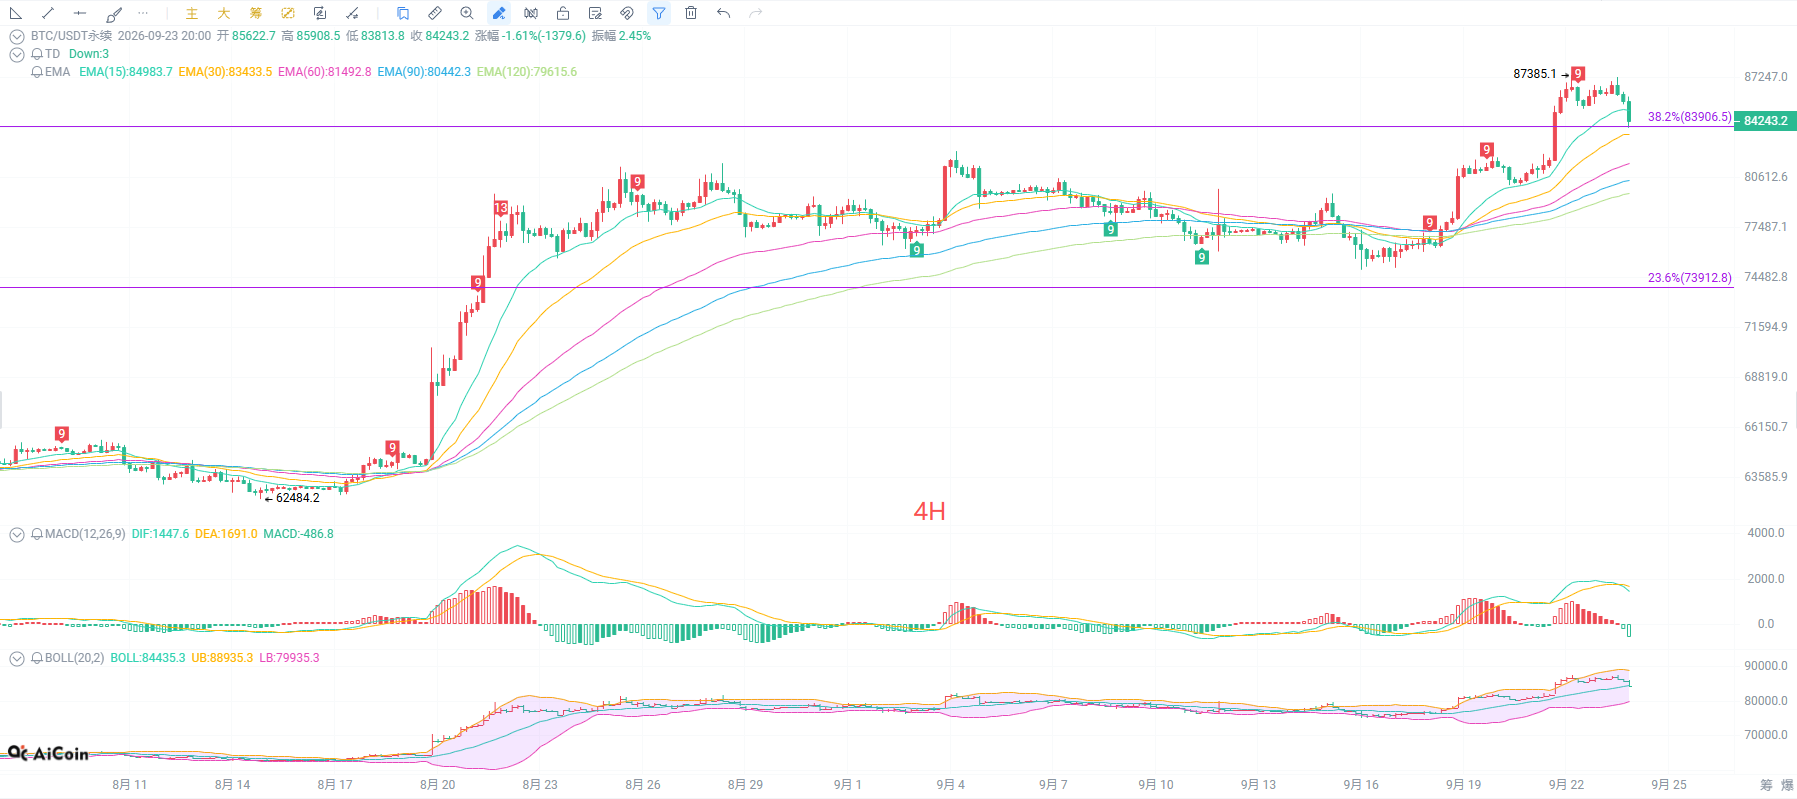
The MACD on the four-hour K-line has formed a death cross, and the green bars are continuously expanding, indicating short-term bearish forces are being released. The Fibonacci 38.2% support at 83906 is currently the first support level. The price has already fallen below the middle line of the Bollinger Bands; the middle line is at 84447, and the current price is contending near this middle line. The short-term EMA15 moving average is turning downward, creating short-term pressure. The four-hour trend has changed from strong to weak, belonging to a high-level pullback structure. If the support at 83906 is broken, it will further test the 23.6% position at 73912. Do not rush to bottom-fish in the short term; wait for stabilization signals
Short-term reference
For the lower range of 84200 to 83900 going up, stop loss 500 points, target 85500 to 86000
For the upper range of 85800 to 86000 stagnating and going down, stop loss 500 points, target 84000
Specific operations should primarily rely on real-time data from the market; for more details and inquiries, you can contact the author. There may be delays in article publication; it is advised for reference only and risk is borne by the reader

Friendly reminder: The above content is solely created by the author on the public account; advertisements at the end of the article and in the comments section are unrelated to the author. Please be cautious in discerning, thank you for reading
免责声明:本文章仅代表作者个人观点,不代表本平台的立场和观点。本文章仅供信息分享,不构成对任何人的任何投资建议。用户与作者之间的任何争议,与本平台无关。如网页中刊载的文章或图片涉及侵权,请提供相关的权利证明和身份证明发送邮件到support@aicoin.com,本平台相关工作人员将会进行核查。