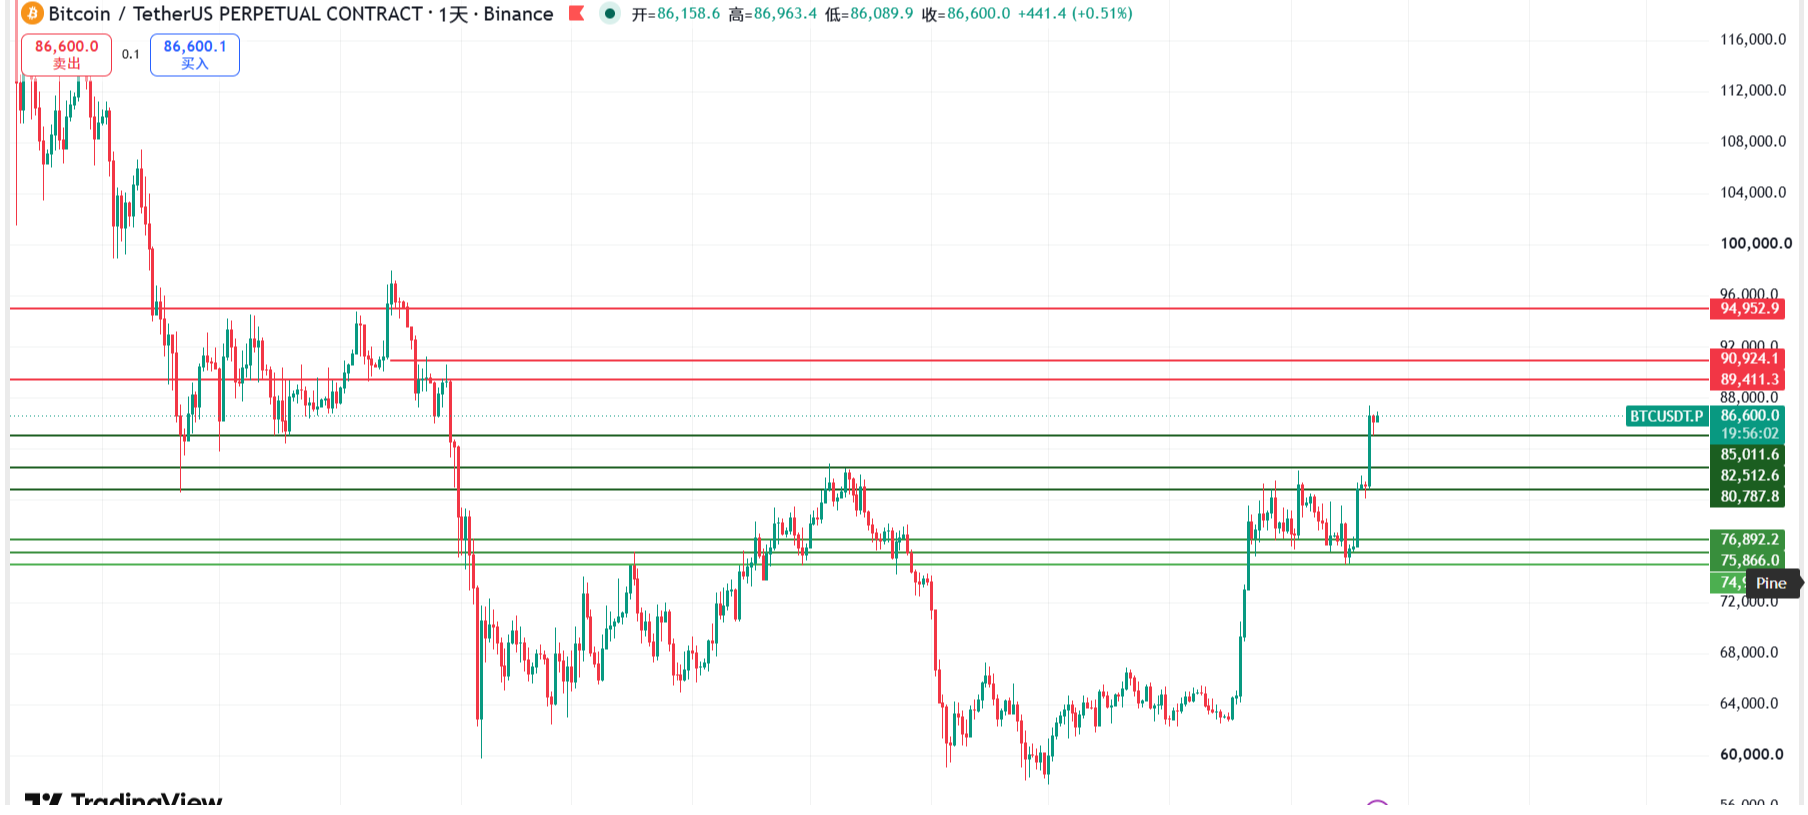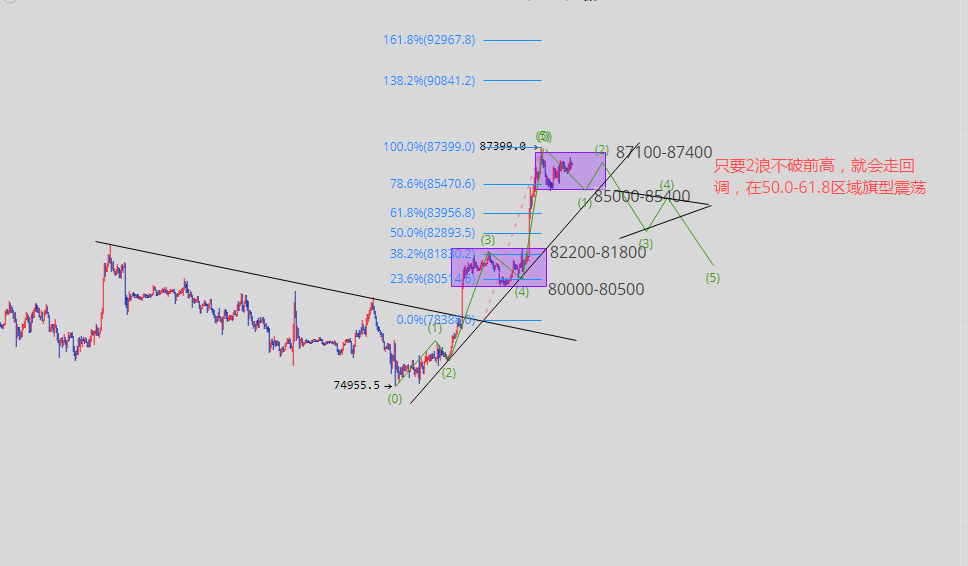
Dear teammates, today there are two pieces of news that must be mentioned upfront. The first piece is that the BIT associated address has again transferred 1000 BTC to Binance, worth about 81.06 million USD. This is not the first time, and continuous deposits to exchanges usually indicate potential selling intentions, leading to heightened concerns about short-term selling pressure. The second piece is that Huang Licheng continues to increase his positions in ETH, BTC, and HYPE, with total holdings reaching 131 million USD. On one side, the large whales are transferring assets to the exchange, while on the other side, big players continue to leverage and go long, making the tug-of-war between bulls and bears very intense. Additionally, with Binance's security alert regarding the iOS vulnerability that could steal private keys, market sentiment is not calm. Qinglan's judgment is that although the current price is still in the bullish zone, there are signs of overheating and selling pressure that require high vigilance.
Current Price and Time
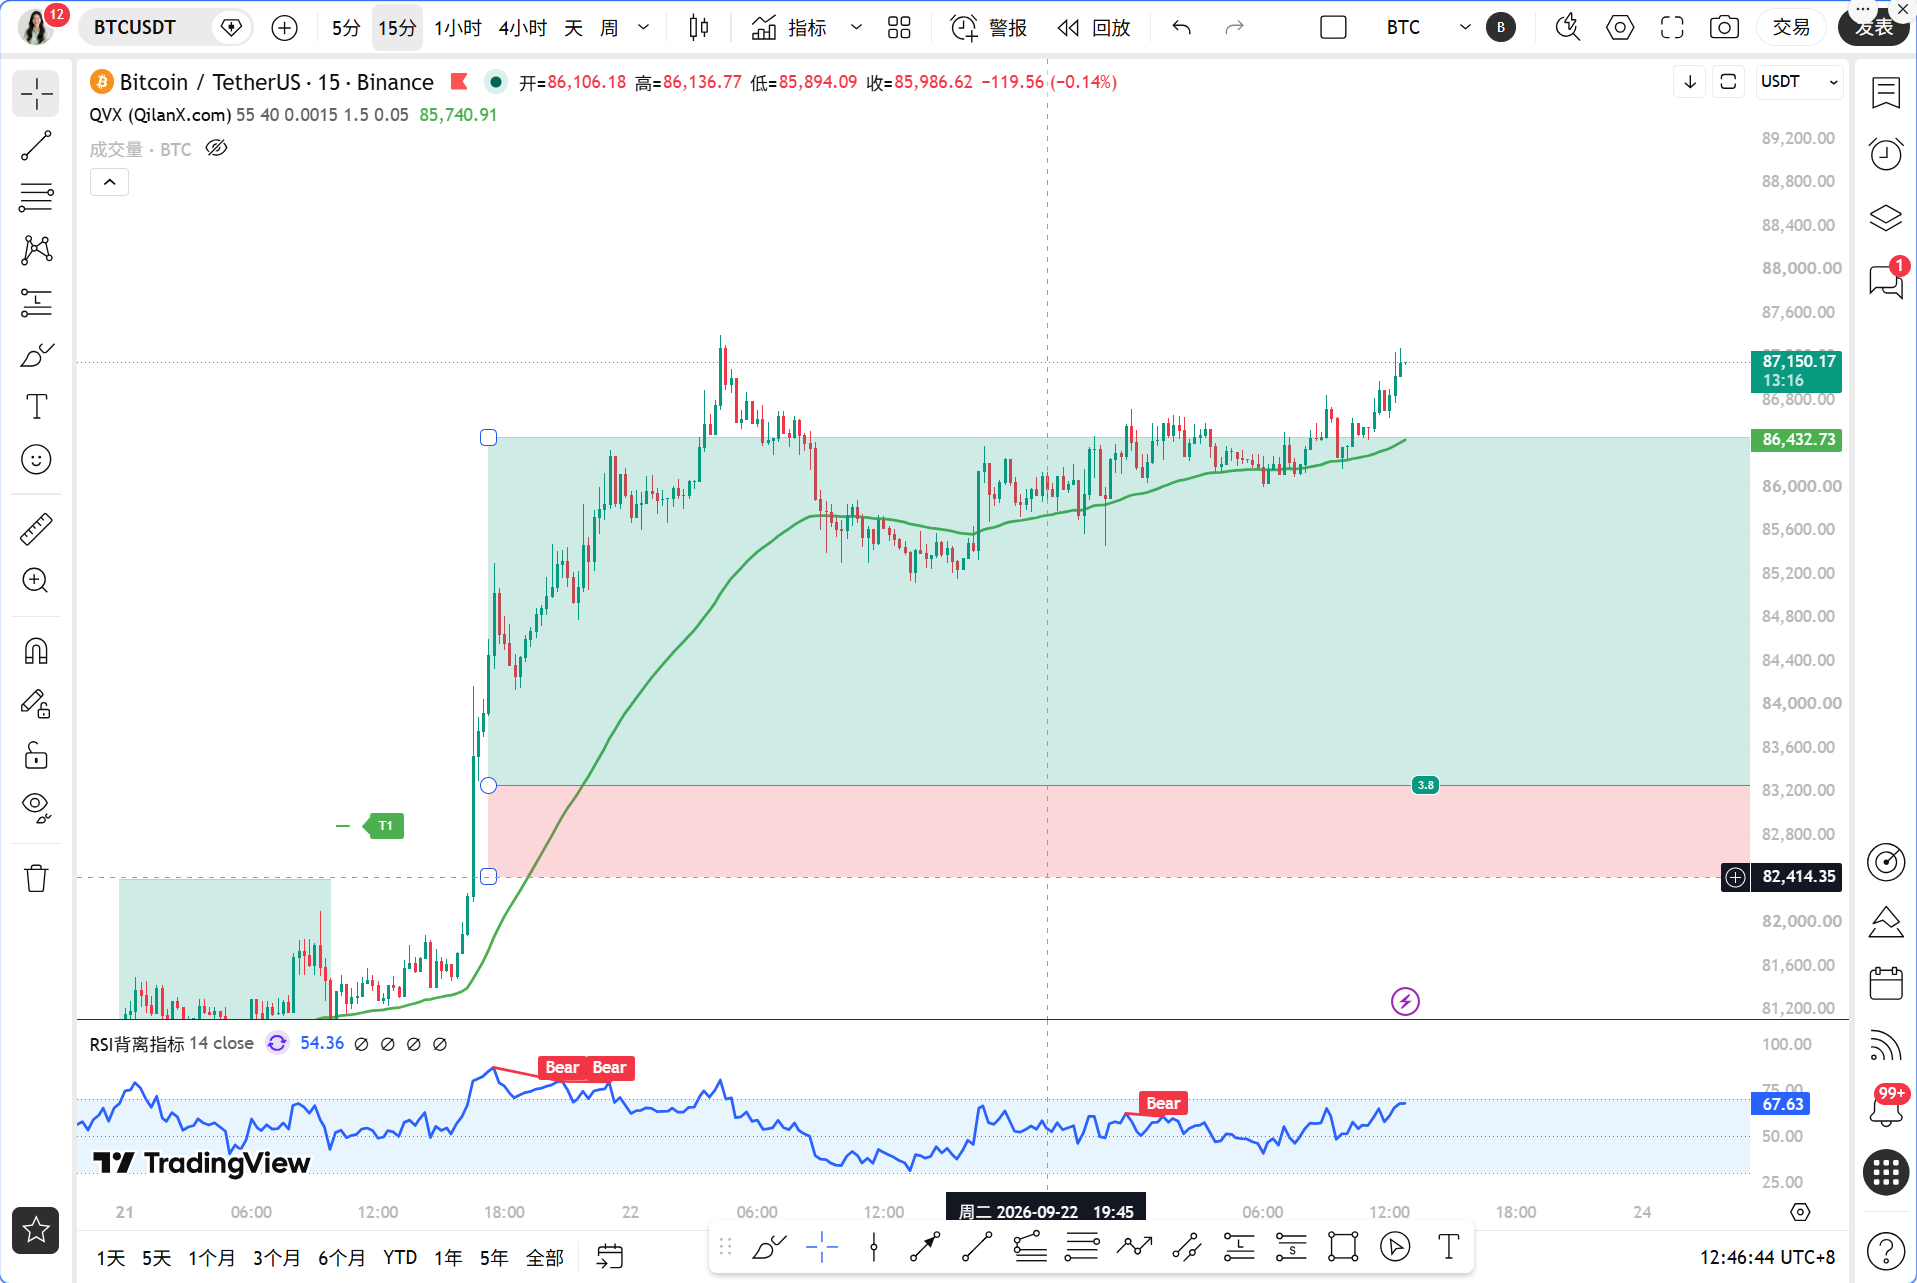
It is now September 23, 12:44, and BTC is priced at 87170 USDT. The 24-hour change is 1.02%, with a market share of 58.76%, and the Fear and Greed Index is 71, indicating a greedy zone. This position is 2.36% away from the 1-hour EMA55 of 85163.62, which is a significant deviation.
Multi-Cycle Status Overview
First, let's look at the daily chart. MA5=84485.26, MA10=80976.69, MA30=79319.72, and the moving averages are in a very standard bullish arrangement. MACD bar value is 745.28, DIF=2649.04 is far above DEA=1903.75, indicating strong bullish momentum. However, the daily RSI has reached 73.00, entering the overbought zone, which means that although the overall direction is upward, the cost-effectiveness of chasing prices is decreasing.
Now let's look at the 4-hour chart. MA5=86537.63, MA10=86282.17, MA30=82999.85, and this is also in a bullish arrangement. MACD bar is 76.87, DIF=1870.24 is greater than DEA=1793.37, indicating maintained momentum. However, the 4-hour RSI has reached 83.34, which is a very clear overbought signal, and the short-term retracement pressure is accumulating.
1-hour level. MA5=86650.72, MA10=86422.66, MA30=86140.03, and the price of 87170 is above all three moving averages. In terms of MACD, DIF=350.05, DEA=350.46, bar value is -0.41, showing a slight death cross signal as the bar value has just turned negative. RSI=71.48 is also at a high level. EMA55=85163.62, and the price is approximately 2006 points above it.
15-minute level. MA5=86924.81, MA10=86749.18, MA30=86456.90, and the short-term moving averages are still in a bullish arrangement. MACD bar is 60.62 positive, DIF=171.86 is greater than DEA=111.24, indicating that short-term momentum remains. RSI=61.70 is relatively healthy, without extreme overbuying.
TPV Signal Verification
According to Qinglan's TPV system core rules, we will verify each condition.
In terms of trend positioning, the current price of 87170 is clearly greater than the 1-hour EMA55 of 85163.62, placing it within the bullish trend zone. In the past 8 1-hour candles, the closing price has been greater than EMA55 8 out of 8 times, and the crossing count is 0, with the price distance from EMA55 being 2.36%, far greater than the 0.3% oscillation threshold. Therefore, this does not conform to the criteria for a sideways market, and the system points to a unilateral bullish trend.
Long conditions verification. The first condition is that the price stabilizes above the 1H EMA55, with two consecutive 1-hour closing prices greater than EMA55, which is satisfied. The second condition is a support stabilization pattern, which currently needs to observe whether the last 1-hour candles show long lower shadows or bottom formation structures. From the 15-minute level, the short term is still trending upward, but the 1-hour level has not yet shown clear signals of a pullback stabilizing. The third condition is that the downward momentum is exhausted, with the 1-hour MACD bar value being -0.41, which has just turned negative; this is not an exhaustion signal, but rather a sign to be wary of weakening momentum. Therefore, among the three conditions, the first is satisfied, the second is pending confirmation, and the third is currently not satisfied. The TPV system currently indicates a bullish trend holding signal, but it is not the best time to open new long positions.
On-chain/Fundamentals
The Fear and Greed Index is 71, in the greedy zone. BTC market share is 58.76%, and funds are still concentrating on BTC. In terms of on-chain news, market behavior in Bitcoin has shifted from panic selling to buying on dips, marking a positive structural change. PlanB states that BTC breaking the 50-week moving average targets 89000, and the BTC gold ratio also breaks above the 50-week moving average, which indicates that these mid-term signals are leaning bullish. However, short-term negatives cannot be ignored, including the BIT associated address transferring 1000 BTC to Binance and the Federal Reserve's interest rate hike expectations suppressing risk asset valuations; these two must be considered within the risk control framework.
Key Attack and Defense Points
The first resistance level above is at 88000 USDT, which is a psychological barrier at an integer point. The second resistance level is at 89000 USDT, corresponding to PlanB's target. The first support level below is at 86650 USDT, which is where the 1-hour MA5 is. The second support level is at 86140 USDT, corresponding to the 1-hour MA30. The core defensive level is at 85163 USDT, which is the 1-hour EMA55. If this position is effectively broken, the TPV system will switch to a bearish trend zone.
Trading Ideas
Direction: The approach is to go long on pullbacks within a bullish trend, not to chase highs.
Entry Conditions: Wait for the price to pull back to the 86600 to 86800 USDT range, while the 1-hour candles show long lower shadows or bottom formation structures, and the 1-hour MACD bar value turns positive again; all three conditions must be met for entry. If the price breaks through 88000 USDT strongly and holds, wait for a confirmation pullback to 88000 to follow with a light position.
Stop Loss: Set strictly below 400 to 500 USDT from the entry point, at 86200 USDT. If the price breaks below the 1-hour EMA55 of 85163 USDT, all long positions must exit.
Target Levels: First target 88000 USDT, second target 89000 USDT. After reaching the first target, it is recommended to reduce the position by half and move the stop loss to the entry point for the remaining position.
Risk Warning
The 4-hour RSI at 83 and daily RSI at 73, both in the overbought condition combined with large whales transferring to the exchange, present significant short-term pullback risks that should not be ignored; position management is always more important than directional judgment.
Follow Qinglan's Crypto Classroom, and let's seize more trading opportunities together! Welcome to visit the official website www.qinglan.org
📊 Qinglan TPV Trading Strategy Backtest Reference
🕒 Last backtest time September 23 07:00:02
Total analysis: 4138 Backtests: 4138 Accuracy: 78.6% (3251/4138)
免责声明:本文章仅代表作者个人观点,不代表本平台的立场和观点。本文章仅供信息分享,不构成对任何人的任何投资建议。用户与作者之间的任何争议,与本平台无关。如网页中刊载的文章或图片涉及侵权,请提供相关的权利证明和身份证明发送邮件到support@aicoin.com,本平台相关工作人员将会进行核查。