1. Latest Financial News
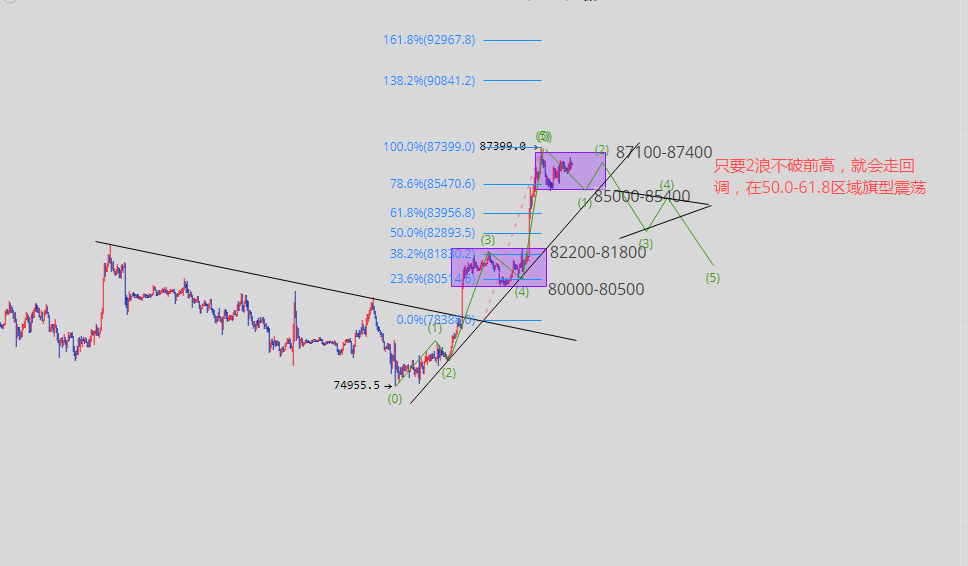
Recently, Federal Reserve officials have spoken cautiously, and the market continues to speculate on the subsequent pace of interest rate cuts. The US dollar index and US Treasury yields have shown slight fluctuations, suppressing the upward momentum of gold prices. Geopolitical risks still provide intermittent safe-haven support, but there is not a strong willingness to chase high prices; the market is waiting for upcoming inflation and employment data to validate the Federal Reserve's policy path. Short-term capital is inclined to wait and see, compressing the volatility range of gold.
2. Market Analysis (Daily Chart)
From the daily chart, it can be seen that gold is currently operating within an ascending triangle channel, and the overall large-scale structure remains the previous fluctuation structure. Yesterday, the daily line closed with a small bearish candlestick, opening at 4357.62, hitting a high of 4369.25, a low of 4346.35, and closing at 4346.58, with a slight decrease of 11.73, down 0.27%, indicating a stalemate between bulls and bears.
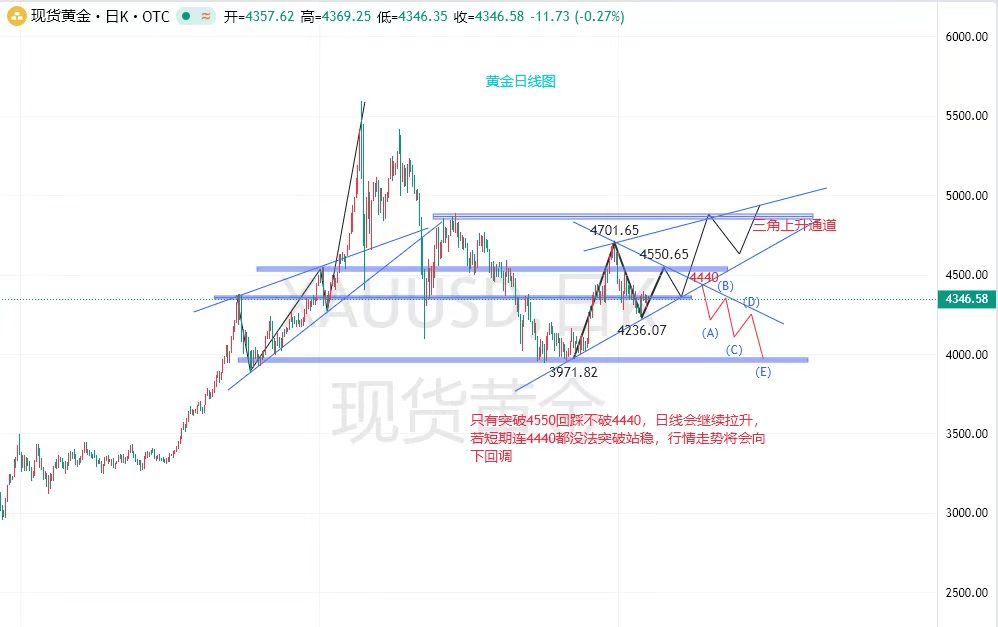
The key points in the chart are clear: the short-term core pressure above is at 4440, with stronger resistance at 4550; the important support below is at 4236.07, with deeper support looking at 3971.82.
Market Logic: For the market to restart a new round of rally, it needs to break above 4550, and hold 4440 during a pullback to open up upward space; conversely, if there is continuous pressure in the short term and it cannot stabilize above 4440, there is a risk of the triangle pattern breaking down, leading to a phased correction that tests the lower supports in sequence.
The current price is close to the lower edge of the channel, and in the short term, it belongs to a stage of waiting for direction selection. The candlestick has not shown a clear unilateral signal, so it is preferable to treat it with a range thinking and avoid chasing orders prematurely.
3. Operation Ideas
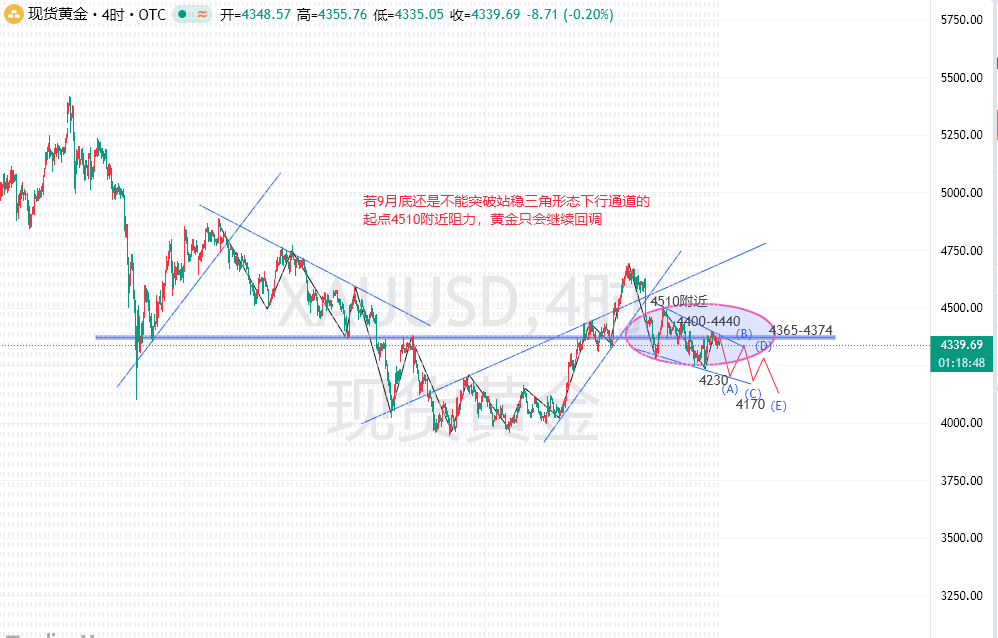
1. Short-term: Before the price breaks 4440, consider it with a weak oscillation approach. If it rebounds near 4440-4400 and faces pressure, one can try to short, with a stop loss placed at 4460 and an initial target set at 4300-4280, with further expectation of 4230 support.
2. Long Position Opportunities: Do not rush to catch the bottom; wait for two situations: first, for the price to test the 4230 support and stabilize to give a stop-loss signal before considering a low buy; second, if it stands firmly above 4440 with increased volume, confirm support on a pullback and buy in the direction of the trend with a target above at 4550.
3. Risk Control Reminder: The market at the end of the triangle is prone to false breakouts; when entering the market, be sure to set stop losses, control positions, and pay close attention to sudden fluctuations caused by news in the US market.
(The strategy is for reference only)
免责声明:本文章仅代表作者个人观点,不代表本平台的立场和观点。本文章仅供信息分享,不构成对任何人的任何投资建议。用户与作者之间的任何争议,与本平台无关。如网页中刊载的文章或图片涉及侵权,请提供相关的权利证明和身份证明发送邮件到support@aicoin.com,本平台相关工作人员将会进行核查。