Bitcoin BTC Stands Above the 50-Week Moving Average, Significant Changes in the Market
Recently, Bitcoin BTC has once again stood around 81,000 USD.
But more noteworthy than the price itself is that a technical indicator has changed:
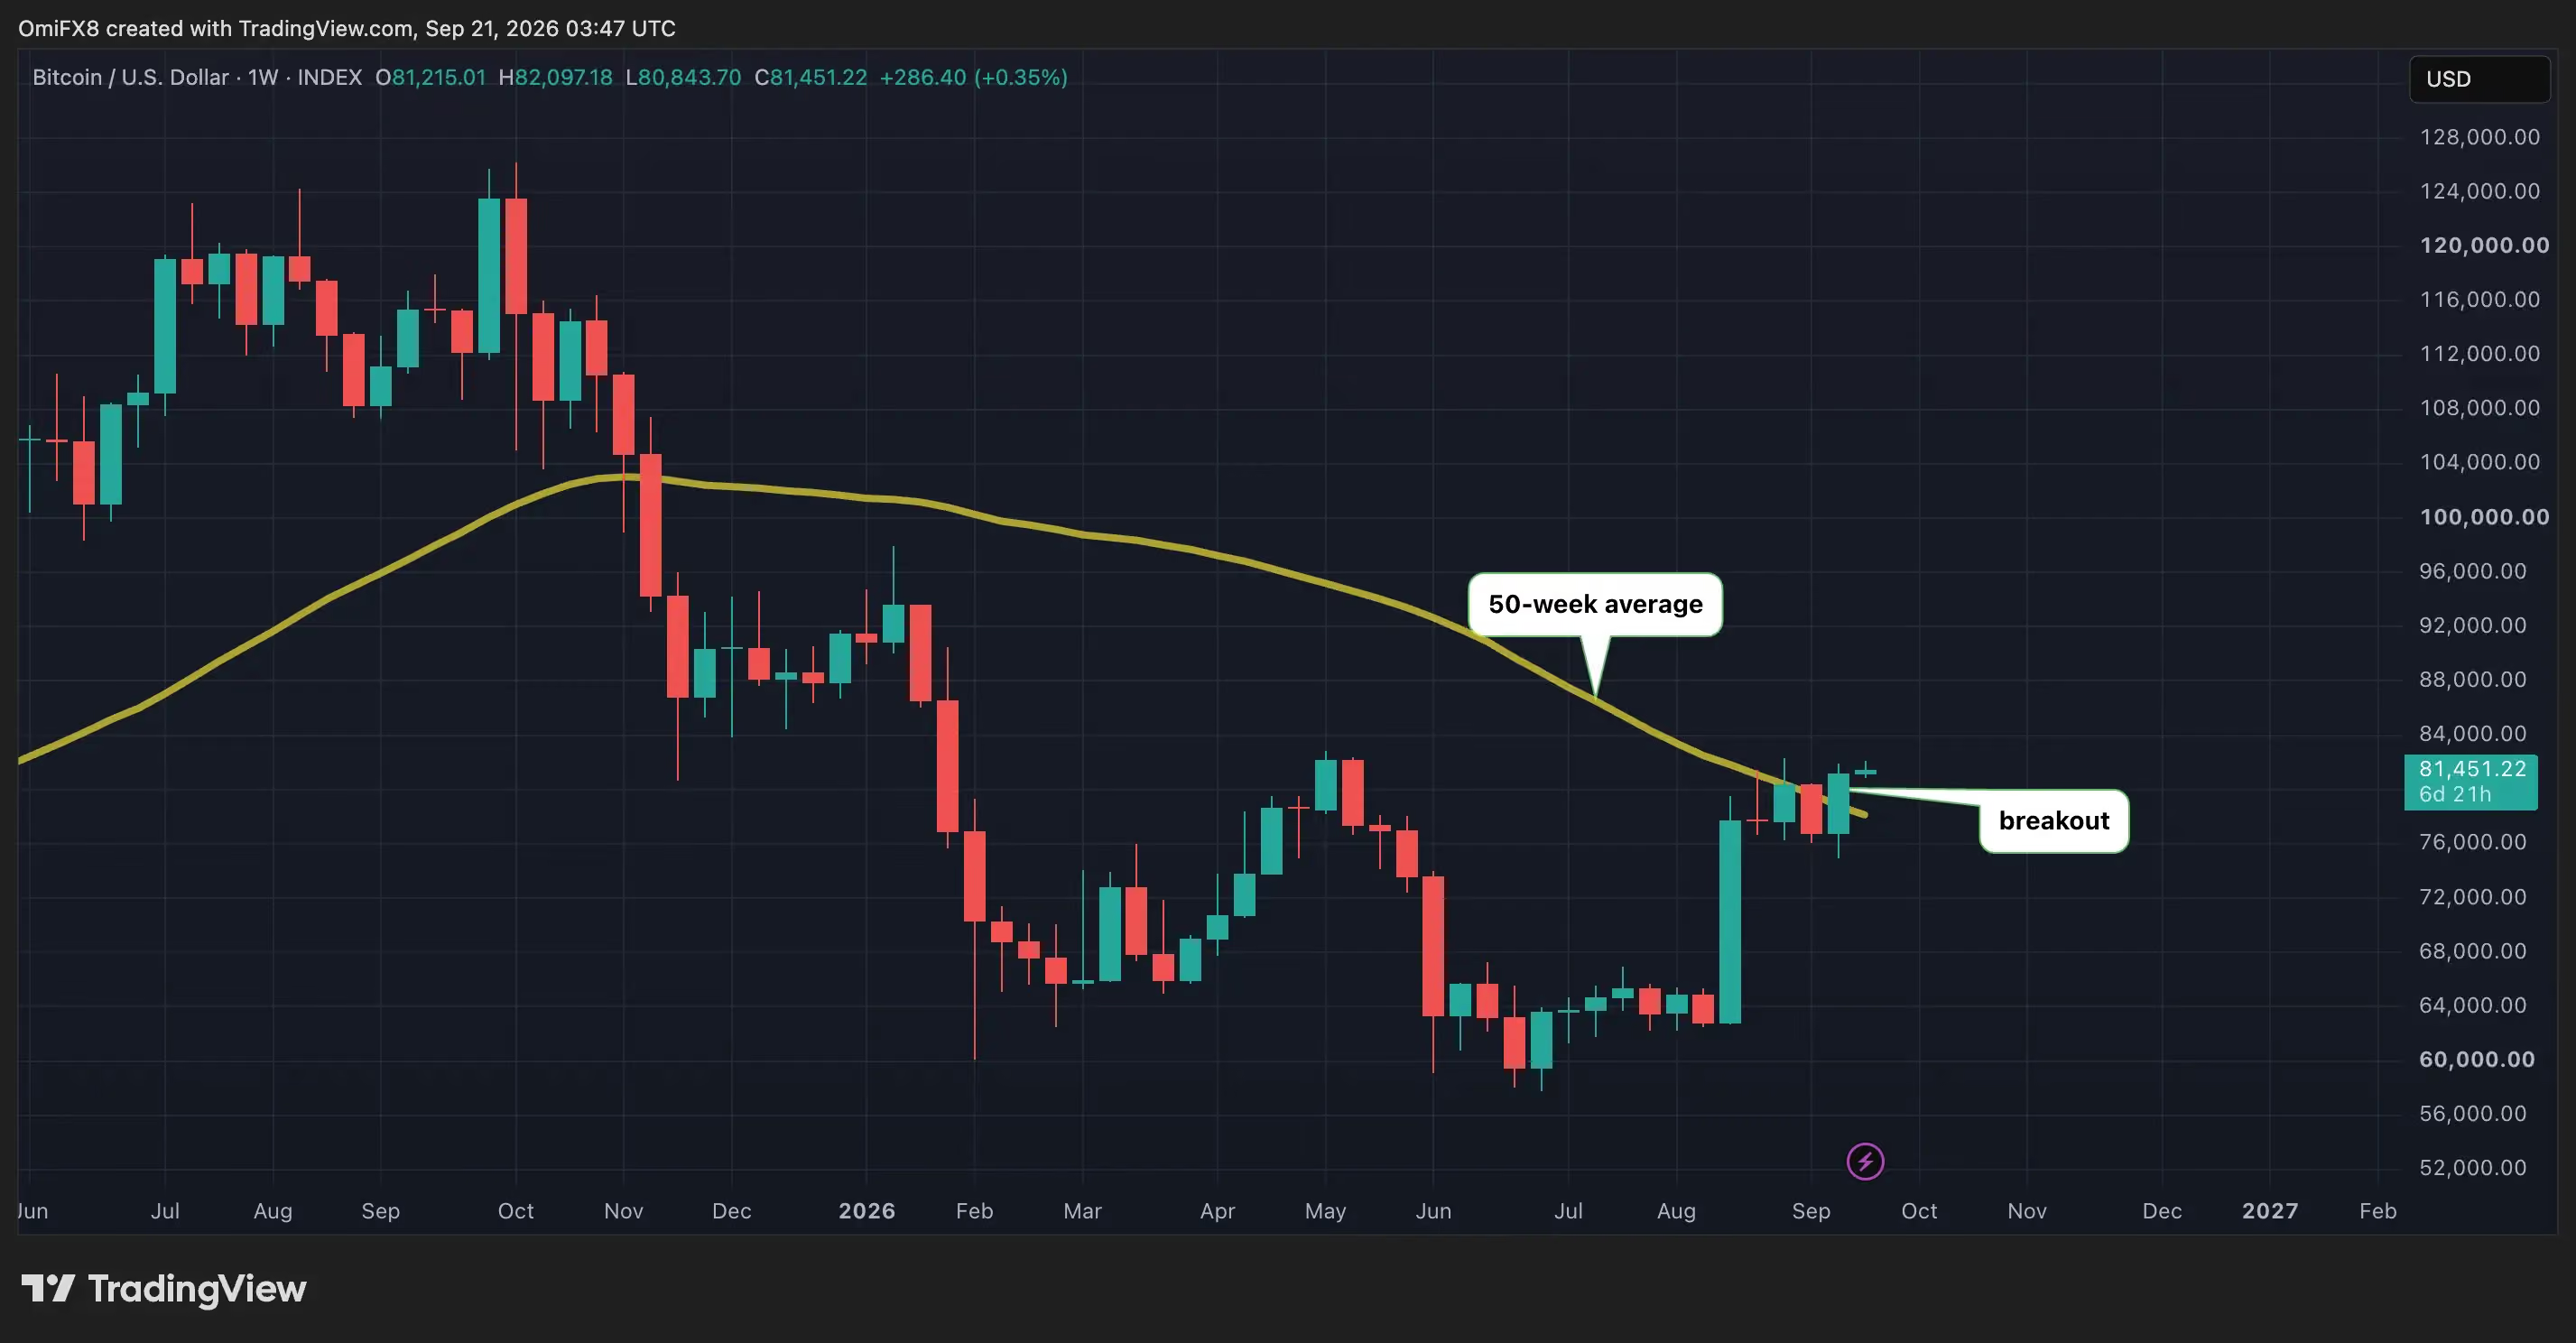
BTC Weekly Close Reestablishes Above the 50-Week Moving Average.
As of the week ending September 20, BTC has closed above the 50-week moving average for the first time after 45 weeks.
Currently, BTC is around 81,450 USD, while the 50-week moving average is near 78,115 USD.
This means that this time BTC did not just briefly pierce the moving average; it completed a full weekly close breakout.
So the question arises:
What is so important about the 50-week moving average?
Why is the 50-Week Moving Average Worth Noting?
Simply put, the 50-week moving average can be understood as BTC's average price over the past year.
During market uptrends, BTC typically operates above this moving average; while during prolonged downturns, rebounds often encounter resistance near this line.
Thus, in many technical analysis frameworks, the 50-week moving average is seen as an important reference for assessing BTC's medium- to long-term trend.
Galaxy Research even characterizes it as a "ceiling" during large declines in BTC.
Once BTC falls below this line, if subsequent rebounds can't reclaim it, it usually indicates that the market's long-term trend remains weak.
Conversely, if BTC can reestablish itself and maintain above the moving average, historically it often signifies that the market is transitioning from a long-term down phase to a new up phase.
Therefore, it is relatively easy to understand why this weekly breakout has garnered market attention.
📌 If you want to continuously track BTC, ETH, and the impact of macro data on the market, you can follow the public account "Bitcoin Spring," which explains important market changes and the underlying logic every day.
Historically, This Signal Has Indeed Preceded Major Movements
According to Galaxy's statistics on major BTC downturns since 2011, BTC has managed to stand above the 50-week moving average 13 times.
Of these, in 11 instances, BTC did not set a new cycle low afterwards.
Interestingly, several significant breakthroughs occurred after major bear markets ended.
After the major drop in 2011, BTC reestablished itself above the 50-week moving average in January 2012, and then rose from about 2 dollars to around 1,200 dollars in 2013.
After the 2014-2015 bear market ended, BTC reestablished above the moving average in October 2015 and then rose from around 200 dollars to nearly 20,000 dollars by the end of 2017.
After the significant drop in 2018, BTC reestablished above the moving average in May 2019, starting from around 3,200 dollars and reaching a historical peak of over 69,000 dollars in 2021.
Finally, after the market bottomed out in 2022, BTC reestablished itself above the 50-week moving average in March 2023, and then experienced a prolonged upward trend lasting over two years, eventually setting a new high of around 126,000 dollars in 2025.
Thus, from historical data, this certainly is a trend signal worth monitoring.
However, one must emphasize a point:
Historical correlations do not guarantee that the future will repeat.
This Time, Could it Be Another Bull Market Starting Point?
The answer cannot be based solely on the "standing above the moving average" indicator.
Because there have been failed cases in the past.
Among the 13 breakthroughs documented by Galaxy, there were 2 instances where the upward trend did not continue, occurring in December 2021 and March 2022.
At that time, BTC temporarily stood above the 50-week moving average but then fell below again, eventually plunging to around 16,000 dollars.
In other words:
What truly matters is not whether BTC is above the 50-week moving average today, but whether it can hold above it in the coming weeks.
This is why the critical position this time is very clear:
About 78,115 USD.
If BTC can consistently operate above the 50-week moving average, the technical significance of this breakthrough will be further enhanced.
However, if it quickly falls below this line again, then this breakthrough may only be a temporary technical rebound.
Why This Time, Should We Not Just Focus on Technical Indicators?
For the current cryptocurrency market, technical analysis is only one variable.
Previously, BTC has been impacted by multiple macro factors, including the Fed's rate hikes, the path of US interest rates, changes in the dollar and US Treasury yields, and expectations of regulatory policies.
Recently, as BTC reestablished itself around 81,000 USD, US stocks and global risk assets also experienced a rebound.
BTC has risen approximately 29% over the past 35 days, with a single-week increase close to 6%.
This indicates that market risk appetite has indeed shown some recovery.
However, if we want this rebound to develop further, we still need to see:
Liquidity, capital flows, and macro environment continuing to align.
In particular, BTC ETF funds, the dollar, US Treasury yields, and the Fed's future rate path will all affect whether this rebound can continue.
📌 If you want to continuously track BTC, ETH, and the impact of macro data on the market, you can follow the public account "Bitcoin Spring," which explains important market changes and the underlying logic every day.
What Should We Really Focus on Next?
Now we can concentrate on three areas.
First, Can BTC hold above the 50-week moving average?
The current position is around 78,115 USD.
This will be the first observational line to determine whether this technical breakout is valid.
Second, Can BTC continue to form a higher weekly structure?
Standing above the moving average is just the first step.
If it can continue to break through significant resistance ahead and form higher highs and higher lows, the trend structure will further improve.
Third, Can capital and the macro environment keep up?
Technical indicators can reflect market changes in advance, but what ultimately drives sustained large-scale operations are funds and liquidity.
Therefore, moving forward, we should not only keep an eye on the candlestick charts but also continue to observe ETF funds, US Treasury yields, the dollar, and Fed policy.
📌Web3 Mr. X: BTC Breaking the 50-Week Moving Average is an Important Signal, But the Real Key is Whether It Can Stand Firm
This time BTC restanding above the 50-week moving average is indeed a noteworthy change.
Historical data also shows that this position has repeatedly appeared before the end of bear markets and major uptrends.
However, history does not simply repeat itself.
So the most important question now is not "Has BTC entered a bull market," but rather:
Can BTC maintain its position above the 50-week moving average in the coming weeks, while ensuring that funds and the macro environment align as well?
If it can hold, the significance of this breakthrough will grow.
If it falls below again, then the market will still need to revalidate the strength of this rebound.
For ordinary investors, rather than rushing to conclude about the market, what matters more now is to focus on the critical positions, capital flows, and changes in macro variables.
—— I am Web3 Mr. X, with 6 years in Web3 growth, focusing on Bitcoin, the crypto market, macroeconomics, and industry trends. If you wish to continuously track BTC, ETH, HYPE, and the impact of macro data on the market, you can follow the public account "Bitcoin Spring." Understand the hotspots, gain insights into the logic, and establish your judgment instead of just watching price fluctuations.

免责声明:本文章仅代表作者个人观点,不代表本平台的立场和观点。本文章仅供信息分享,不构成对任何人的任何投资建议。用户与作者之间的任何争议,与本平台无关。如网页中刊载的文章或图片涉及侵权,请提供相关的权利证明和身份证明发送邮件到support@aicoin.com,本平台相关工作人员将会进行核查。