A rare technical setup has formed on Shiba Inu's (SHIB) weekly chart, potentially triggering the process of removing another zero from the asset's price. The market has recorded a classic "bullish combo," where long-term seller exhaustion has coincided with a local price reversal.
Right now, the token is trading near its local bottom at $0.00000547, showing a weekly gain of 6.72%. The intrigue of the current situation lies in the technical divergence between the price and the actual indicator readings.
You Might Also Like

Sat, 09/19/2026 - 14:21 SHIB to $0.000006? Shiba Inu Golden Cross Completes With One Hurdle LeftByTomiwabold Olajide
HOT Stories Uniswap (UNI), Near Protocol (NEAR), Hyperliquid (HYPE) and Bitcoin (BTC) Price Analysis For September 19: Bulls Try to Grab Market Flows Millions Worth of XRP Shorts Get Liquidated as Price Surges to $1.4
The main argument in favor of a reversal is the formation of a classic bullish RSI divergence. While SHIB's price has been consistently setting new lows over the past several months, the Relative Strength Index has shown a series of higher lows on the weekly timeframe.
This signal has provided a clear indication that selling pressure has been exhausted and the bearish trend is running out of steam.
Shiba Inu chart stalls near local bottom but prepares to erase a zero: A concise breakdown of the situation
As a result, two key drivers have emerged on the chart:
- RSI divergence: Higher lows on the oscillator confirm a hidden influx of liquidity into the asset.
- Support at the bottom: The current green impulse has allowed the price to hold critical lows.
Buyers have managed to establish a local support level and halt aggressive bearish pressure. This price stabilization reduces the likelihood of a further decline in the short term.
The chart clearly demonstrates how the asset is attempting to establish short-term moving averages as local support. Such a divergence between the indicator and the price often precedes impulsive breakouts from prolonged downtrends.
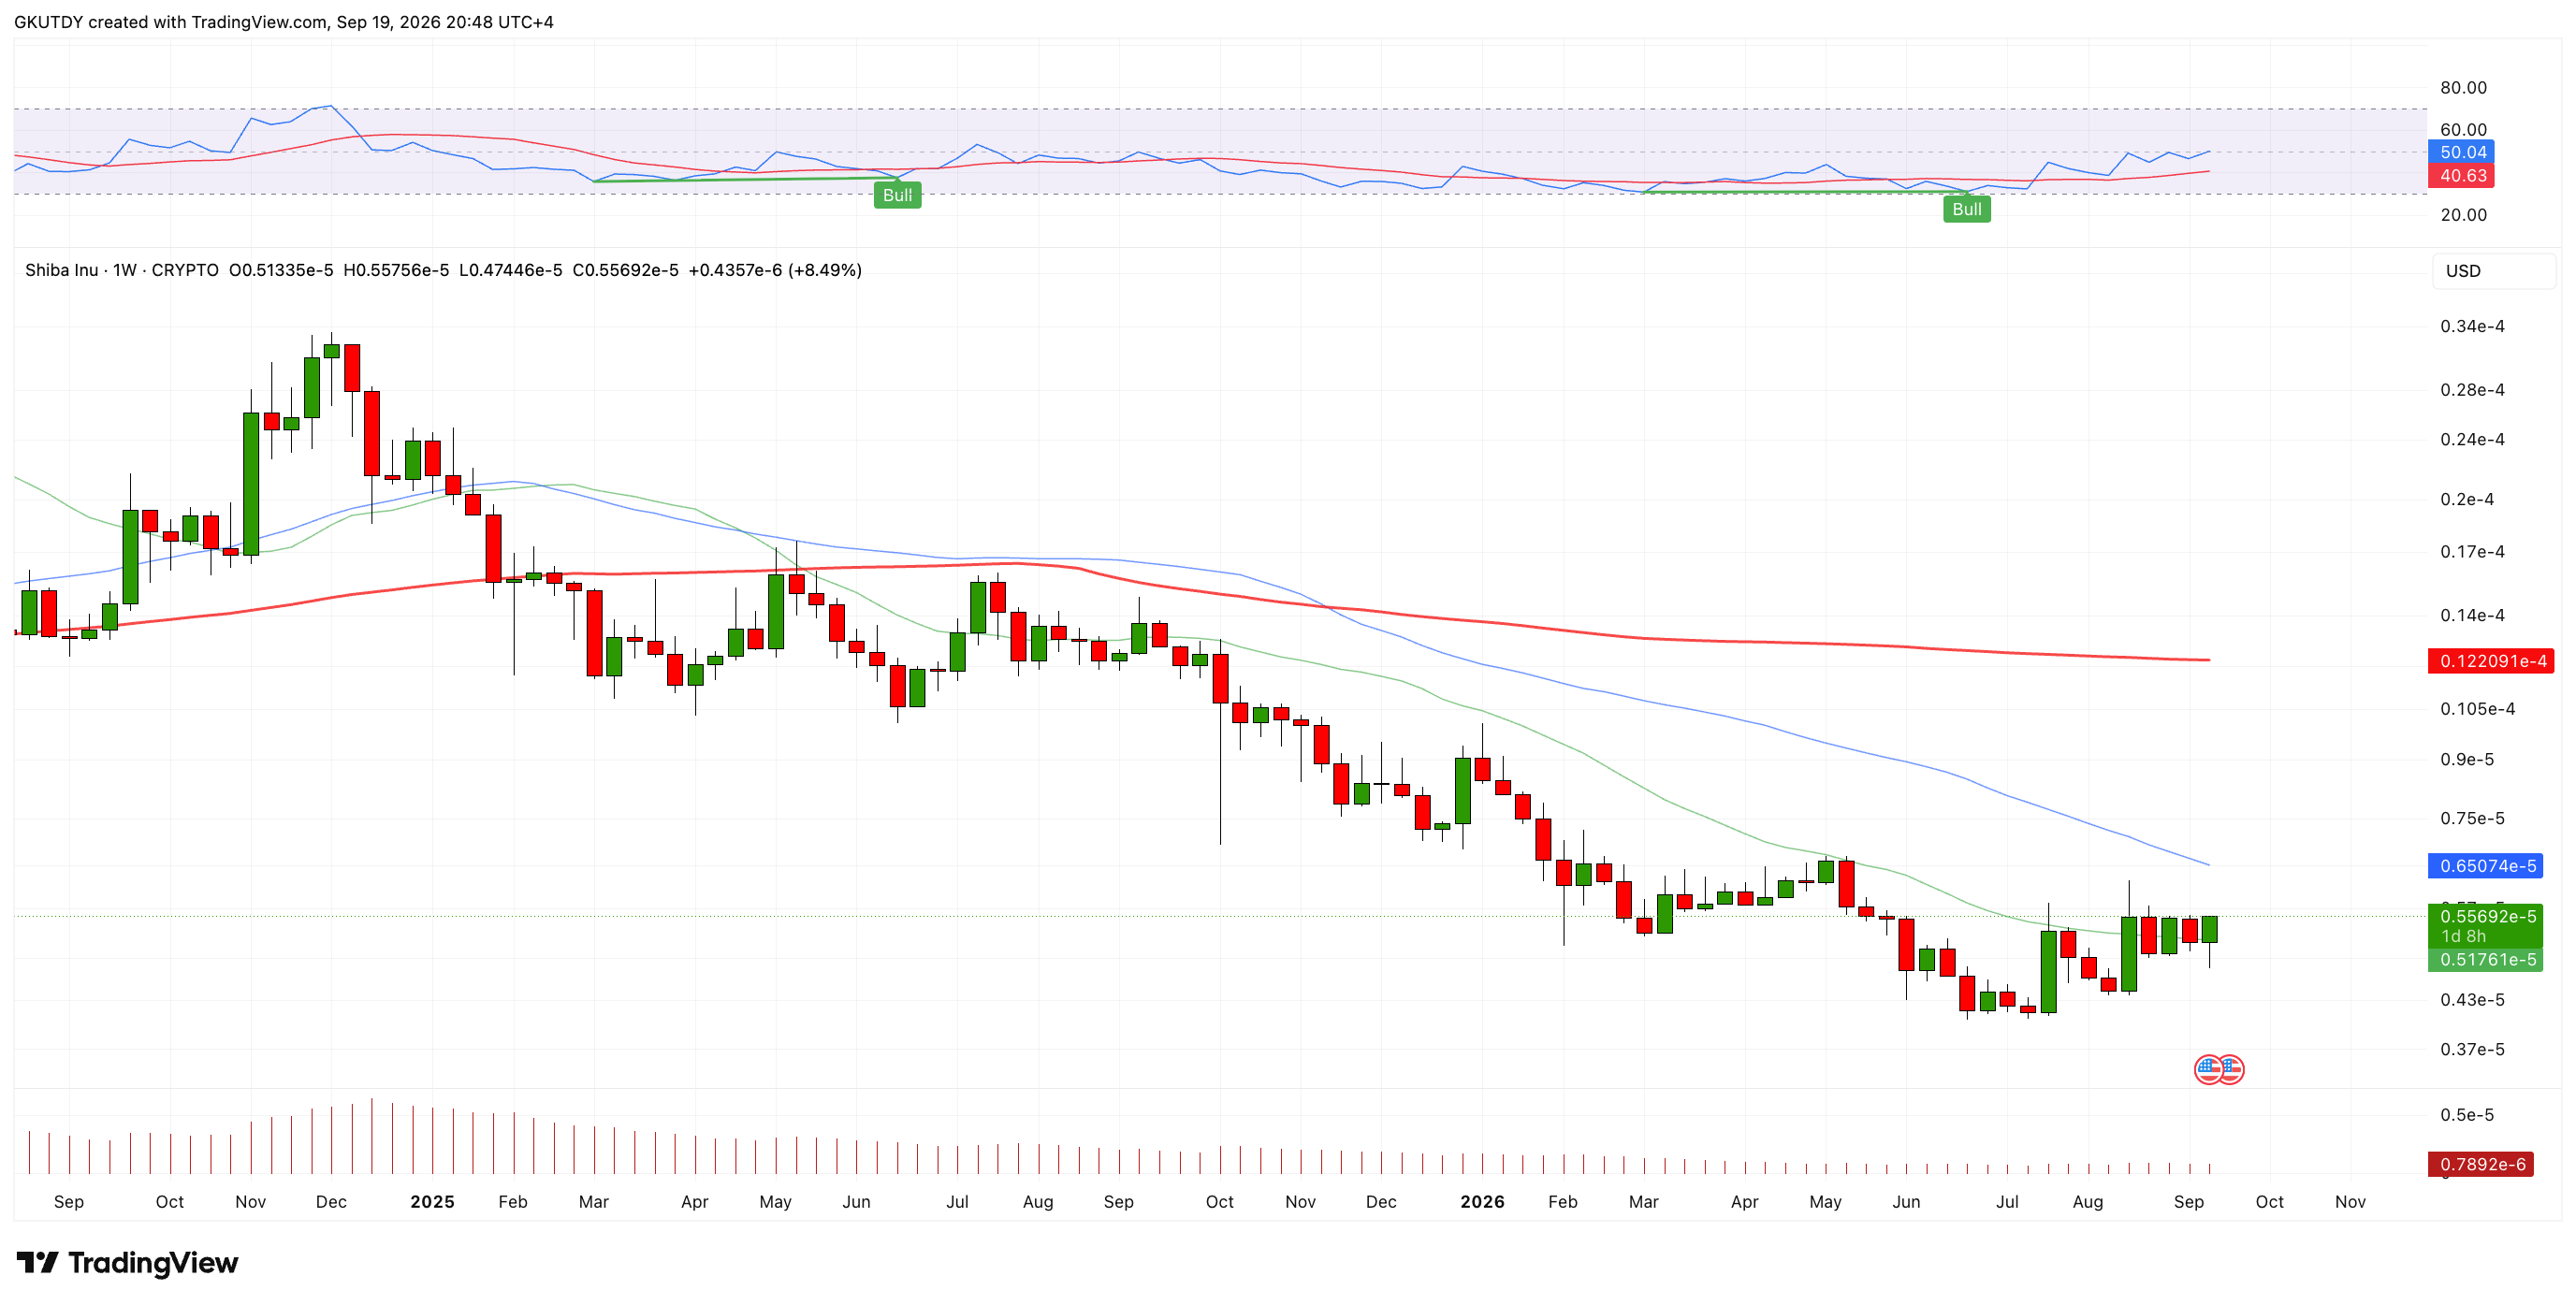
Shiba Inu weekly chart showing a bullish RSI divergence and key moving average resistances, Source: TradingView
However, investors should not expect an easy "removal of a zero" and a stable transition into the $0.00001+ zone. The main barrier for buyers lies significantly above current prices, at $0.0000122. This is where the major 200-week moving average (MA) sits, acting as the primary resistance level on the broader chart.
You Might Also Like

Sat, 09/19/2026 - 03:00 Shiba Inu (SHIB): +468 Million Tokens Added, Bears May Be ExhaustedByArman Shirinyan
A breakout above this line is necessary for the technical combo to turn into a full-fledged uptrend. For now, this level continues to exert strong psychological pressure on the market. Previous attempts to break through similar major moving averages have often resulted in deep corrections.
The asset's future directly depends on whether buyers have enough momentum to push through this line. If the market confirms a breakout, SHIB will validate the bullish combo and erase a zero from its price. Otherwise, the current surge will remain nothing more than a temporary rebound.
免责声明:本文章仅代表作者个人观点,不代表本平台的立场和观点。本文章仅供信息分享,不构成对任何人的任何投资建议。用户与作者之间的任何争议,与本平台无关。如网页中刊载的文章或图片涉及侵权,请提供相关的权利证明和身份证明发送邮件到support@aicoin.com,本平台相关工作人员将会进行核查。


