Crypto Circle Academician: 9.20Ethereum (ETH)double top under pressure hides danger, what is the trading underlying logic of the fluctuating market? Latest market analysis reference
Current price of Ethereum is 2645, as the market has reached this point, many people always think about grabbing the big trend at once, always wanting to eat all the profits in one go, always missing the chance is okay, I reminded you at 1650, I reminded you at 1750, and even this week I suggested 2370, missing it is also okay, there are always opportunities now it is obviously a high-level fluctuation stage, there is no one-way trend, frequently opening positions back and forth can easily result in repeated stop losses. Don’t fantasize about capturing every fluctuation, find opportunities that suit you and take action with me again
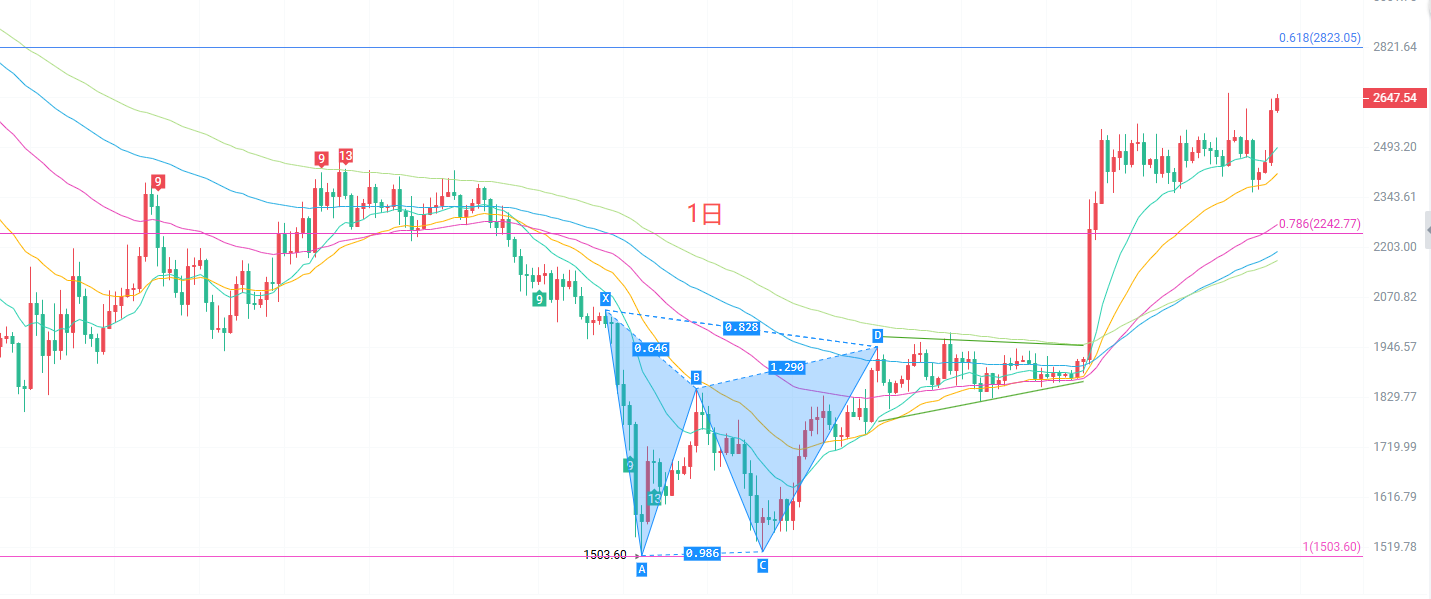
The daily K-line moving average system maintains a bullish arrangement,EMA15 and EMA30 continue to support the price, and the medium to long-term trend remains bullish. The MACD indicator DIF is still above DEA, but the red bars are clearly shrinking, and bullish momentum is beginning to fade. The upper Bollinger band near 2604 has been repeatedly pierced by the price, and the current price is fluctuating near the upper Bollinger band. The Fibonacci 0.618 level at 2823 is the target for the next phase. If the price cannot stabilize above 2666 in the short term, it is highly probable to start a pullback testing the support below, and we need to be wary of a high-level retracement market
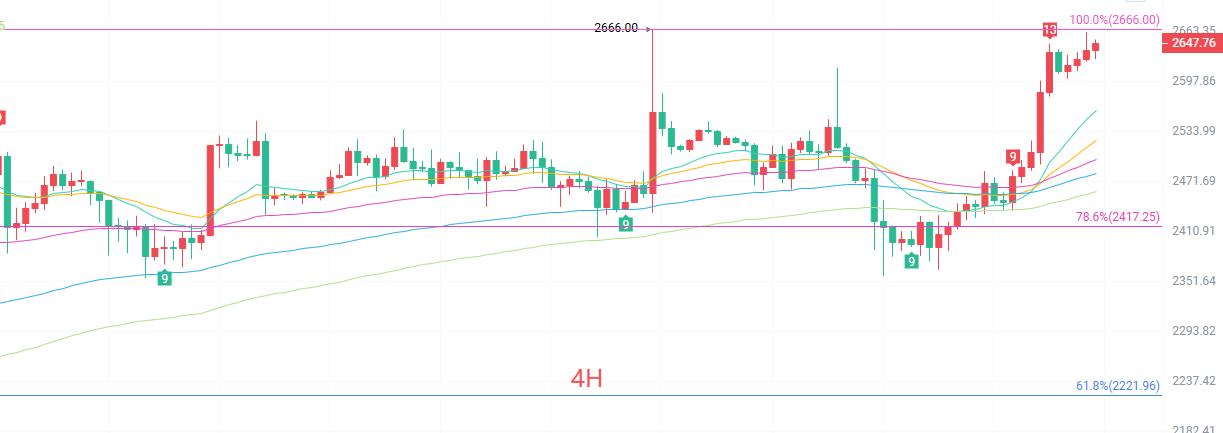
The four-hour K-line has formed double top pressure at the high point of2666. The EMA moving average cluster is still upward, with short-term moving average support near 2559, which is the first support for the short term. The MACD indicator DIF, DEA, and red bars are maintained, but the upward momentum is slowing down. The upper Bollinger band is at 2683 and the lower band is at 2330, with the price fluctuating in the upper Bollinger band range. It is in a high-level fluctuation pattern, where the competition between bulls and bears intensifies, and the price is likely to fluctuate rapidly back and forth within the range
Short-term Reference:
If breaking upward from 2570 to 2560, stop loss 40 points, target aim for 2650 to 2666
If not breaking downward from 2650 to 2666, stop loss 40 points, target aim for 2600 to 2570
Specific operations should be based on real-time market data. For more information, you can consult the author. The article may have delays in publication, suggestions are for reference only, risk is borne by yourself

Warm reminder: The above content was created solely by the author of the public account. Advertisements at the end of the article and in the comments section are unrelated to the author, please discern cautiously, thank you for reading
免责声明:本文章仅代表作者个人观点,不代表本平台的立场和观点。本文章仅供信息分享,不构成对任何人的任何投资建议。用户与作者之间的任何争议,与本平台无关。如网页中刊载的文章或图片涉及侵权,请提供相关的权利证明和身份证明发送邮件到support@aicoin.com,本平台相关工作人员将会进行核查。