Academician of the Coin Circle: There's no need to be anxious about missing out on Ethereum (ETH) on September 19, what are the opportunities for low buying and shorting within the trend framework? Latest market analysis reference
Ethereum's current price is 2580, many coin friends are afraid to enter when it rises and fear further declines when it pulls back, getting hit back and forth. However, we headed north near 1650 early in the morning, and this time, as we call you and me to rise again at the pullback to 2370, in a fluctuating upward market, chasing rises and killing dips is the worst. The big trend is upward, the margin for error in going long is higher, while going short can only capture short-term pullbacks with small positions. Don't fantasize about catching every market move, only take opportunities you understand
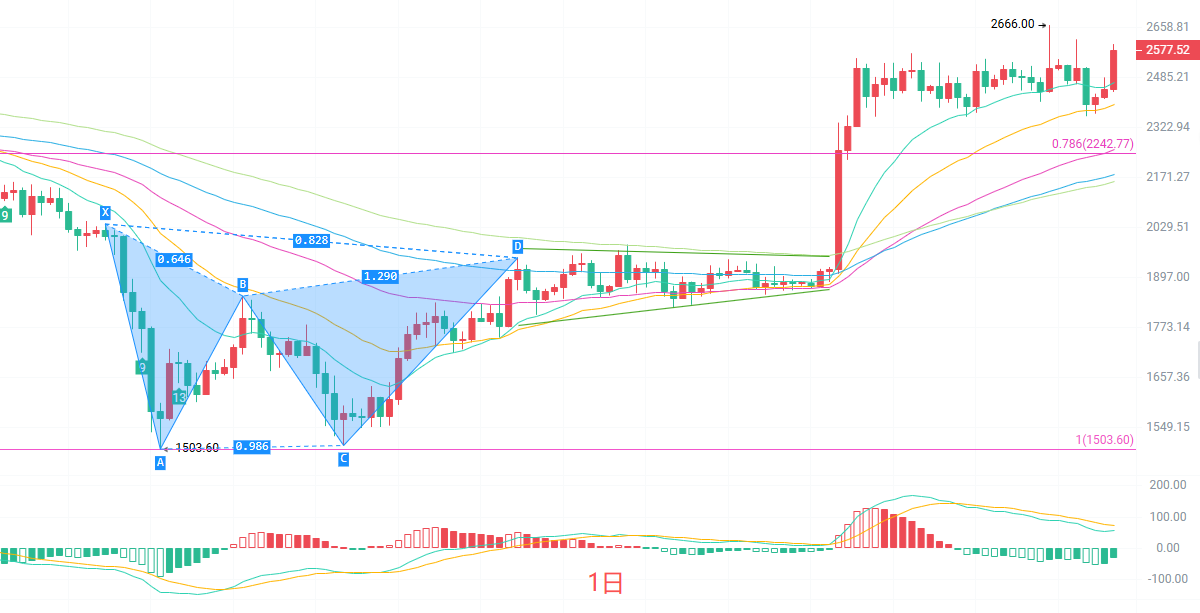
The daily K-line EMA15, EMA30 are all diverging upward, and the bullish trend structure is intact. The MACD indicator maintains a red bar, with DIFF above DEA, and bullish momentum continues. The upper Bollinger Band is 2564, and the price has already stood above the upper Bollinger Band, indicating a strong upward movement. The key support below is at the 0.786 Fibonacci level of 2242, which is an important watershed for this round of rise. As long as it does not effectively break down, the large bullish structure on the daily line will not be broken. Currently, the daily line is closing with a large bullish candle, and short-term sentiment is warming, but as it approaches the previous high, a pullback may occur at any time, so chasing rises blindly is not advisable
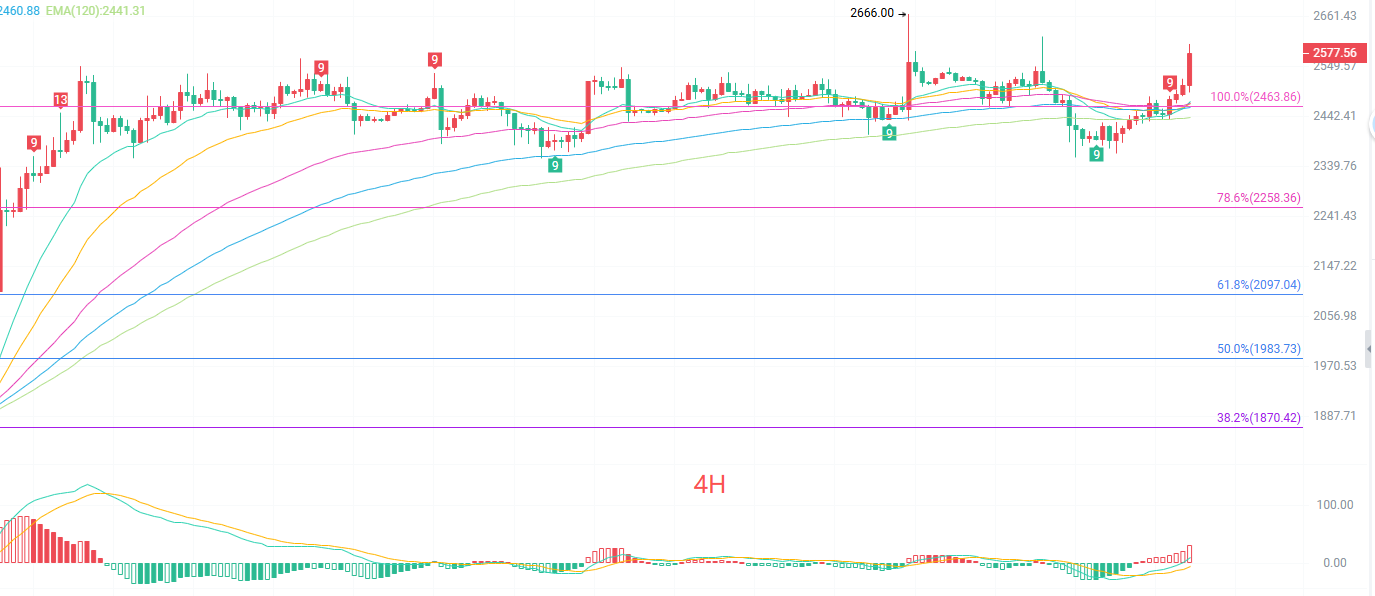
The four-hour K-line short-term moving averages EMA15, EMA30 support the price upward, forming a bullish support. The MACD red bars continue to amplify, releasing bullish momentum, and the Bollinger Band is opening upwards, with the price running near the upper band. The 100% Fibonacci level is 2463, which has previously transformed from resistance to support. As long as the pullback holds above 2464, the bullish structure will not deteriorate. The pressure above is the previous high at 2666, and the first touch is likely to see a pullback, which belongs to a short-term strong trend, but the indicators show slight signs of overbought conditions, so chasing long entries has a generally poor risk-to-reward ratio; waiting for a pullback opportunity will be more prudent
Short-term reference:
Move north if breaking below 2480 to 2450, with a stop loss of 40 points, targeting 2630 to 2666
Move south if unable to break above 2650 to 2670, with a stop loss of 40 points, targeting 2600 to 2550
Specific operations should mainly rely on real-time market data for more information, you can consult the author. The article is published with a delay, and suggestions are for reference only; risks are borne by the individual

Warm reminder: The above content is solely created by the author of the public account; advertisements at the end of the article and in the comments section are unrelated to the author, please discern carefully, thank you for reading
免责声明:本文章仅代表作者个人观点,不代表本平台的立场和观点。本文章仅供信息分享,不构成对任何人的任何投资建议。用户与作者之间的任何争议,与本平台无关。如网页中刊载的文章或图片涉及侵权,请提供相关的权利证明和身份证明发送邮件到support@aicoin.com,本平台相关工作人员将会进行核查。