Cryptocurrency Scholar: On September 19, Bitcoin (BTC) broke the consolidation pattern with a bullish candlestick. What is the boundary for the continuation of the bulls in this round? Latest market analysis and operational advice explained.
The current price of Bitcoin is 80700, and many people are once again confused about whether this is a rebound restarting a bull market, or a trap for retail investors. Just a few days ago, there was a back-and-forth struggle to find the bottom in a range, and suddenly a strong bullish candlestick pulled it up. Earlier I called for bullish moves below 60000, and this time on the 15th I called for bullish moves below 76000. The current price of 80870 is the best result. When trading, never let a single candlestick take your emotions over; you need to observe supports and resistances in conjunction with the cycles and clearly establish rules for entering and exiting, rather than relying on feelings to bet on ups and downs.
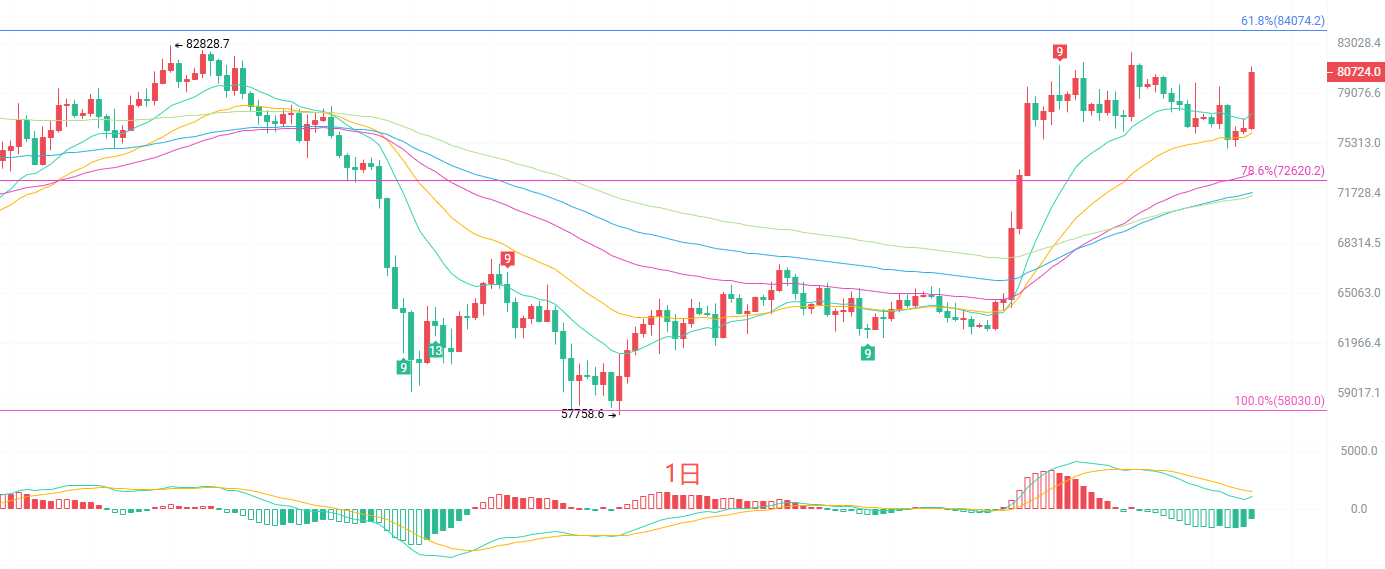
The daily candlestick moving average system all turns upwards, with the short-term EMA moving average providing strong support below. The Bollinger Bands are opening upwards, and the price has stood near the upper band; the MACD indicator has the DIF and DEA maintaining a bullish structure, with red bars magnifying again, and bullish momentum being released once more. The core resistance above looks towards the previous high of 82282, and beyond that is the historical high range of 97932. The overall trend on the daily scale has shifted from consolidation to a bullish tilt, but after consecutive large increases, overbought signals are gradually accumulating, and a technical correction may arrive at any time; we cannot blindly chase high prices.
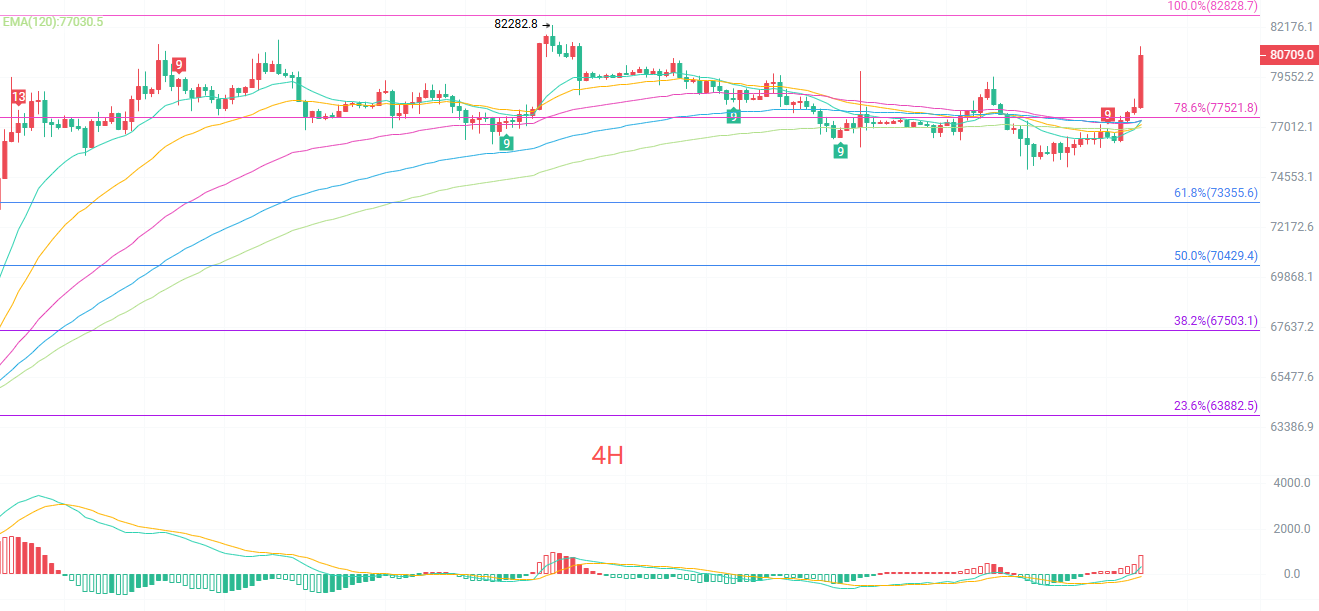
On the four-hour candlestick, the EMA moving averages are arranged in a bullish pattern, with short, medium, and long-term moving averages providing support in succession. The Fibonacci 78.6% level at 77521 has become the first support. The Bollinger Bands open quickly, and the price is running along the upper band; MACD is rising rapidly with significantly increasing red bars, showing strong short-term bullish power. However, after the quick surge in 4 hours, the indicators have entered the overbought zone, and there is a need for a pullback to confirm support on the short term. If the pullback does not break 77521, the bullish structure remains intact; once this position is broken, the current short-term surge will enter a consolidation phase.
Short-term reference
Bullish moves upwards from 77500 to 78000 with a stop loss of 500 points, targeting the previous high of 82000; after a breakout, look for even higher positions and do not chase the price's urgent rise.
Attempts to bearish moves downwards from the previous high of 82200, with a stop loss of 500 points, targeting 81000 to 80000.
Specific operations should be based on real-time market data. For more information, you can consult the author. There may be delays in article publishing; it is suggested for reference only and risk is borne by yourself.

Kind Reminder: The content above is solely created by the author of this public account. The advertisements at the end of the article and in the comments are unrelated to the author. Please exercise caution in distinguishing them. Thank you for reading.
免责声明:本文章仅代表作者个人观点,不代表本平台的立场和观点。本文章仅供信息分享,不构成对任何人的任何投资建议。用户与作者之间的任何争议,与本平台无关。如网页中刊载的文章或图片涉及侵权,请提供相关的权利证明和身份证明发送邮件到support@aicoin.com,本平台相关工作人员将会进行核查。