Edited time 2026.9.18 midnight
Cryptocurrency expert: On 9.18 Bitcoin (BTC) fluctuates within a box, with currents swirling, has the turning point window quietly approached? Latest market analysis and trading advice explained
The current price of Bitcoin is 76500. The hardest part of trading is not understanding the candlestick chart but controlling your impulses. Recently, this fluctuating market looks full of opportunities, but most of them are traps. Many people can't help but repeatedly enter the market, getting stopped out back and forth. I mentioned a few days ago that below 76000 is the best entry point for upward movement. Based on the current market situation, it seems we will linger for a while. Just hold good upward positions at the support level, and let time take care of the rest.
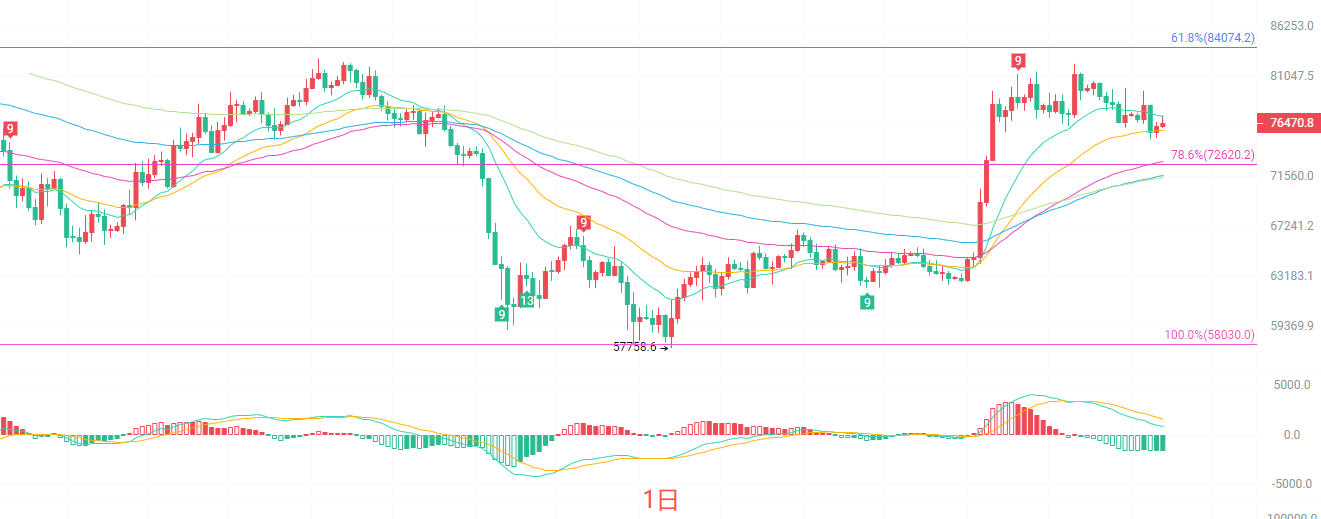
The daily K-line EMA moving average system remains in a bullish arrangement, with short-term moving averages forming support below the price, indicating that the daily trend has not completely turned bearish. The MACD indicator's red bars continue to shrink, and there are signs of the DIF and DEA turning downwards, gradually decreasing bullish momentum. The Bollinger Bands are narrowing, indicating that a significant market movement is brewing. The strong support on the daily line is at 72620, with pressure above at 80470. Only by breaking through the pressure point can the uptrend restart; breaking below the support will open up deeper retracement space.
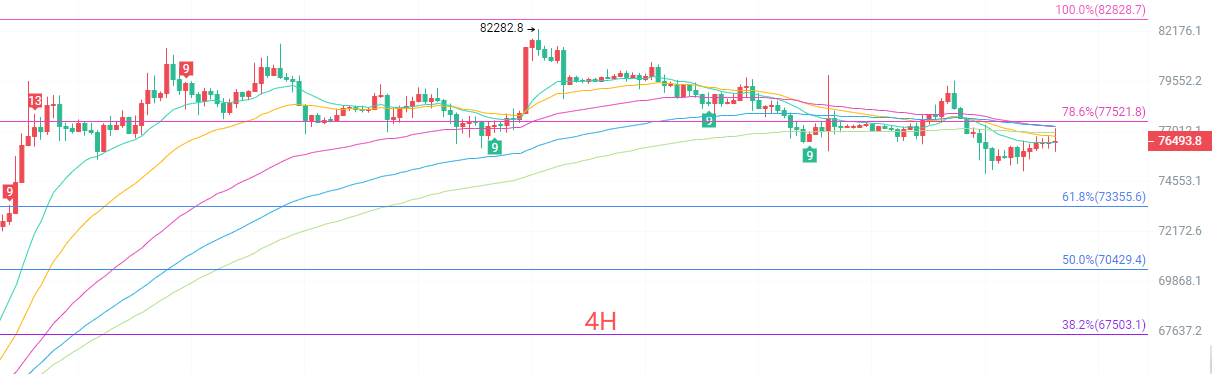
In the four-hour K-line, multiple EMA moving averages are intertwined, which is a typical signal of oscillation; the short-term bullish and bearish forces are balanced. The Fibonacci 78.6% resistance at 77521 becomes the first resistance above in the short term, with support below at 74460. The MACD is repeatedly tangled near the zero axis, alternating bullish and bearish momentum, with no unilateral trend. The Bollinger Bands continue to narrow, and the upper and lower bands are compressing, with volatility continuously decreasing. There hasn't been an effective breakout yet. Frequent spikes up and down indicate a predominant short-term sweeping market. Only by establishing a firm standing above 77521 with increased volume can the bulls regain initiative; if it breaks below 74460, the bears will dominate the short-term market.
Short-term reference
For upward movement from 76000 to 75500, stop loss at 500 points, target at 77500 to 80400
For downward stagnation from 77500 to 77800, stop loss at 500 points, target at 77000 to 76000
Specific operations will mainly depend on real-time market data. For more information, you can consult the author. There may be a delay in article publication, recommendations are for reference only, risk is self-borne.

Friendly reminder: The above content is only created by the author's public account. Advertisements at the end of the article and in the comments section are unrelated to the author. Please be cautious in differentiating, thank you for reading.
免责声明:本文章仅代表作者个人观点,不代表本平台的立场和观点。本文章仅供信息分享,不构成对任何人的任何投资建议。用户与作者之间的任何争议,与本平台无关。如网页中刊载的文章或图片涉及侵权,请提供相关的权利证明和身份证明发送邮件到support@aicoin.com,本平台相关工作人员将会进行核查。