Article edited on September 18, 2026 at 12:00 AM
Crypto Circle Scholar: Detailed explanation of the rebound layout strategy for Ethereum (ETH) on September 18, entrance and defense in a volatile market? Latest market analysis reference
Ethereum's current price is 2425, and we have already established a long position above 2380. Next, we will focus on the 2463 level. If multiple attempts to break through this level do not succeed, consider reducing positions to lock in some profits. In a volatile market, avoid over-trading; frequent operations will only deplete your capital. Trading is a long-term endeavor; the profit or loss of a single position is not important; what matters is sticking to risk control rules. Do not casually move stop-loss orders, and do not add positions based on emotions. Quietly wait for the market to choose a direction, maintain patience until the range is broken, and execute according to your plan.
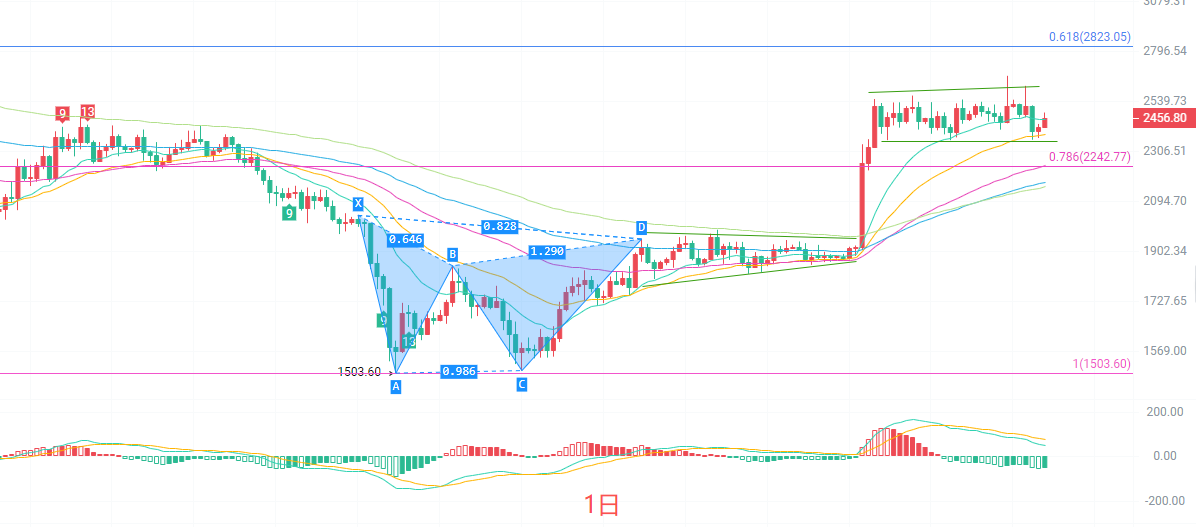
The daily K-line EMA moving average group remains in a bullish arrangement, and the medium to long-term trend has not deteriorated directly. The MACD indicator's red bars continue to shrink, and bullish momentum is gradually fading. The Bollinger Bands are narrowing, with price operating above the middle band. Key resistance is at 2539, with strong support below at 2242. The daily level indicates a consolidation phase following an upward trend; it is not a trend reversal but a pullback within a bullish market to gather strength. It is highly likely to maintain a range-bound fluctuation in the short term, waiting for the direction to be chosen, while the larger structure still retains the possibility of continuing to challenge previous highs.
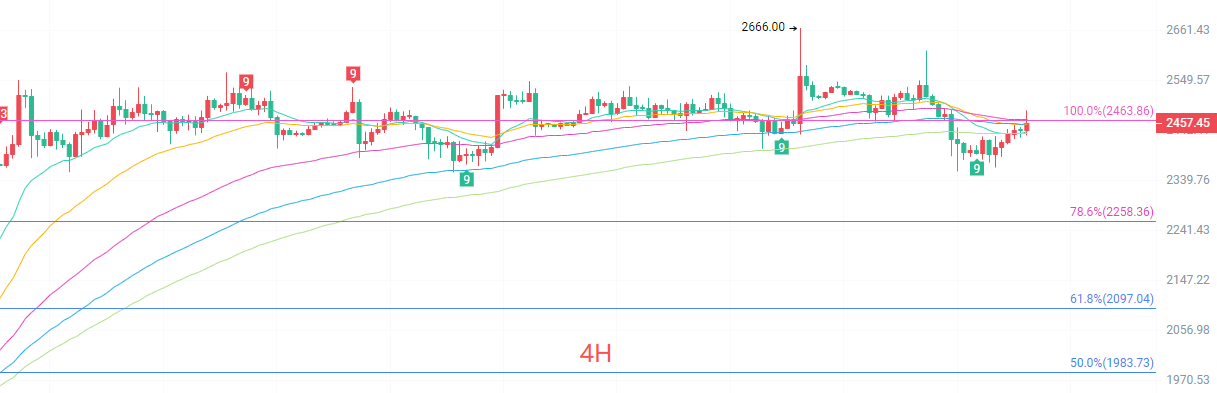
The four-hour K-line has rebounded after a pullback and has re-established itself above the EMA15, with short-term bullish strength somewhat repaired. The MACD is forming a golden cross near the zero line, with green bars shrinking and momentum tending towards balance. The Bollinger Bands continue to narrow, indicating that the market will soon emerge with a directional movement. The Fibonacci 100% position at 2463 presents nearby pressure, while the 78.6% position at 2258 is an important support. The four-hour market clearly shows signs of fluctuating, with bulls and bears contesting back and forth; do not blindly chase highs or lows in the short term, wait for the price to approach the boundary of the range before considering opening a position.
Short-term reference:
For breaks northward from 2360 to 2320, stop loss at 40 points, target at 2420 to 2470.
For pressure southbound from 2530 to 2550, stop loss at 40 points, target at 2460 to 2420.
Specific operations should be based on real-time market data; for more detailed information, you can consult the author. There may be delays in the article's publication; suggestions are for reference only, and risks are borne by the reader.

Warm reminder: The above content is solely created by the author for the public account. Advertisements at the end of the article and in the comment section are unrelated to the author; please discern carefully. Thank you for reading.
免责声明:本文章仅代表作者个人观点,不代表本平台的立场和观点。本文章仅供信息分享,不构成对任何人的任何投资建议。用户与作者之间的任何争议,与本平台无关。如网页中刊载的文章或图片涉及侵权,请提供相关的权利证明和身份证明发送邮件到support@aicoin.com,本平台相关工作人员将会进行核查。