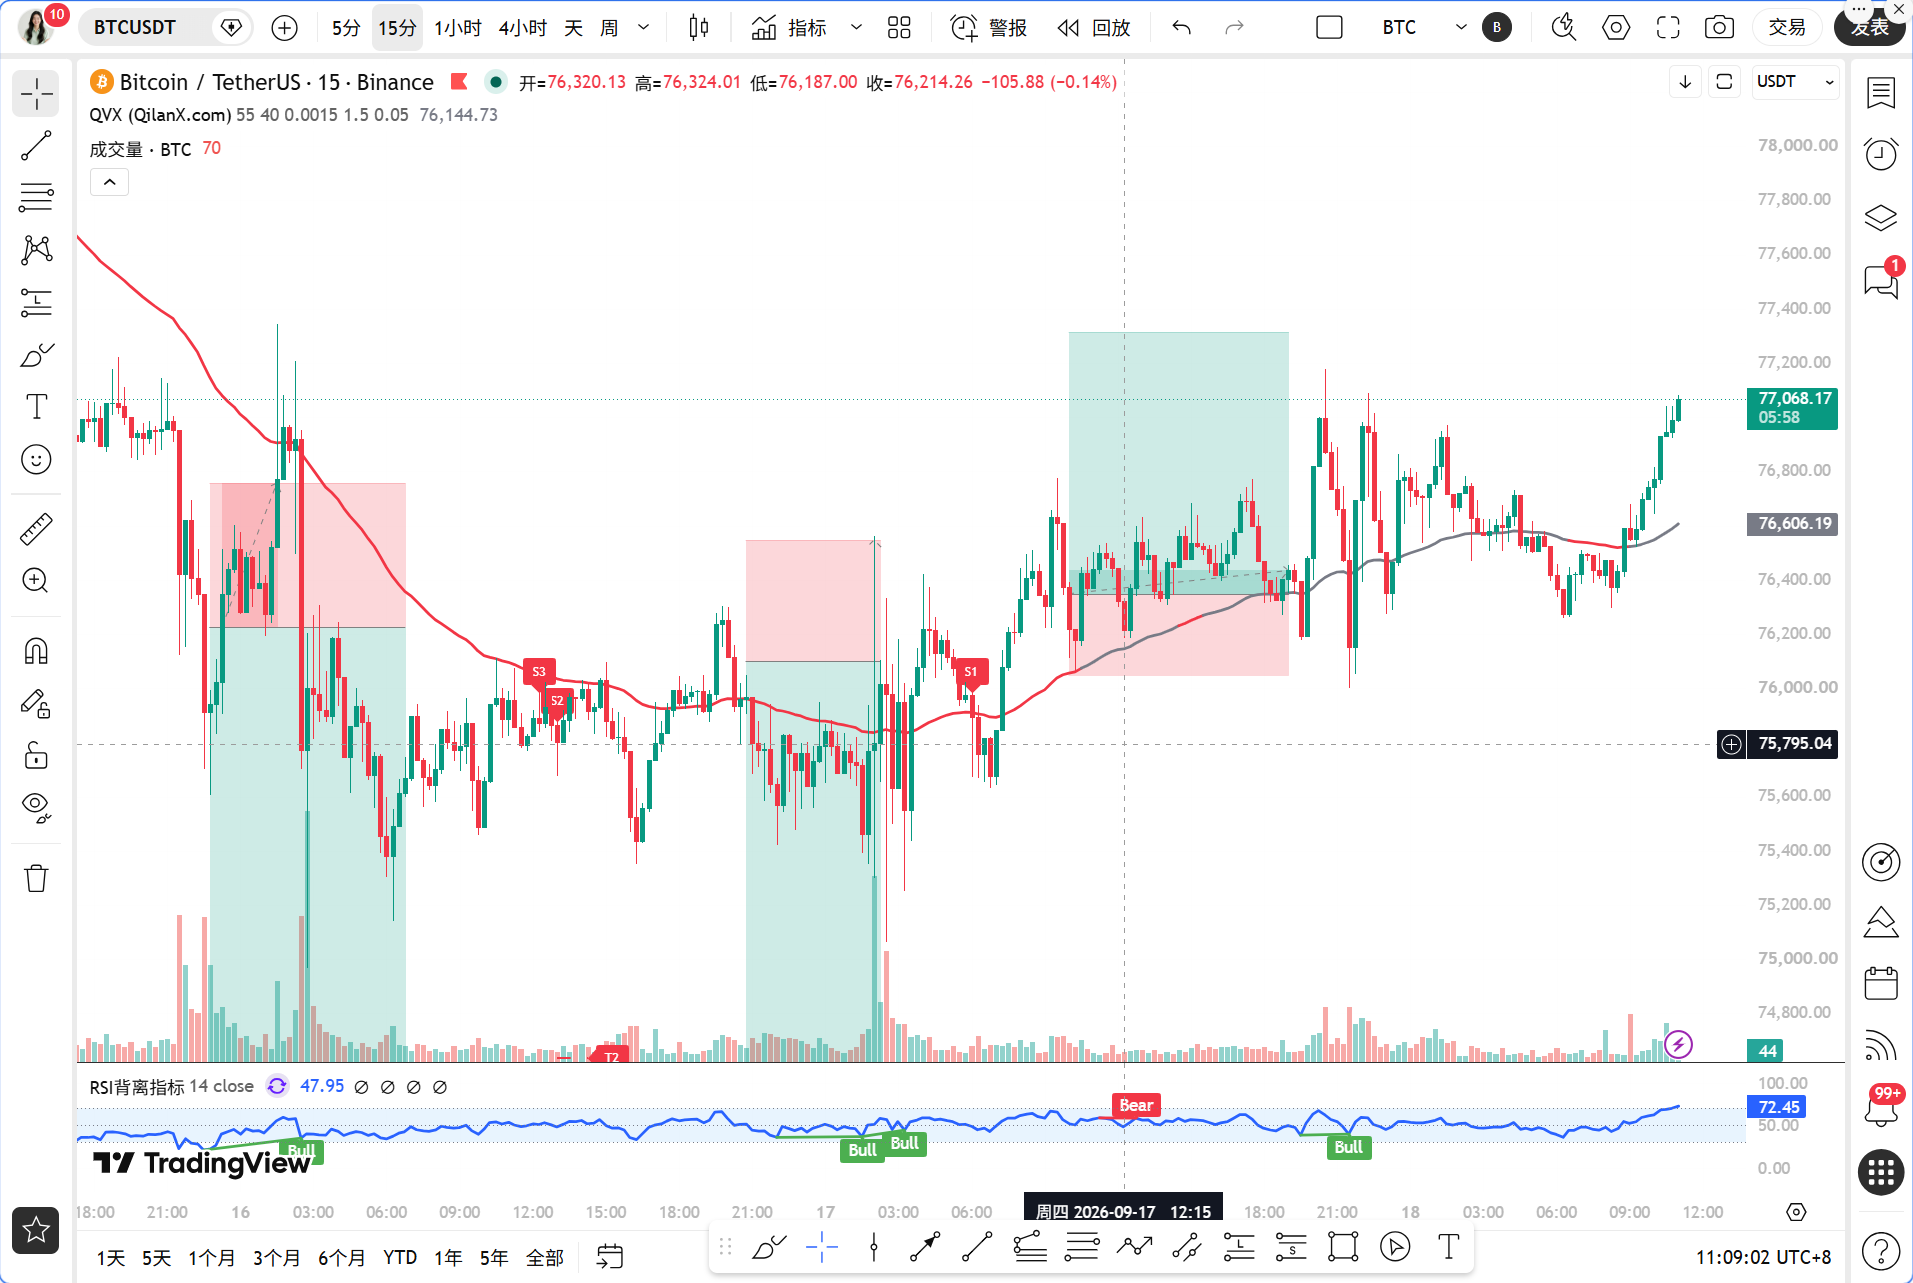
Dear teammates, today the market has received two completely opposite heavy signals. On one side, Trump's concession has increased the probability of the CLARITY bill passing to 33%, and the expectations for regulatory clarity are heating up, which is considered a short-term positive and is likely to boost market confidence. On the other side, the CPI for August exceeded expectations, reigniting interest rate hike bets, with the probability of a Fed rate hike in September soaring to 78%. JPMorgan even raised its interest rate hike forecast for 2026 to two times, while US Treasury yields have hit 5%, and the dual test of US finances is suppressing risk assets. The positive and negative forces are colliding head-on, making the long and short battle for BTC at the 77061 USDT position exceptionally fierce. Today, Sister Qinglan will use the TPV system to break down the market and clarify the trading ideas.
Current Price and Time
The current time is September 18, 11:09, with BTC's latest quote at 77061 USDT, and the 24-hour change is +0.81%. The Fear and Greed Index reports 56, in the greed zone, with a market share of 58.07%. From the data, it can be seen that market sentiment has not collapsed due to interest rate hike expectations, but the decline in the greed index from its high indicates that the confidence of bulls has weakened somewhat.
Multi-Cycle Overview
First, let's look at the daily level. The daily MA5=76703.53, MA10=76973.93, MA30=77950.24. The current price of 77061 is above the MA5 and MA10, but still below the MA30. The daily MACD has a DIF=814.23, DEA=1468.14, and a negative histogram value of -653.90, which indicates that both the DIF and DEA are at high levels but the histogram continues to be negative, suggesting that the adjustment pressure at the daily level has not been fully released. The daily RSI=38.08 is close to the oversold area but has not yet hit bottom, meaning the daily level is still in a weak corrective phase.
Next, let's look at the 4-hour level. The 4h MA5=76666.80, MA10=76431.32, MA30=76874.62. The price of 77061 stands above the 4h MA5, MA10, and MA30, which is a short-term bullish signal. The 4h MACD shows a DIF=-179.65, DEA=-292.39, and a positive histogram of 112.73. The DIF is below the zero axis but has crossed above the DEA to form a golden cross structure, and the histogram continues to expand, indicating that the rebound momentum at the 4h level is accumulating. The 4h RSI=61.75 is in the neutral to strong area and still has room for upward movement.
The 1-hour level is the core reference period of the TPV system. The 1h MA5=76760.06, MA10=76636.21, MA30=76521.60 shows a bullish arrangement. The 1h MACD shows a DIF=129.39, DEA=96.86, and a positive histogram of 32.52. Both the DIF and DEA are above the zero axis, and the histogram remains positive, indicating that the short-term momentum is bullish. The 1h RSI=62.06 is neutral and on the stronger side. The key point is that the 1h EMA55=76602.12, and the current price of 77061 is significantly above EMA55 by about 0.60%. According to the TPV system rules, the price is in the bullish trending area.
On the 15-minute level, the MA5=76939.51, MA10=76786.62, MA30=76583.10, showing a bullish arrangement. The 15m MACD's DIF=113.99, DEA=49.57, and a positive histogram of 64.43 show strong momentum. However, the 15m RSI=83.25 has entered the overbought area, indicating short-term pullback pressure, which should be noted.
TPV Signal Verification
According to the core rules of Qinglan's TPV system, we verify each condition. In terms of trend positioning, the current price of 77061 is greater than the 1-hour EMA55 of 76602.12, confirming it is in the bullish trend area.
Verification of Long Conditions. First, the price needs to hold above the 1H EMA55: it requires two consecutive 1-hour candles to close with prices above EMA55. From the current market, the price has been running above EMA55 for multiple cycles, satisfying this condition. Second, the support has stabilized: K-line has repeatedly found support in the 76500 to 76700 range, rebounding after hitting effective lows, and the bottom structure is initially formed, basically satisfying this condition. Third, bearish momentum is exhausted: the 1h MACD histogram has been positive for several cycles and has not shown significant shortening, and the RSI has rebounded from low to 62.06, supporting bullish momentum. The first two conditions are clearly satisfied, while the third condition is directionally correct but needs to continue observing whether the histogram maintains its value.
In terms of oscillation auxiliary data, among the past 8 1-hour candles, the number of closing prices above EMA55 is 3/8, with a crossing count of 1 time. The current price’s absolute distance from EMA55 is 0.60%. According to the TPV system rules, the oscillation threshold requires the number of closing prices above EMA55 to be between 3 to 5 times and crossing at least 2 times, or the price's distance from EMA55 to be less than 0.3%. The current crossing count is only 1 time, and the distance of 0.60% exceeds the 0.3% threshold. Therefore, it does not meet the criteria for judging an oscillation market, and the system suggests a possible unilateral trend, which provides additional logical support for going long.
On-Chain/Funding Aspects
The Fear and Greed Index at 56 is in the greed zone, indicating that overall market sentiment is not pessimistic. BTC's market share of 58.07% maintains a high level, with funds still concentrating on Bitcoin, providing certain support for BTC's price. However, it should be noted that this week, large unlocks of tokens like ARB, ZRO, and STRK will increase market supply, which may pressure ETH and altcoins, indirectly affecting BTC's market sentiment. Additionally, some traders are increasing short positions and reducing BTC to lock in profits, and Jiang Zhuoer's warning that BTC could accelerate its decline below 76500 serves as a reminder that while the short-term trend leans bullish, the pressure from above cannot be ignored.
Key Offensive and Defensive Levels
The first resistance level above is the 77500 to 77800 range, which is near the daily MA30 area and a previous dense position of chips. If it breaks through with volume, the next target looks at 78500. The first support level below is in the 76600 to 76700 range, corresponding to the resonance area of the 1h EMA55 and 4h MA5. The second support level is in the 76300 to 76500 range, which is a recent dense low point area and is also the key defense line mentioned by Jiang Zhuoer. If 76500 is lost, it will open up space to the downside to 75500.
Trading Ideas
Direction: Bullish, but confirmation signals need to be awaited.
Entry Conditions: Wait for price to stabilize in the 76600 to 76800 range, with the 1-hour K-line showing a long lower shadow or a bullish engulfing pattern, while the 1h MACD histogram remains positive and does not shorten, then enter long positions in batches. If the price breaks through 77500 with volume and stabilizes, light positions can also be added to the long side.
Stop Loss: After opening a long position, set the stop loss below 76300, that is, decisively exit if it falls below the recent dense low point area. If chasing a breakthrough, set the stop loss below 77000.
Target Levels: The first target is in the 77500 to 77800 range, the second target is 78500, and the third target looks at 79500. After reaching the first target, reduce half of the position and move the stop loss on the remaining position to protect profits.
Risk Warning
After CPI exceeded expectations, the probability of interest rate hikes has risen to 90%. If the Fed's decision releases unexpectedly hawkish signals, BTC may quickly fall below the support of 76500, so it is crucial to strictly implement stop-loss measures.
Follow the Qinglan Crypto Classroom to grasp more trading opportunities together! Welcome to visit the official website www.qinglan.org
📊 Qinglan TPV Trading Strategy Backtesting Reference
🕒 Last Backtesting Time 09-18 07:00:02
Total Analysis: 4089 Backtests: 4081 Accuracy Rate: 78.7% (3210/4081)
免责声明:本文章仅代表作者个人观点,不代表本平台的立场和观点。本文章仅供信息分享,不构成对任何人的任何投资建议。用户与作者之间的任何争议,与本平台无关。如网页中刊载的文章或图片涉及侵权,请提供相关的权利证明和身份证明发送邮件到support@aicoin.com,本平台相关工作人员将会进行核查。