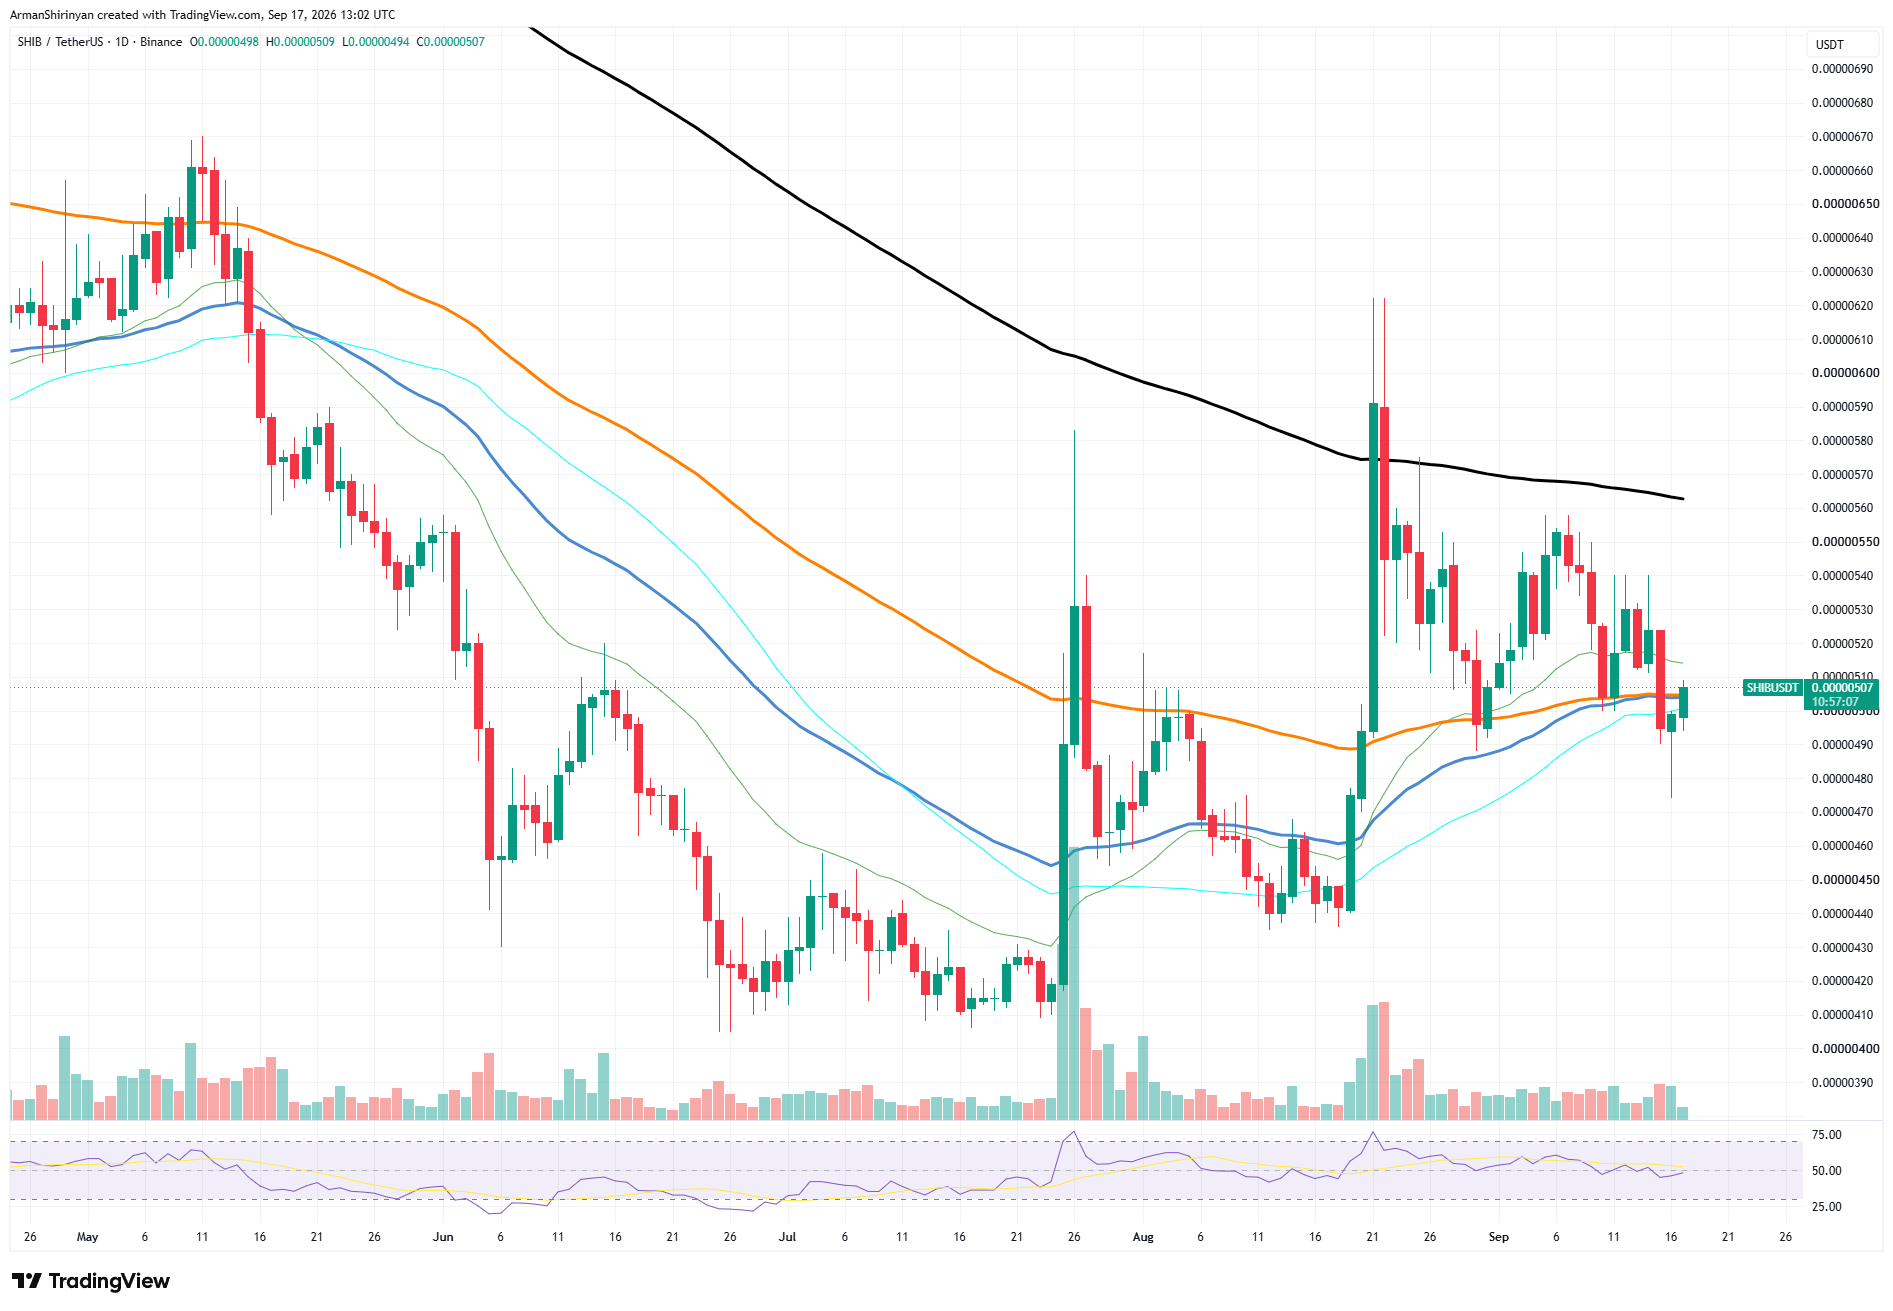
Spot-market demand for Shiba Inu is once again declining; all seven significant spot-flow timeframes now display negative net flows. The imbalance occurs as SHIB finds it difficult to break above the $0.00000500 mark, placing the token in a precarious technical position.
Netflows flip to negativity
Over longer time periods, the spot-flow data reveals increasingly significant outflows. Over 15 minutes, net flow is roughly -$14,540, over 30 minutes, it is -$26,680, and over an hour, it is -$63,710. Over four hours, the imbalance increases to -$134,800, over eight hours, to -$168,720, and over twelve hours, to roughly -$250,040.
SHIB/USDT Chart by TradingView
Sellers are continuously transferring more value out than buyers are bringing in over the specified time periods. Crucially, negative spot net flow does not always indicate that SHIB is going to fail. Rather than being a precise prediction of future prices, these numbers reflect the equilibrium between buying and selling activity on tracked spot markets, depending on the methodology.
HOT Stories SEC Rejects 19th XRP Short ETF While Bitcoin and Ethereum Drop $1.11 Billion: Main Crypto News This Morning Franklin's XRP ETF Pulls In Fresh $3.5 Million
Price takes a plunge
That issue is reflected in the chart. At the moment, SHIB is trading at about $0.00000507, directly between a number of short- and medium-term moving averages that are grouped around $0.00000495–$0.00000515. This results in a technical setup that is unusually compressed, where the next direction may be determined by relatively small price movements.
You Might Also Like

Thu, 09/17/2026 - 10:05 XRP Burn Rate Surges on the Ledger: Implications for PriceByArman Shirinyan
The first significant challenge is located between $0.00000515 and $0.00000520. SHIB has frequently had trouble sustaining its momentum above this region. Stronger resistance is found between $0.00000540 and $0.00000550, which is followed by the declining long-term moving average close to $0.00000565.
On the downside, losing $0.00000490 would expose $0.00000460–$0.00000470 and significantly weaken the structure. The RSI is still close to the neutral 50 range, providing neither side with much momentum support.
As a result, SHIB is experiencing a demand issue at the exact moment when its technical structure requires increased buying pressure. Another attempt to break above the moving-average cluster may find it difficult to develop into a sustained recovery unless spot flows improve.
免责声明:本文章仅代表作者个人观点,不代表本平台的立场和观点。本文章仅供信息分享,不构成对任何人的任何投资建议。用户与作者之间的任何争议,与本平台无关。如网页中刊载的文章或图片涉及侵权,请提供相关的权利证明和身份证明发送邮件到support@aicoin.com,本平台相关工作人员将会进行核查。


