


Click the mini program to view the original report
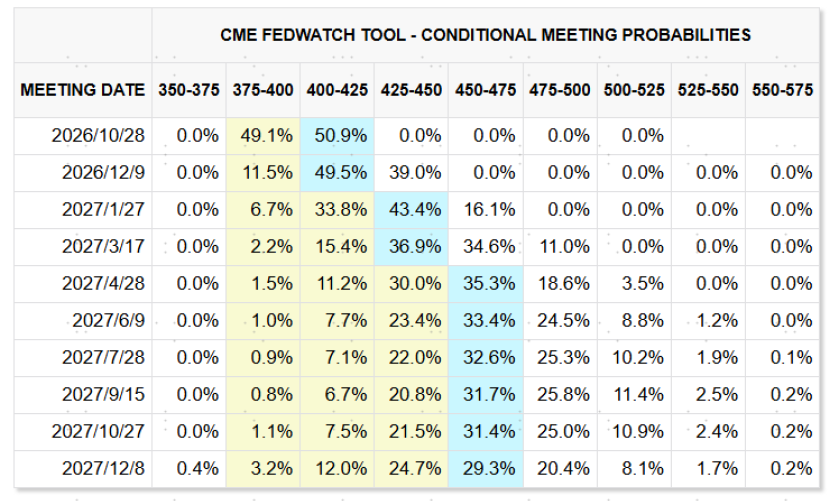
In the early morning of today Beijing time, the September FOMC officially concluded with the Federal Reserve raising interest rates by 25bps, bringing the benchmark rate to 3.75%~4%. This marks the Federal Reserve's first interest rate hike after the end of the rate hiking cycle in July 2023, followed by anticipated rate cuts in September 2024 and continuing in September 2025.
We mentioned as early as in the July FOMC commentary that the current environment has similarities to the "preemptive interest rate hikes" of 1997 (How can there be "preemptive interest rate hikes"?), and after Walsh’s hawkish turn at Jackson Hole in August, we indicated that from the perspective of maintaining the Federal Reserve's credibility, it would be better to raise rates in September (What does Walsh's hawkish turn mean?, What will happen if there is a rate hike?).
After the rate hike, the dollar rose above 100, the yield on 10-year U.S. Treasury bonds slightly increased to 5%, gold dipped slightly, while U.S. tech stocks fell slightly, and traditional stocks saw larger declines due to the impact of interest rates, such as real estate and banks. The market's overall reaction was limited, more pronounced on the sensitive dollar and traditional stocks, which is consistent with our indication in (What will happen if there is a rate hike?): the short-lived interest rate hikes or cuts are often priced in ahead of time, unless there are consecutive hikes (three times or more). The market's issue is often that they avoid preparing for rate hikes due to fears of their impacts, but once they see that the hike is unavoidable, they excessively worry about the impacts afterward. In fact, we believe that raising rates is not a bad thing, and not raising rates is not necessarily a good thing.
Chart: After the meeting, CME interest rate futures still imply an expectation for one more rate hike this year
Source: CME, CICC Research Department
So, now that we have reached this point, the market's focus is on whether one rate hike by the Federal Reserve is enough? What impact will it have on the market going forward? We will focus our analysis on this in this article.
Characteristics of this rate hike: Highly expected, neutral rate hike
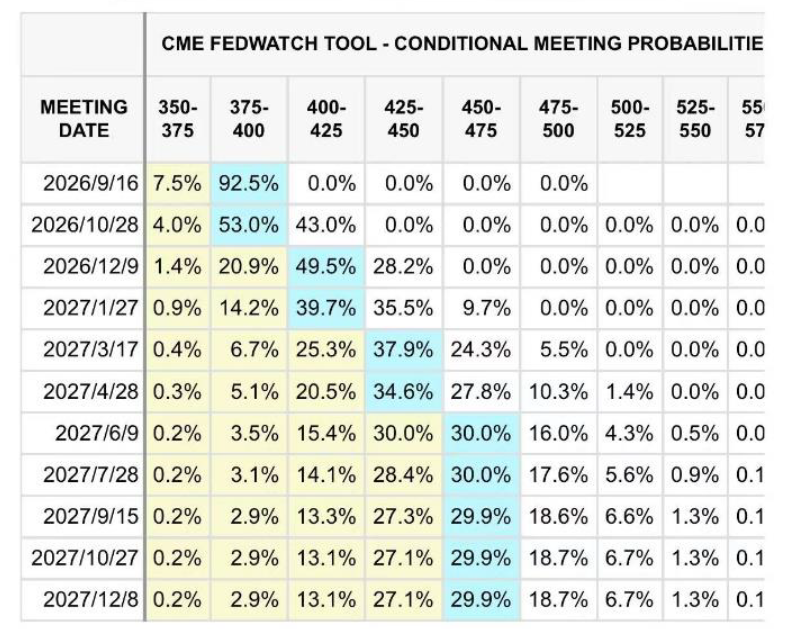
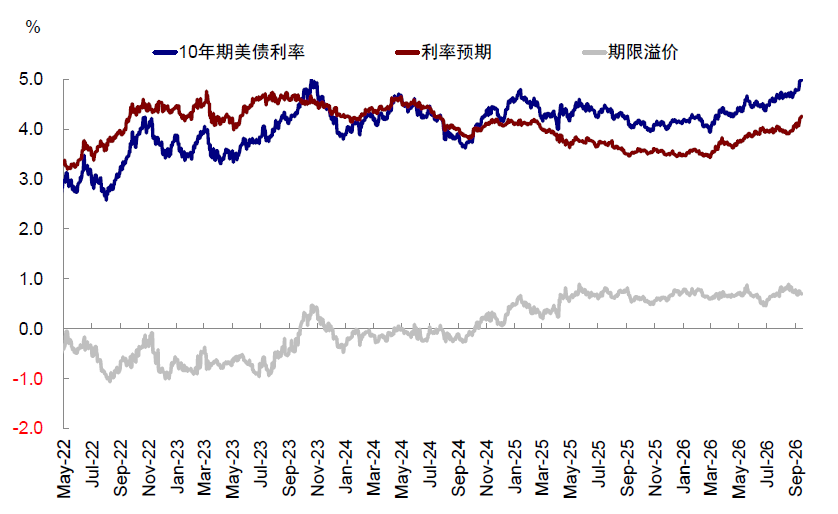
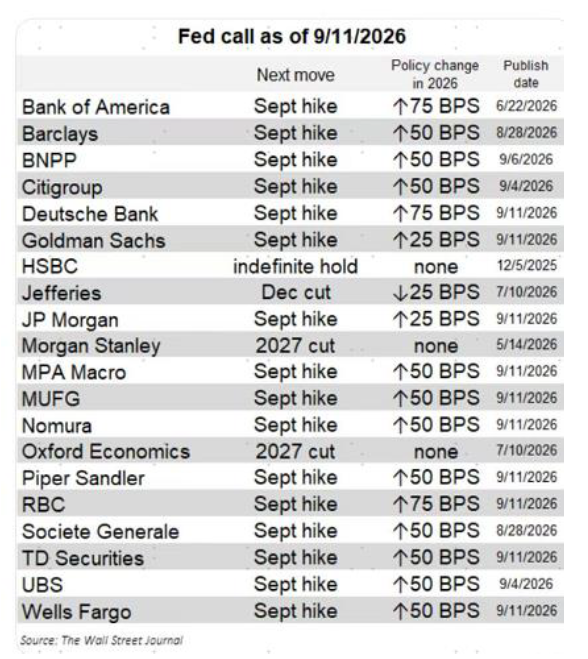
First, this rate hike is a highly anticipated hike: 1) The implied probability of a rate hike in September in CME interest rate futures has reached 93%; 2) The 10-year U.S. Treasury yield at 5% minus a 70bp term premium implies a remaining rate expectation of 4.3%, which suggests at least two further rate hikes; 3) Major Wall Street investment banks are all predicting a rate hike in September.
Chart: Implied probability of a September rate hike in CME interest rate futures reached 93% before the meeting
Source: CME, CICC Research Department
Chart: The current 5% U.S. Treasury yield reflects a 70bp term premium, with a remaining 4.3% rate expectation implying at least two more rate hikes
Source: Bloomberg, CICC Research Department
Chart: Major Wall Street investment banks all expected a rate hike in September before the meeting
Source: The Wall Street Journal, Nick Timiraos, CICC Research Department
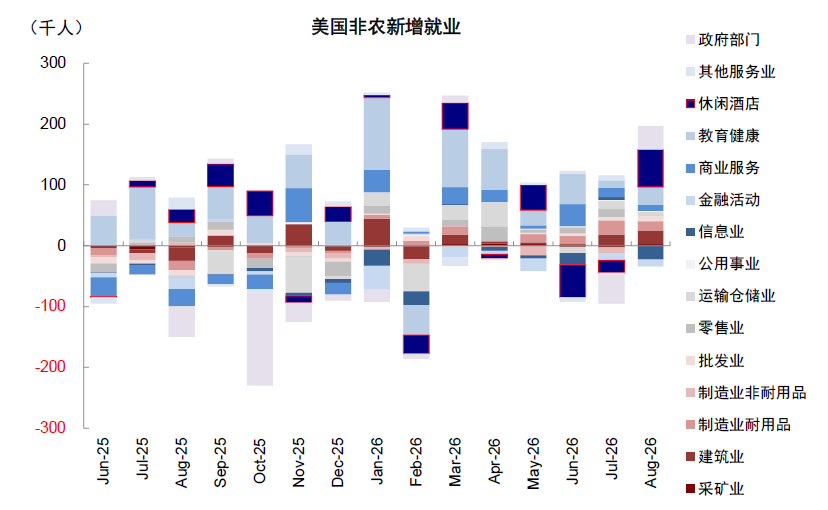
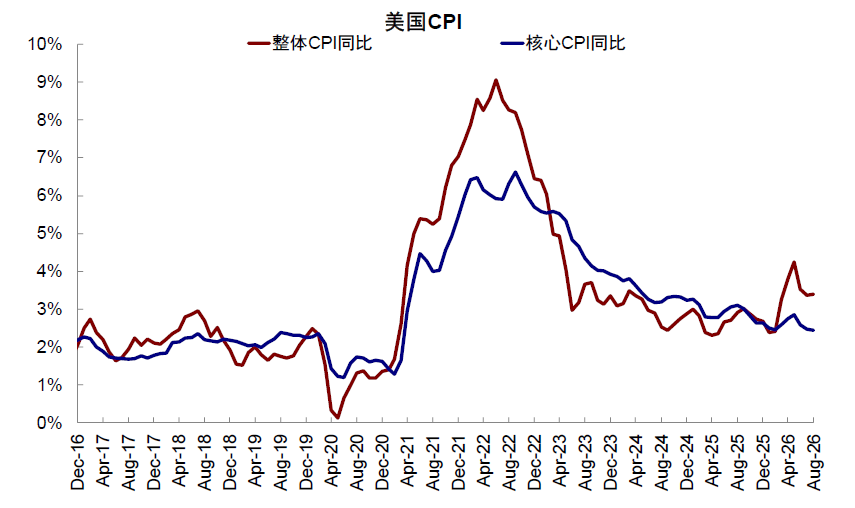
Secondly, this is an overall neutral rate hike: 1) The 25bp hike fully meets market expectations, and Walsh has stated he maintains consistency with the previous tone. After Walsh's hawkish turn at Jackson Hole in August, the August non-farm payrolls, PPI, and CPI exceeded expectations, forcing Walsh to fulfill his hawkish promise. For Walsh, this rate hike was "inevitable". Walsh’s speech this time was basically consistent with his statements at the August Jackson Hole meeting, emphasizing that current inflation levels remain above target, and the Federal Reserve's focus continues to be on price stability.
Chart: August non-farm payrolls added 162,000 jobs, far exceeding expectations
Source: Haver, CICC Research Department
Chart: August CPI met expectations overall, but the core CPI exceeded expectations month-on-month, causing the core CPI year-on-year to remain nearly flat compared to last month
Source: Haver, CICC Research Department
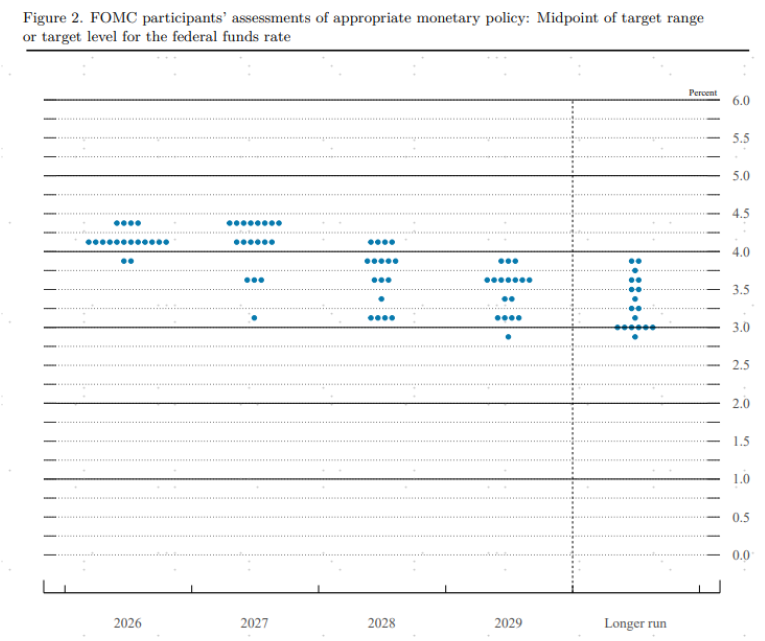
2) The "dot plot" indicates another rate hike in 2026, with the rate holding steady in 2027, somewhat alleviating market concerns about overly hawkish expectations. Although the reference significance of the dot plot has diminished because Walsh refused to provide his own forecast, it remains a reference the market is paying attention to. The median rate predictions from the remaining 18 committee members show that the "median" rate in 2026 rises to 4.125%, reflecting one more rate hike expectation compared to the June dot plot's median of 3.875%, suggesting that there is still one more rate hike expected this year, consistent with the market's broad expectation of two hikes; the 2027 median remains steady, which is less than the total of four rate hikes previously expected in CME interest rate futures.
Chart: The dot plot indicates a median rate of 4.125% in 2026, implying one more rate hike this year, with the rate steady in 2027
Source: Federal Reserve, CICC Research Department
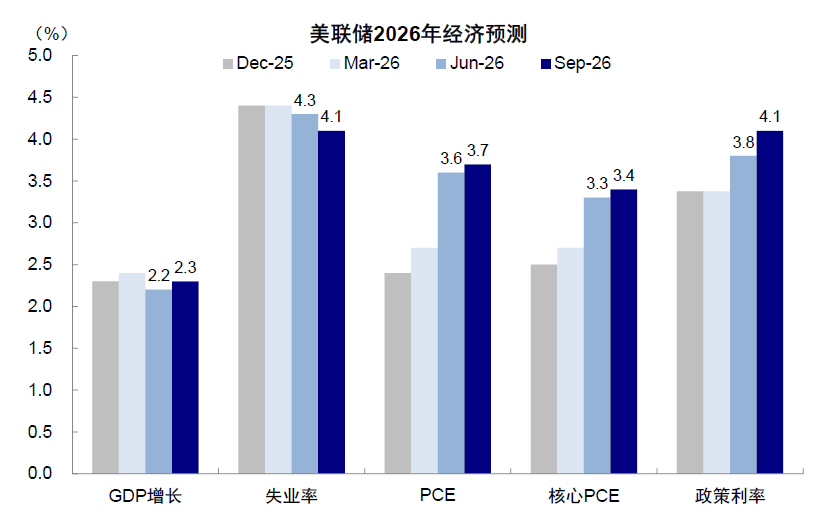
Chart: In September, the Federal Reserve raised its forecasts for inflation and growth in 2026, while lowering the unemployment rate forecast
Source: Federal Reserve, CICC Research Department
Is one rate hike by the Federal Reserve enough? There is no basis for consecutive and large rate hikes unless oil prices spiral out of control
After this highly anticipated rate hike, will the Federal Reserve implement consecutive and large rate hikes? From the statements of this meeting and the current fundamentals, there is no basis for consecutive and large rate hikes (three times or more), unless oil prices spiral out of control. High interest rates themselves will gradually transmit to financial conditions, thus suppressing economic growth, becoming a "reflexivity" factor that hinders further substantial rate hikes, as current 30-year mortgage rates in the U.S. are already approaching 7%.
First, from Walsh's statements at this meeting, he still avoids giving forward guidance on future interest rate trends, with the tone of the press conference continuing the stance from the Jackson Hole meeting that the Federal Reserve's focus remains on price stability, without much overly hawkish content [1].
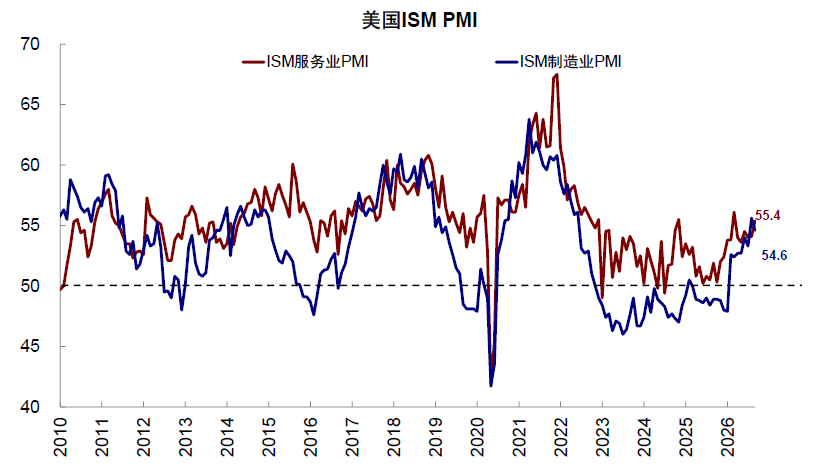
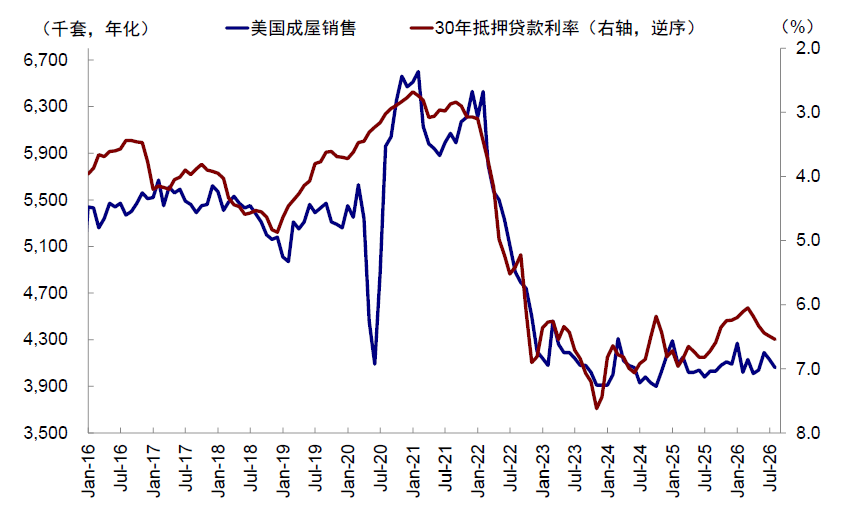
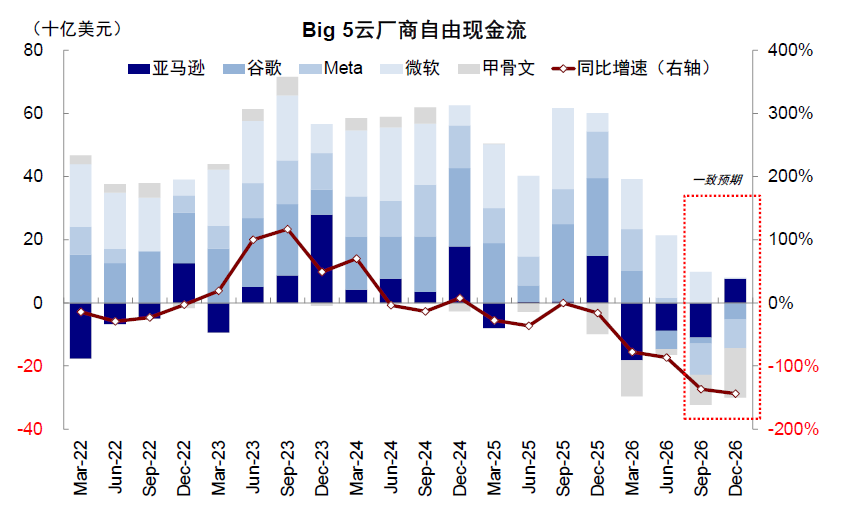
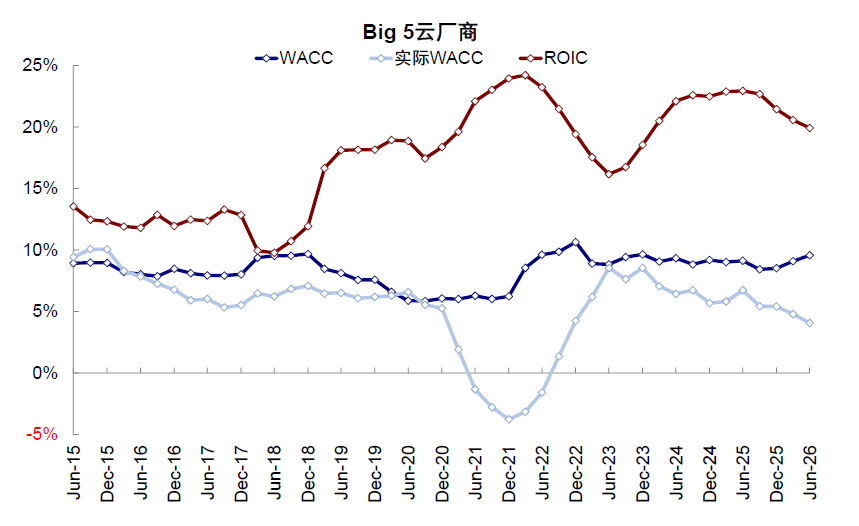
Secondly, from the perspective of the U.S. economic fundamentals, high interest rates will also suppress traditional demand, even stifle AI investment, hindering the Federal Reserve's ability to continue raising rates, forming a "reflexivity" of interest rates. Currently, the U.S. economy is K-shaped, and the rising rates will inversely suppress traditional demand, thereby inhibiting significant rate hikes from a "reflexivity" perspective. In fact, traditional demand in the U.S. has already been suppressed by high rates, especially in rate-sensitive real estate and investment sectors. The ISM manufacturing PMI fell from a July peak of 55.6 to 54.6 in August, with existing home sales also retreating again under the pressure of high rates. As an important growth engine, AI has seen a slowdown in its leading ARR growth and its free cash flow has gradually turned negative, increasing its dependence on external financing. Faced with bottlenecks on the demand side, if financing costs rise significantly, it will weaken the willingness for capital expenditure, thus affecting overall growth. In other words, rate hikes may lead to an inability to raise rates significantly.
Chart: In August, the U.S. ISM manufacturing PMI fell to 54.6
Source: Haver, CICC Research Department
Chart: The recent rise in rates is pushing real estate data back down
Source: Haver, CICC Research Department
Chart: Except for Microsoft and Meta, other cloud providers turned negative cash flow in the second quarter
Source: FactSet, CICC Research Department
Chart: Current cloud providers have a weighted ROIC of 19.9%, which is higher than WACC's 9%
Source: FactSet, CICC Research Department
Unless oil prices spiral out of control. We estimate that if oil prices remain above $100 or higher, then CPI will not be able to continue to decline, which will put greater pressure on the Federal Reserve, and will also place greater pressure on Trump, who will face mid-term elections in November. We estimate that if oil prices drop to an average of $80 in the third and fourth quarters, CPI year-on-year will likely fall to around 3.0% by the end of the year.
Chart: We forecast that if oil prices average no more than $100, U.S. CPI year-on-year will likely fall at the end of the year
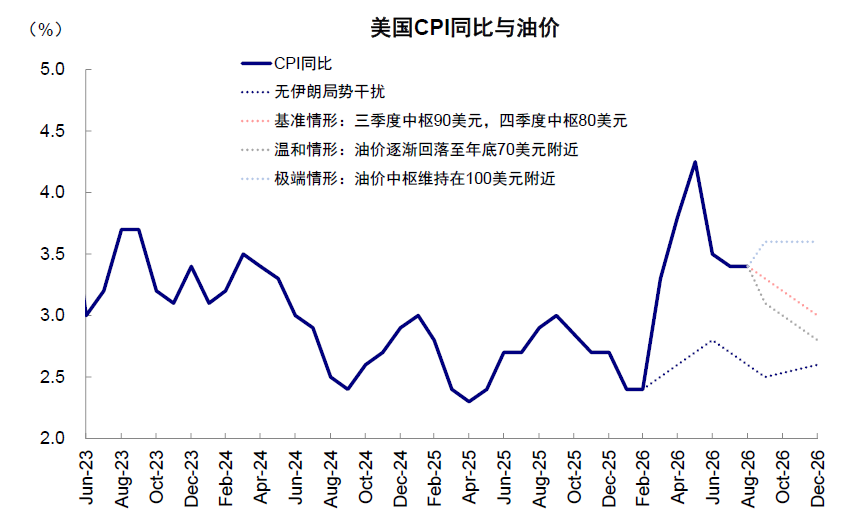
Source: Haver, CICC Research Department
Impact of rate hikes on the market? Short-term interest rate hikes are often priced in ahead of time, and the market often "moves in the opposite direction"
We have pointed out multiple times that for the market, this interest rate hike may not necessarily be a bad thing, and not raising rates may not be a good thing.
Short-term preventive interest rate hikes, while "satisfying" the market's need to reshape trust in the Federal Reserve and U.S. Treasury, are often priced in ahead of time, so the market tends to "move in the opposite direction." When realized, this could coincide with the peak of U.S. Treasury rates and the trough of U.S. equity markets, similar to the single rate hike by Greenspan in 1997 and also the anticipated short-term rate cuts in 2024-2025 (What will happen if there is a rate hike?). In contrast, only sustained large rate hikes would create long-term and significant impacts on actual growth and financial markets through increased financing costs and tighter financial liquidity, as exemplified by the 525bps increase following the Russia-Ukraine conflict in 2022 to combat high inflation. Therefore, for short-term rate hikes, disturbances may actually provide better buying opportunities.
Looking back at the historical experience of past rate hike cycles since 1990, initial disturbances in the market typically resolve within an average of 0-2 months, with a lower impact from preemptive interest rate hikes.
We reviewed the six rate hike cycles by the Federal Reserve since 1990: 1) U.S. Treasuries generally decline before rate hikes, and after the realization of preemptive rate hikes, U.S. Treasuries often turn upwards. After previous rate hikes, U.S. Treasuries typically turned upward 18 days afterward (the data represents the median performance of rate hikes since 1990). After the preemptive rate hike in 1997, long-term Treasury rates quickly peaked and declined. 2) U.S. equities experience disturbances after rate hikes, but tend to rebound on average within 2 months, with faster rebounds following preemptive rate hikes. The S&P 500 typically declines 4.7% over an average of 59 days post-rate hike before recovering, while the Nasdaq declines 8.1% over an average of 68 days before resuming upward movement, rebounding faster after the preemptive rate hike cycle in 1997, with the S&P down 6.5% over 17 days before turning upward, and the Nasdaq only down 3.8% over 8 days before recovering. 3) Gold behaves similarly, usually experiencing an average decline of 2.3% after 82 days before turning upwards. 4) The dollar often appreciates more during rate hike anticipation periods, and does not necessarily experience a large rise post-rate hike, unless the rate hikes are continuous and significant like in 2022. 5) A-shares and H-shares have fluctuating reactions post-rate hikes, more influenced by domestic fundamentals. For instance, following the preemptive rate hike by the Federal Reserve in 1997, domestic economic recovery along with the expectations of Hong Kong’s return propelled both A and H shares to continue rising.
Chart: Reviewing historical experiences of past rate hike cycles since 1990, initial disturbances in the market happen, but typically the market rebounds within an average of 0-2 months, with lower impacts from preemptive rate hikes
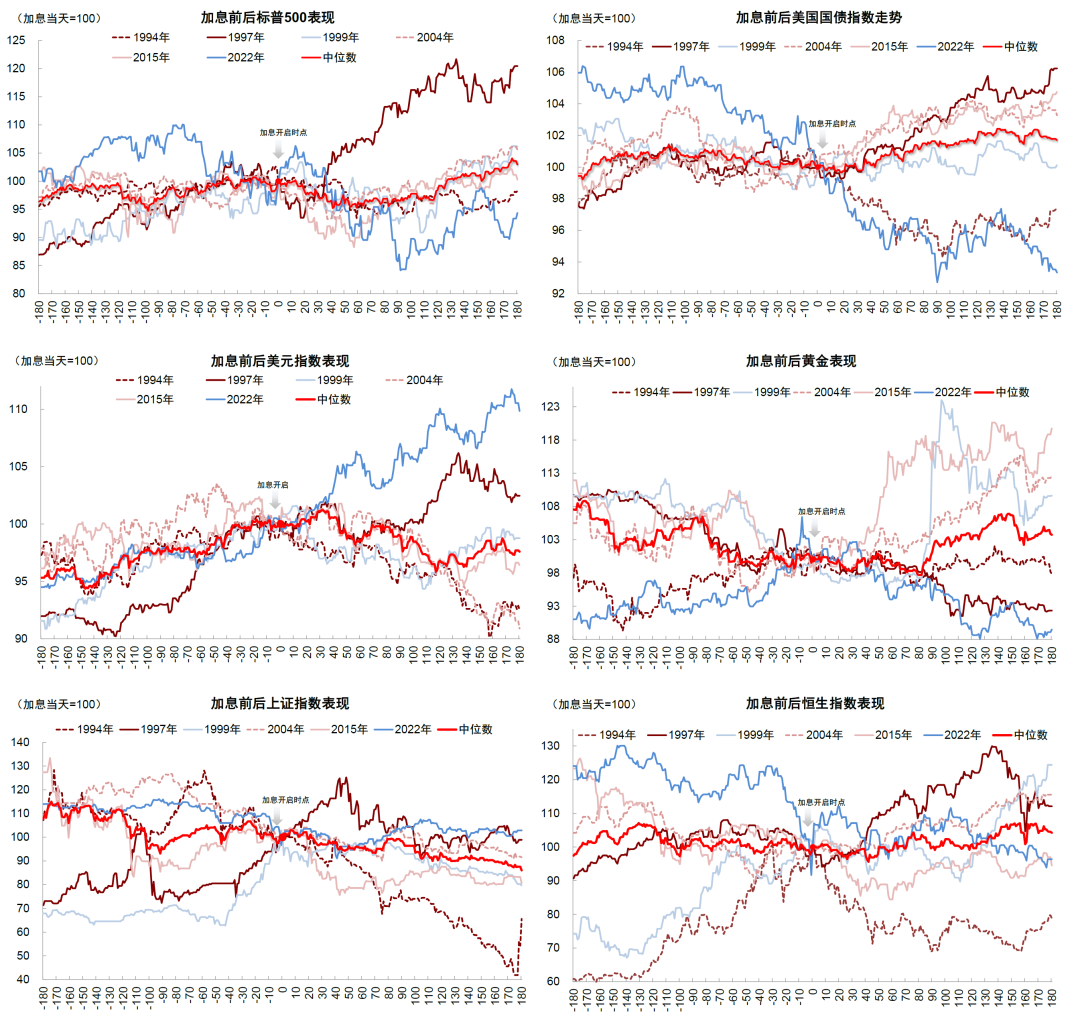
Source: Bloomberg, CICC Research Department
From the pricing in of expected rate hikes over the next year across various asset classes, interest rate futures (3.0 times) > copper (1.6 times) > U.S. Treasuries (1.0 times) = Fed dot plot (1.0 times) > gold (0.8 times) > Dow Jones (0.1 times) > S&P 500 (-0.5 times) > Nasdaq (-1.1 times), indicating that copper, U.S. Treasuries, and gold reflect more heightened expectations for rate hikes. Specifically:
Chart: Current copper, U.S. Treasuries, and gold reflecting the most rate hike expectations, while equity markets are relatively optimistic
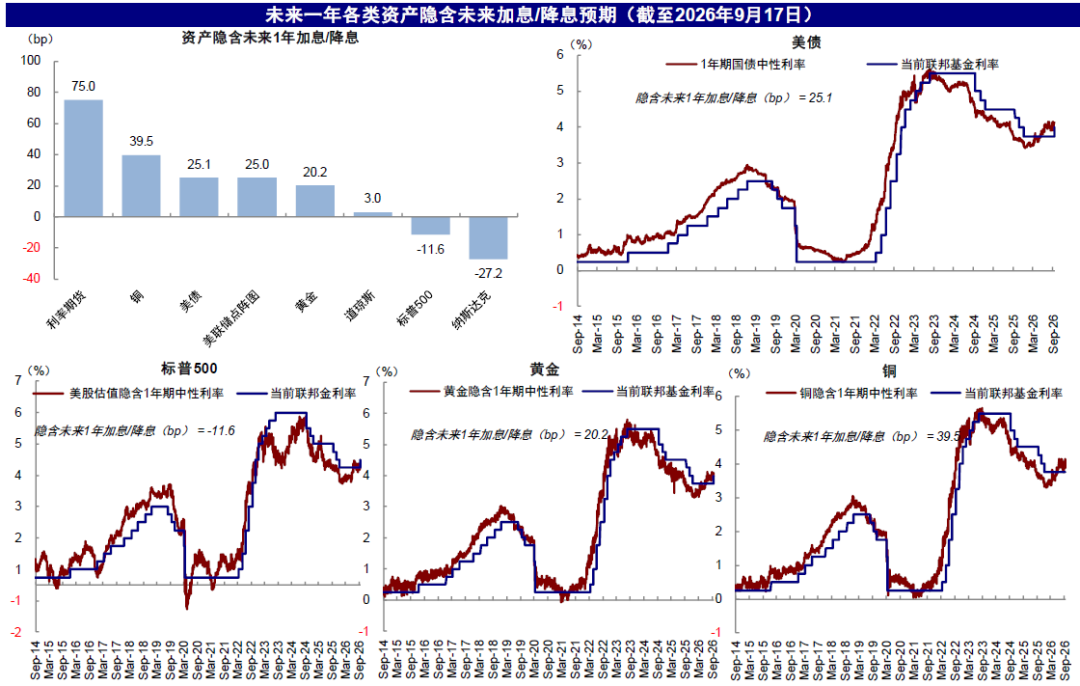
Source: Bloomberg, CICC Research Department
► U.S. Treasuries: first repair the term premium, long-end nominal rates may gradually peak or even decline, reflecting "odds" and trading opportunities. Current long-term bond yields have fully priced in one more rate hike this year; assuming the Federal Reserve raises rates once more this year, the corresponding 10-year U.S. Treasury yield would be around 4.8-5%. The Federal Reserve's fulfillment of its hawkish commitments will help solidify its credibility, thereby alleviating upward pressure on long bond term premiums.
Chart: If the Federal Reserve raises rates once more this year, it corresponds to long bond yields of 4.8~5%
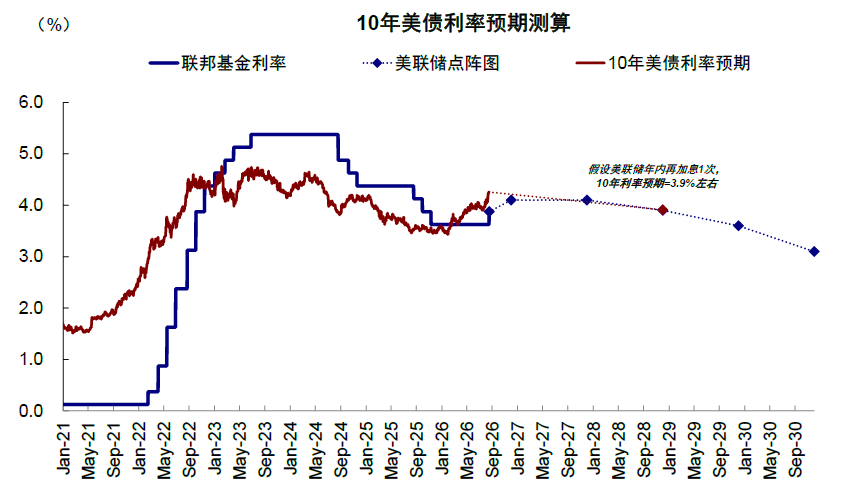
Source: Haver, Federal Reserve, CICC Research Department
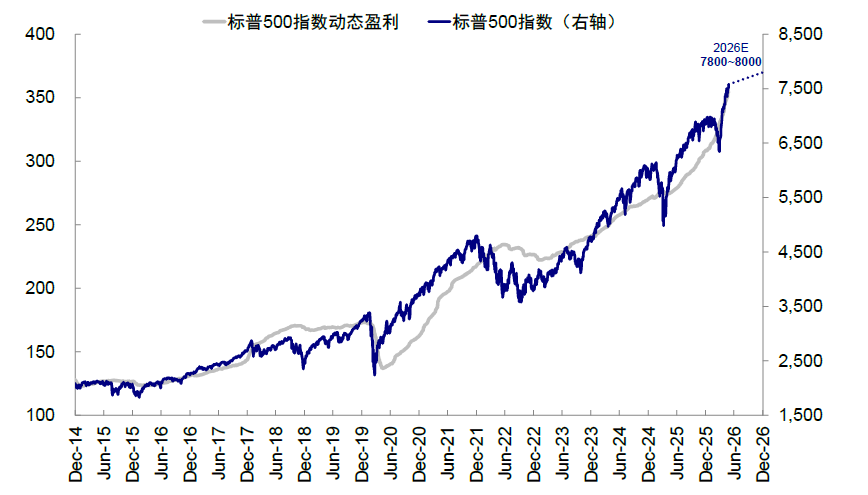
► U.S. equities: not pessimistic, short-term disturbances may provide better entry opportunities. In our mid-year outlook in June, we further raised the S&P 500 target to 7800-8000 (The "different paths but same destination" K-shaped differentiation). The market’s struggles at this target level are influenced not only by liquidity disturbances from rising rates but also by worries about insufficient returns stemming from a slowdown in AI demand. Overall valuation is not expensive; with the realization of rate hikes, if there are new catalysts for AI industry development, U.S. equities still have upside potential, and significant disturbances in the short term could provide better buying points.
Chart: Under base case, we raised our mid-year target for the S&P 500 in 2026 to 7800~8000
Source: Bloomberg, CICC Research Department
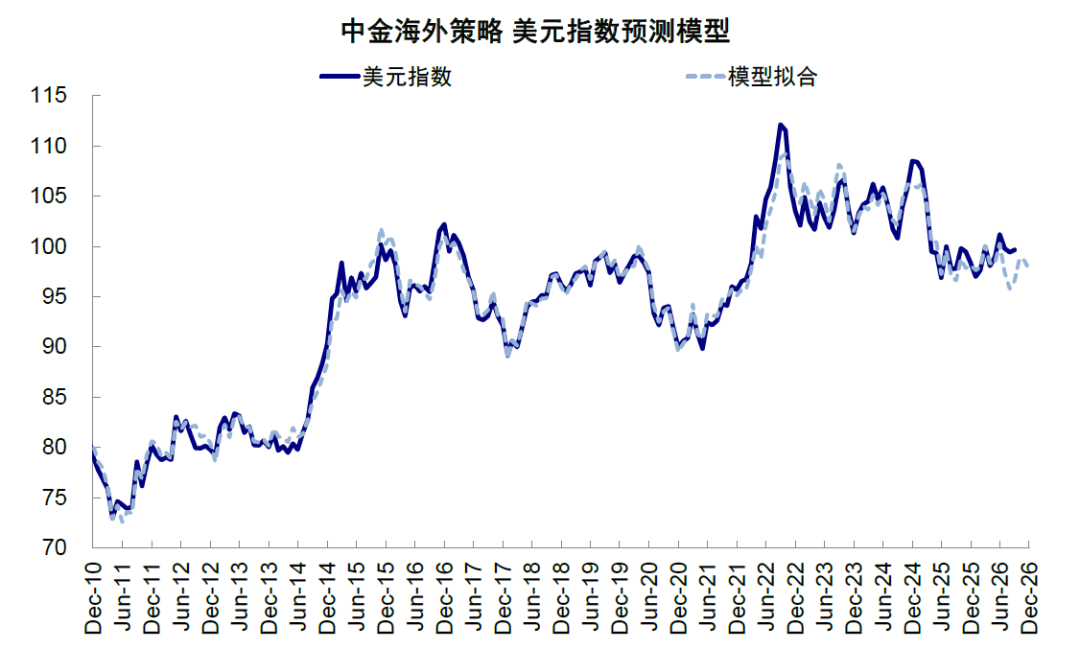
► Dollar: Short-term boosted by credibility and interest rate differentials from the rate hikes, we still expect overall to maintain a fluctuating pattern. In the short term, the dollar is still buoyed by the credibility brought by rate hikes and interest rate differentials, combined with the resilience of the U.S. economy, we still expect the dollar index to fluctuate within the 96~99 range.
Chart: We expect the dollar index will fluctuate within the range of 96~99 by the end of the year, without significant weakening.
Source: Haver, Bloomberg, CICC Research Department
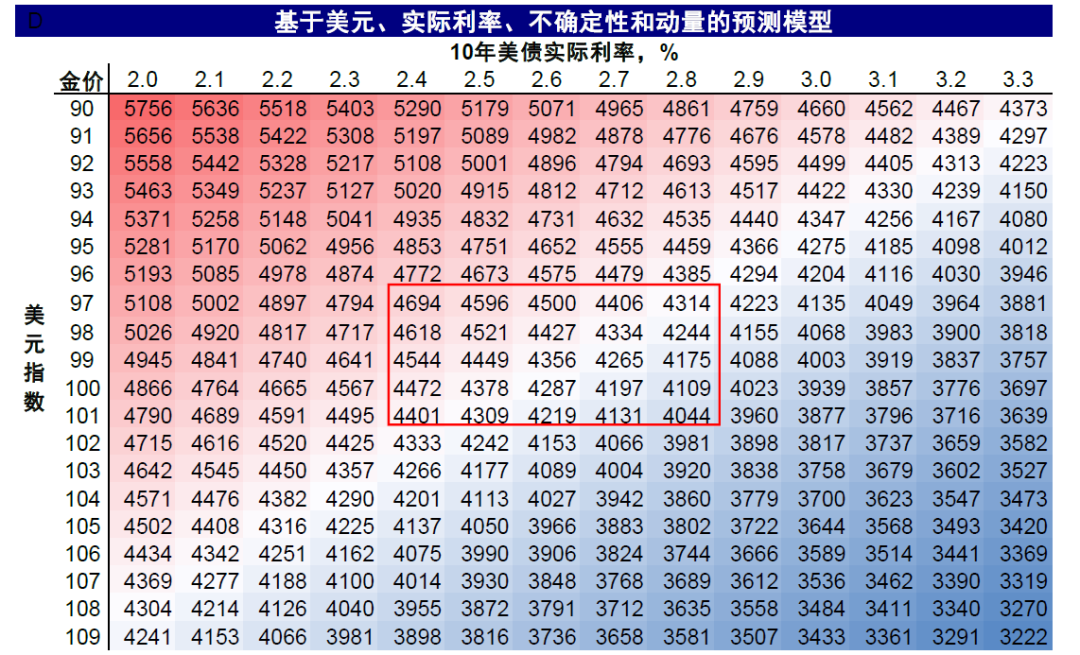
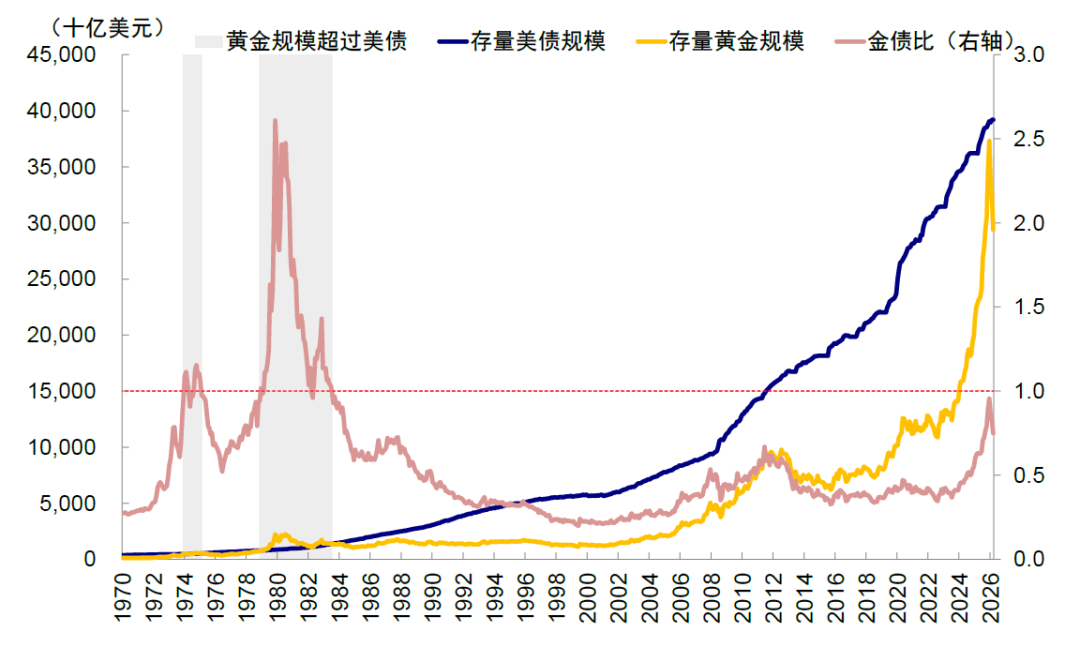
► Gold: The space for no rate hikes is greater than for hikes; currently more similar to uncertain bullish options regarding upward space. Based solely on static calculations from U.S. Treasury yields and dollars, we estimate gold support levels at around $4200-4500. Unless there are consecutive rate hikes, the downward pressure on gold is relatively controllable, but upward space requires greater grand narratives. The Federal Reserve's decision not to raise rates could create a narrative of trust loss and de-dollarization for gold, while rate hikes undermine this narrative, thus limiting the upward space compared to when rates are not raised, requiring further narrative catalysts.
Chart: Our static calculations suggest that the current support for gold price from dollars and real rates is around $4200~4500 per ounce
Source: Wind, CICC Research Department
Chart: When gold prices exceed $5500, facing conflicts of the old and new systems, there will be significant volatility
Source: Haver, IMF, World Gold Council, UCGS, CICC Research Department
[1]https://www.federalreserve.gov/mediacenter/files/FOMCpresconf20260916.pdf
Source
Source of the article
This article is excerpted from "Is One Rate Hike by the Federal Reserve Enough?" published on September 17, 2026.
Liu Gang, CFA Analyst SAC License No.: S0080512030003 SFC CE Ref: AVH867
Xiàng Xīnlì Analyst SAC License No.: S0080526050001 SFC CE Ref: BXU271
Yang Xuān Tíng Analyst SAC License No.: S0080524070028 SFC CE Ref: BXS665
Hao Yuèning Contact SAC License No.: S0080125070024
免责声明:本文章仅代表作者个人观点,不代表本平台的立场和观点。本文章仅供信息分享,不构成对任何人的任何投资建议。用户与作者之间的任何争议,与本平台无关。如网页中刊载的文章或图片涉及侵权,请提供相关的权利证明和身份证明发送邮件到support@aicoin.com,本平台相关工作人员将会进行核查。


