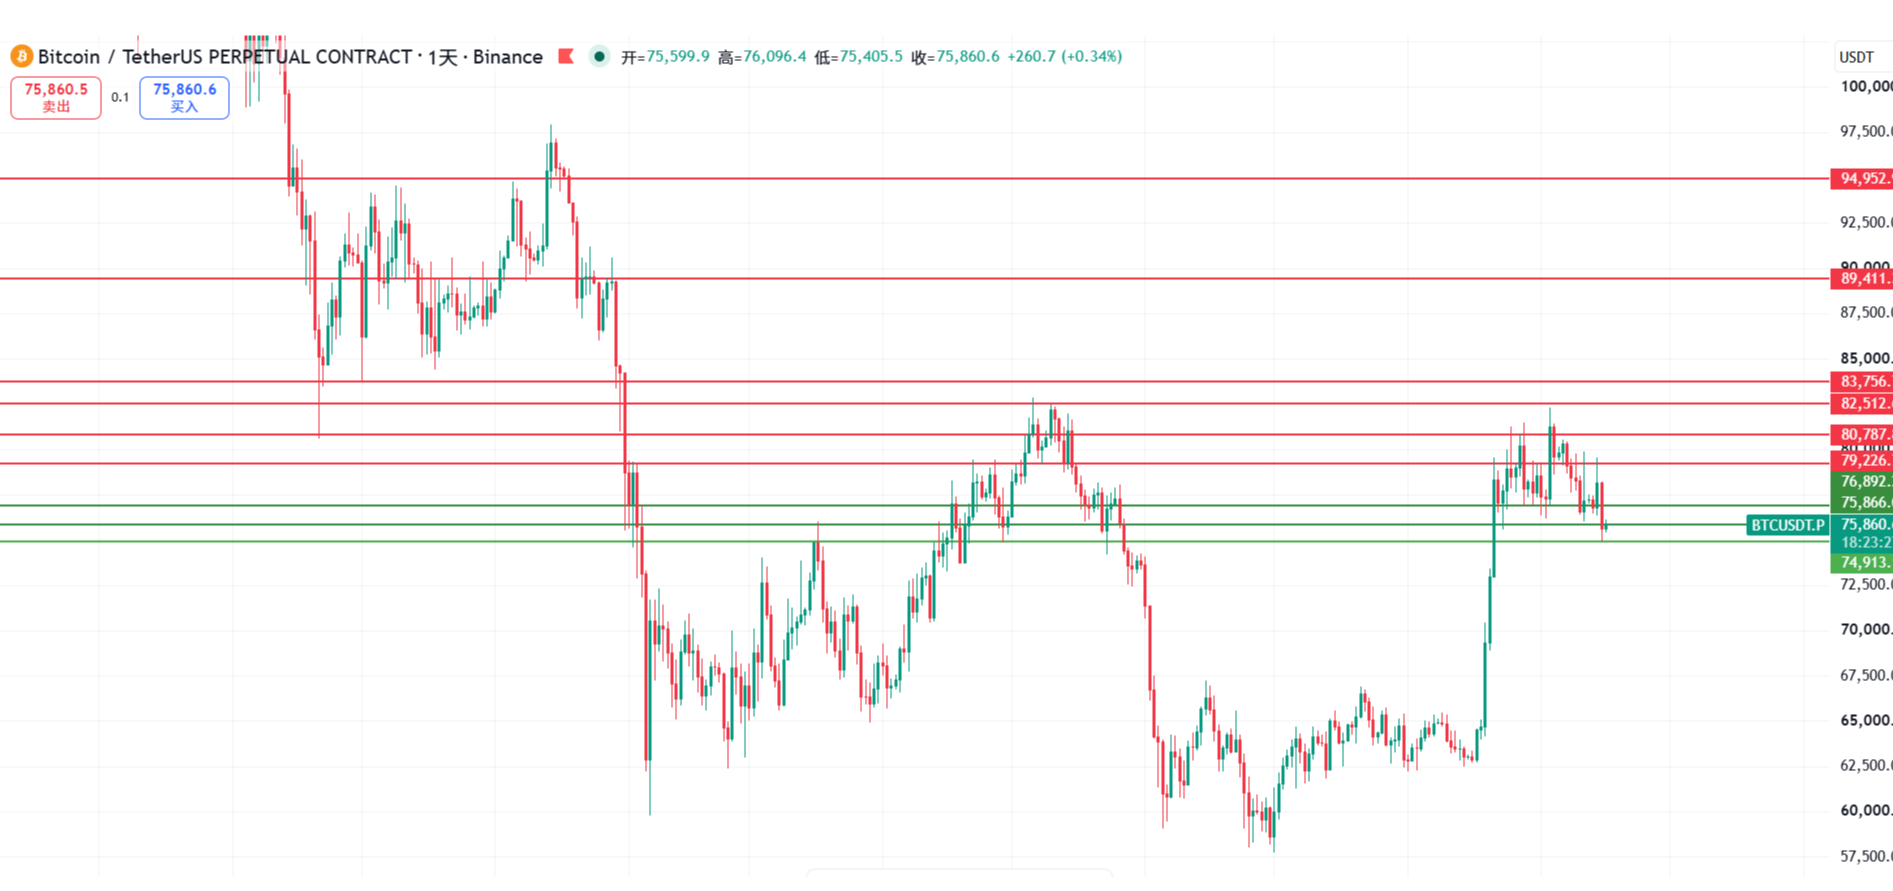
The market from yesterday has already shown early signs of short-term weakness, with a key focus on the 77,400 level above. On the morning of September 15, Bitcoin gradually retreated after peaking around 79,500, essentially giving back the gains from the previous day.
After the price fell to around 75,600 during the trading session, a rebound occurred, but it never broke through 77,400. I have repeatedly emphasized that the 76,600—75,500 area remains an important observation zone; as long as there is no effective breakdown, the possibility of a rebound and support at low levels still exists, with 74,800 being the maximum allowed spike position previously given.
Failed to break 77,400; short-term weakness further confirmed
Last night, the price once again faced resistance after a rise, followed by an accelerated decline, reaching a low of around 74,900.
The previous 76,000—76,500 area has consistently provided important support during this round of market movement, but this time the price saw a genuine effective breakdown. More critically, although the price briefly recovered after the breakdown, it never stabilized again and weakened further.
Thus, from the 4-hour structure, the former support at 76,000 has gradually transformed into a short-term competition position, while 76,500 and 77,400 constitute more obvious pressure areas above.
Currently, the 4-hour downtrend structure still exists; unless it can stabilize above 77,400 again, the current low-level consolidation is more inclined towards a correction within the declining process rather than a trend reversal.
Daily sharing of real-time trading strategies, providing free position diagnosis, ideas for reducing losses, and practical market insights. Scan to follow the official WeChat account《Bright Star Planet》,Join the community for strategies!!
Daily line enters a deeper retracement, but it cannot yet be directly defined as a trend reversal
From the daily line perspective, this round of market movement has been operating within the large range of 75,500—82,800.
This time, the price has dipped to 74,900, and although it briefly fell below 75,500, the daily close remained above 75,500, so it cannot yet be simply defined as an effective breakdown.
However, it is worth noting that today's daily close has already fallen below the previously concentrated closing area around 76,500, indicating that the level of retracement on the daily line has significantly deepened, and short-term weakness has been confirmed.
But from a larger upward structure perspective, the rise since July has not been completely destroyed. Even if the price further falls to around 72,900, from the current Fibonacci structure, it still belongs to the retracement phase within the upward process, thus, the long-term bullish structure cannot be judged solely based on this position.
Daily sharing of real-time trading strategies, providing free position diagnosis, ideas for reducing losses, and practical market insights. Scan to follow the official WeChat account《Bright Star Planet》,Join the community for strategies!!
Weekly line still in a major repair phase
Looking at the weekly line, even though the price has been continuously retreating from above 82,000, it is still in the backtesting phase of the rebound structure since late June and early July.
After forming a low near 57,000, the market produced a major repair trend, reaching a peak around 82,800, but still did not break through the previous high from May.
Therefore, from the weekly line perspective, what can be confirmed is that this week's market continues to lean weak, but the weekly candlestick has not yet completed; whether a continuous weekly bearish candlestick forms still needs to wait for this week's closing for further confirmation.
In other words, the current weakness is mainly concentrated in the daily line and shorter periods, while the mid-to-long-term background of the upward trend has not yet been completely destroyed.
Daily sharing of real-time trading strategies, providing free position diagnosis, ideas for reducing losses, and practical market insights. Scan to follow the official WeChat account《Bright Star Planet》,Join the community for strategies!!
Moving average system: 76,600—78,000 becomes a rebound resistance zone
Regarding moving averages, the short-term moving averages on the hourly, 4-hour, and daily charts are currently all pressed above the price.
The 4-hour BBI is currently located near 76,600, the short-term daily moving average is concentrated around 76,700, while the daily BBA is located around 77,300.
Therefore, if a rebound occurs in the future, the first resistance to face will be the clustered pressure around 76,000, 76,500, 76,600—76,700, and 78,000.
The mid-to-long-term moving average support below mainly focuses on the area of 68,000—71,000.
If one day the daily line truly and effectively breaks below 75,500, a significant price vacuum area will appear below, which will need to focus on preventing the market from further seeking support near 73,000 or even 71,000.
Daily sharing of real-time trading strategies, providing free position diagnosis, ideas for reducing losses, and practical market insights. Scan to follow the official WeChat account《Bright Star Planet》,Join the community for strategies!!
Position volume: it cannot yet be confirmed that 74,900 is the bottom
From the perspective of position volume, this round of market movement is also worth noting.
When the price increased earlier, total positions increased; then when the price rose and retreated, positions decreased for a time. However, after noon yesterday, while the price continued to weaken, total positions increased continuously.
This combination of "price drop, position increase" leans more towards new short funds entering.
Although an obvious spike was seen around 74,900, and positions began to contract and stabilize thereafter, the current situation does not yet confirm that 74,900 has formed a bottom.
In other words, although support has emerged at low levels, short positions have not completely exited; therefore, even if a rebound occurs subsequently, there may still be pressure above.
Daily sharing of real-time trading strategies, providing free position diagnosis, ideas for reducing losses, and practical market insights. Scan to follow the official WeChat account《Bright Star Planet》,Join the community for strategies!!
Bollinger Bands and MACD: Downward speed slows, but rebound has not yet formed
In terms of Bollinger Bands, the hourly line once broke below the lower band and then recovered, but currently, the price is still below the middle band, approximately around 76,300.
The 4-hour Bollinger Bands have begun to expand downwards; although the price fell below the lower band and some recovery ensued, it did not return to near the middle band, hence the overall downward channel structure on the 4-hour chart remains unchanged for the time being.
The daily line is also in the lower half of the Bollinger Bands, with the middle band currently around 78,000, and downward expansion signs have appeared in the Bollinger Bands.
Regarding MACD, the bearish momentum on the hourly line has begun to contract, indicating that the most urgent and fastest phase of decline has temporarily slowed.
However, the 4-hour MACD remains bearish, with no significant weakening of bearish momentum; after the death cross on the daily line, the retracing momentum has actually increased again.
Therefore, the current most notable characteristic is the clear layering among different periods:
Hourly line's downward speed begins to slow;
4-hour remains bearish;
Daily line's retracement intensity increases;
Weekly line still retains a major level rebound background.
Daily sharing of real-time trading strategies, providing free position diagnosis, ideas for reducing losses, and practical market insights. Scan to follow the official WeChat account《Bright Star Planet》,Join the community for strategies!!
74,900 is the current most important short-term defense line
From the trend line and Fibonacci structure perspectives, the area around 74,900 is currently a very critical position.
If 74,900 can continue to provide support, then short-term consolidation may first occur between 74,900—76,000, with the possibility of a repair towards around 76,500.
But if 74,900 once again gets effectively broken, the next important support will arrive around 72,900.
It is noteworthy that both the 4-hour Fibonacci and the daily Fibonacci ultimately point towards 72,900, making this area a very important support zone to watch in the upcoming market.
Summary: Short-term bearish, but mid-to-long-term trend reversal not yet confirmed
Considering all periods, the current judgment remains consolidating bearish.
The rapid drop phase has slowed down, but a true low-level rebound has not yet formed. Therefore, it is more likely that the price will first consolidate around 74,900—76,000, and even if a rebound occurs, it is crucial to observe whether it can stabilize again around 76,500.
Before the 4-hour downtrend structure and bearish momentum show significant reversal, the current rebound is still more suitable to be defined as a repair during a downward process.
From the perspective of higher time frames, the upward structure since July has not been completely destroyed, which is why it cannot be directly defined as a complete mid-to-long-term trend reversal.
The next key points to watch are two positions:
Look above to see if 76,500—77,400 can be recaptured; look below to see if 74,900 can hold.
If 74,900 is effectively broken again, then the next target should focus on 72,900.
Before there is an effective breakdown below 72,900, it is still too early to directly define the mid-to-long-term trend as fully bearish.
Daily sharing of real-time trading strategies, providing free position diagnosis, ideas for reducing losses, and practical market insights. Scan to follow the official WeChat account《Bright Star Planet》,Join the community for strategies!!

免责声明:本文章仅代表作者个人观点,不代表本平台的立场和观点。本文章仅供信息分享,不构成对任何人的任何投资建议。用户与作者之间的任何争议,与本平台无关。如网页中刊载的文章或图片涉及侵权,请提供相关的权利证明和身份证明发送邮件到support@aicoin.com,本平台相关工作人员将会进行核查。