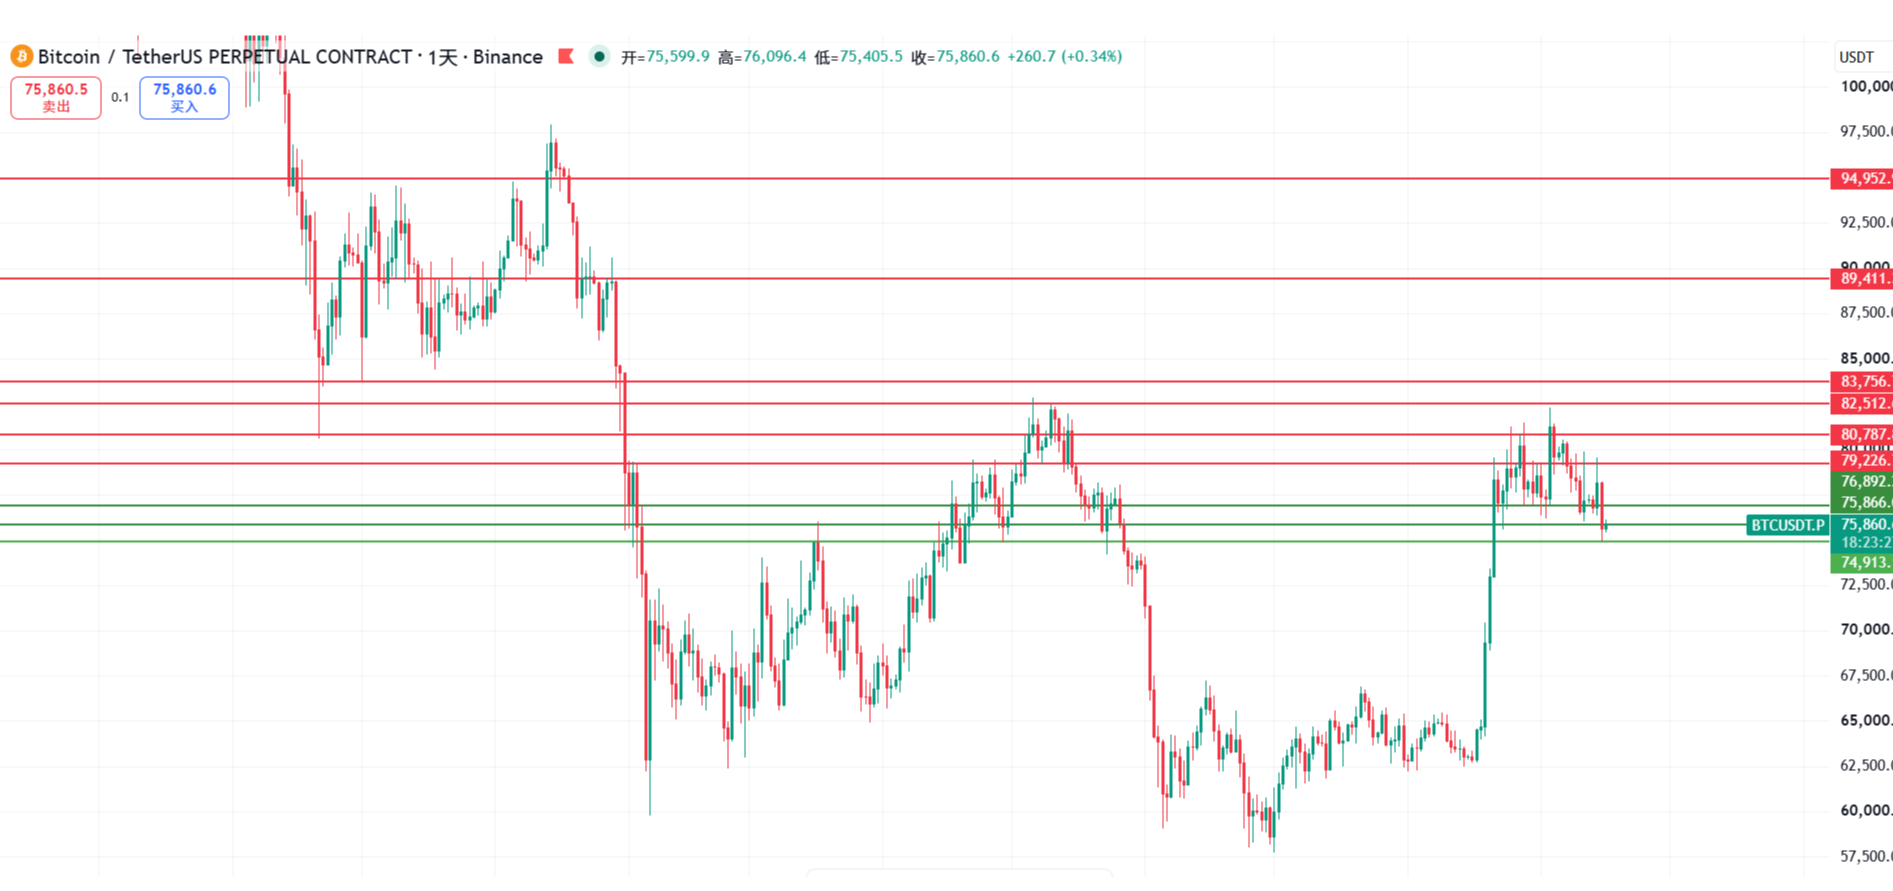
First, let's look at two major news items. The first is that the August CPI exceeded expectations, pushing the Federal Reserve's interest rate hike probability in September to 78%. JPMorgan has raised its interest rate hike expectations for 2026 to two times, and the anticipation of tightening liquidity is broadly suppressing risk assets. The second item is that Bitcoin has fallen below the key support level of $77,000, with Jiang Zhuoer clearly warning that if BTC drops below $76,500, it will accelerate the decline. Together, these two messages constitute the core conflict of today's market: macro liquidity tightening meets urgent technical key support, and BTC is in a very sensitive position.
The current time is September 16, 12:46, and the latest BTC quote is 75,953 USDT, with a 24-hour decline of 2.49% and a market share of 58.54%. The fear and greed index is at 51, indicating a neutral range. Note that this neutral reading has emerged after a continuous decline, suggesting that market sentiment has not yet entered extreme panic, which means that if the key support is effectively broken, panic selling may not have fully released, leaving room for further acceleration downward.
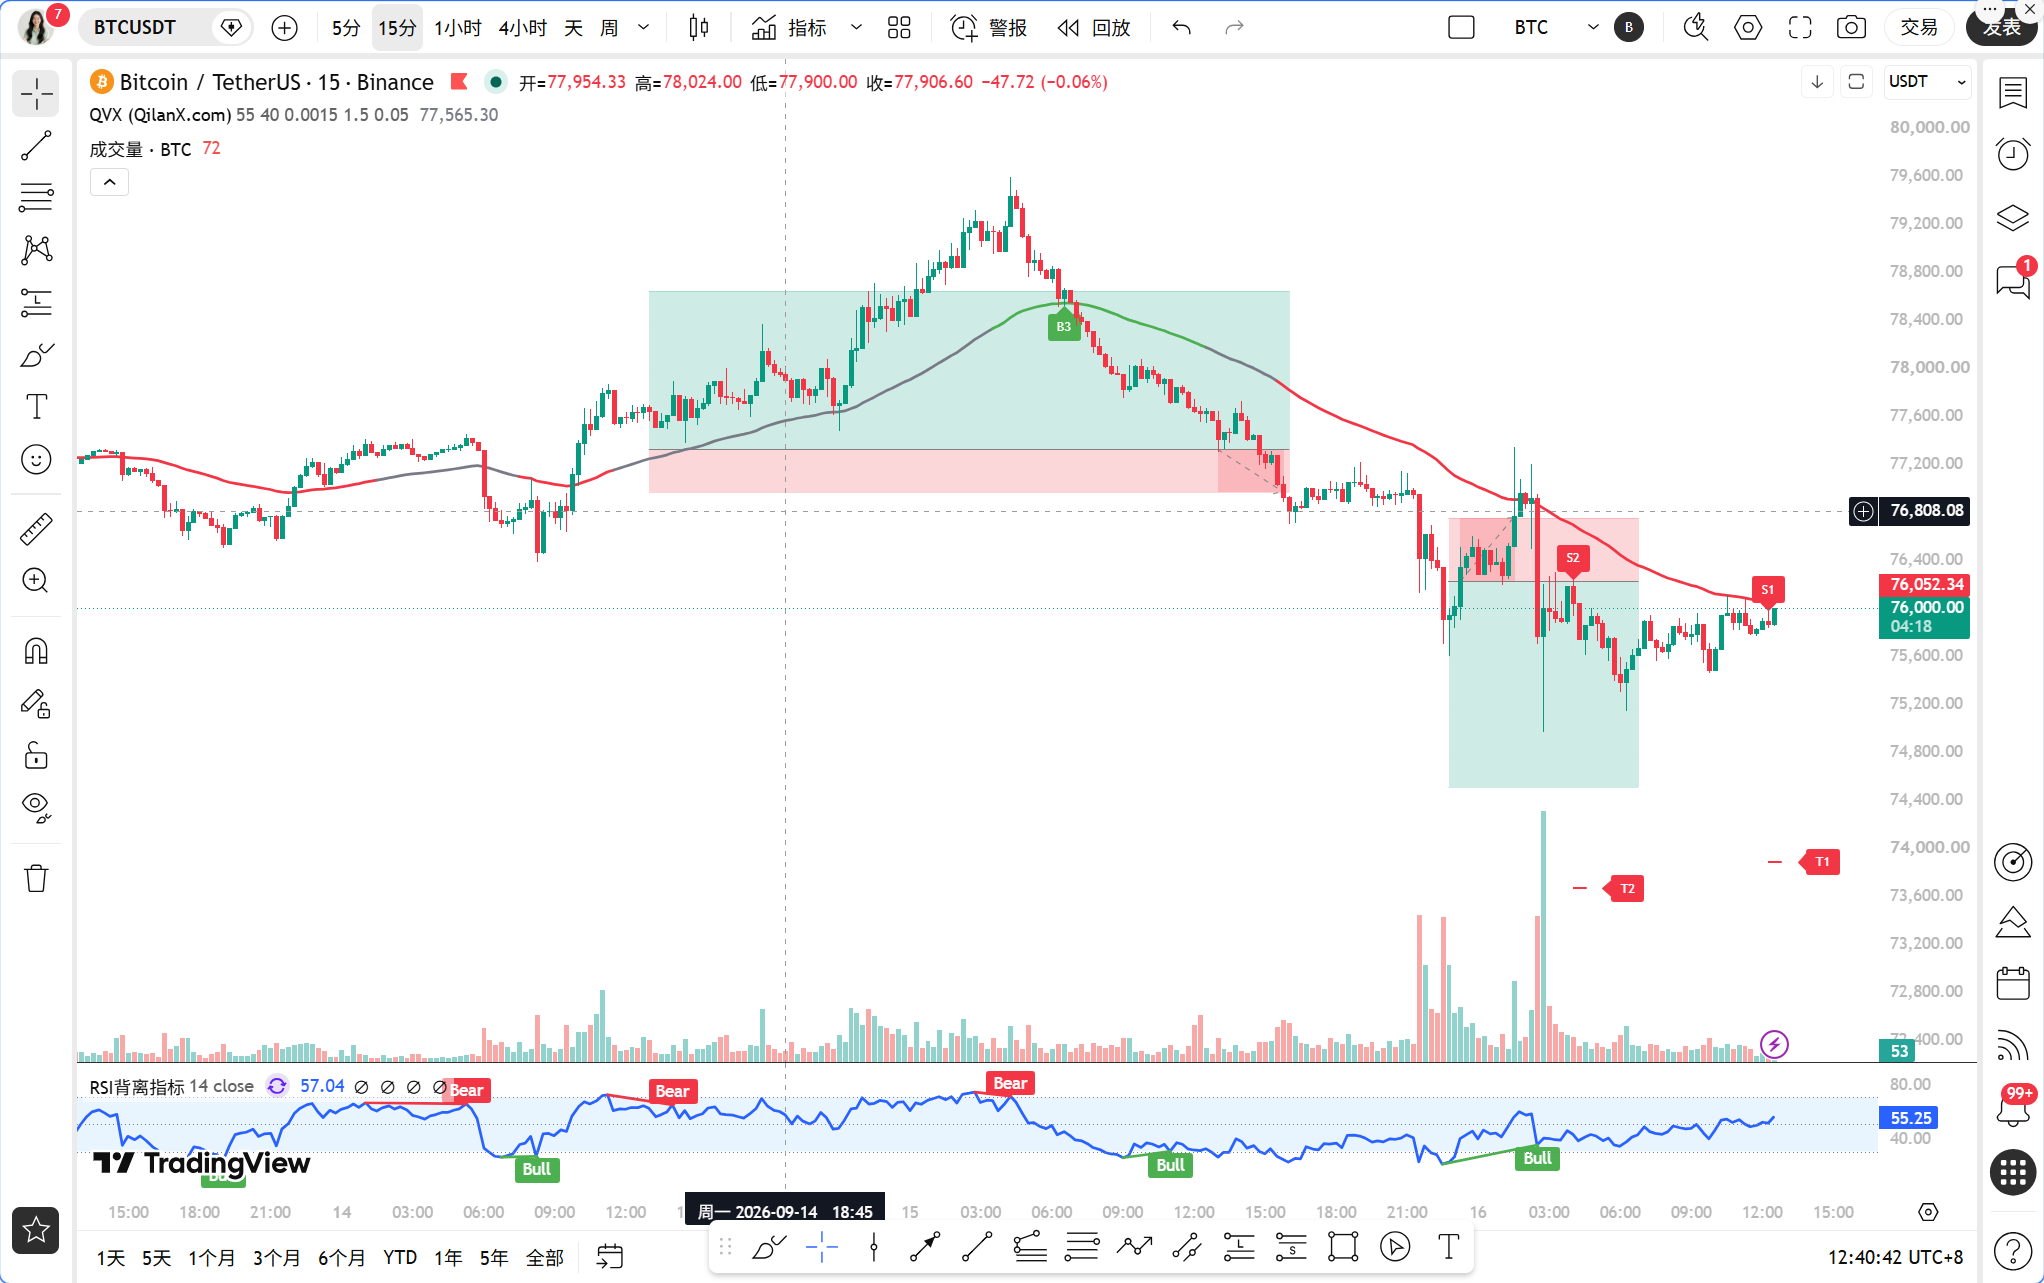
First, let's look at the multi-time frame status. On the daily chart, MA5 is at 76,781, MA10 is at 77,357, MA30 is at 77,294, and the current price of 75,953 has broken below all three moving averages. The MACD histogram value is -799.55, with DIF at 1,013.58 and DEA at 1,813.14, clearly indicating a weakening daily momentum. The RSI is at 45.48, not yet entering the oversold zone, suggesting that the daily level adjustment may not be over. On the 4-hour chart, MA5 is at 76,023, MA10 is at 76,883, MA30 is at 77,200, and the price has also dropped below all three moving averages. The MACD histogram value is -192.05, with both DIF and DEA below the zero line. The RSI is at 42.64, indicating a complete bearish structure on the 4-hour level. On the 1-hour chart, MA5 is at 75,784, MA10 is at 75,781, MA30 is at 76,674, and the price is hovering near the short moving averages, but the EMA55 is at 76,892.40. The current price of 75,953 is about 1.22% away from EMA55. A MACD golden cross has occurred, with DIF at -453.38 and DEA at -481.16, a histogram value of 27.79, and RSI at 50.12, indicating short-term stabilization signs at the 1-hour level, but overall still below EMA55. On the 15-minute chart, MA5 is at 75,893, MA10 is at 75,892, MA30 is at 75,758, with a MACD histogram value of 27.96, DIF at 9.29, DEA at -18.67, and RSI at 52.96, suggesting short-term momentum is neutral, with no clear direction.
Next, let's validate the signals using the TPV system. First, the EMA55 condition. In the last 8 1-hour candlesticks, the number of times the closing price was greater than EMA55 is 0/8, with 0 crosses; the current price is 1.22% away from EMA55, which completely does not meet the oscillation threshold, leading the system to determine a unilateral trend. The price has closed below EMA55 for 8 consecutive 1-hour candlesticks, making the bearish trend area very clear. Second, the shape condition. Currently, the 1-hour level has not generated effective long upper shadows or top formations, but the price is struggling repeatedly in the range of 75,700 to 76,000, with weak rebounding strength, representing a typical pressure consolidation shape. Third, the momentum condition. While the 1-hour MACD has generated a golden cross, with the histogram turning positive to 27.79, both DIF and DEA remain in deep negative territory, indicating that this golden cross is more likely a correction during a downturn rather than a trend reversal. The RSI at 50.12, has rebounded from a low but has not broken through 60, indicating limited rebound momentum. Overall, the TPV system signals that a bearish trend area is confirmed, but short-term momentum has somewhat repaired, indicating a weak rebound phase within a bearish trend, thus short selling requires waiting for resistance signal upon rebound, while long buying does not meet the system conditions.
On-chain and funding perspectives show that the fear and greed index at 51 is neutral, suggesting that the market has not entered a panic selling phase, which is a hidden concern because real bottoms often come with extreme panic. BTC's market share is at 58.54%, with little obvious flow of funds into altcoins, indicating the market is in a risk-off state. In focus news, large short positions indicate bearish sentiment; trader 0xRay518 has increased short positions while reducing BTC to lock in profits, indicating that professional traders are inclined to defend rather than bottom hunt at current price levels. This week, large unlocks of ARB, ZRO, and STRK further increase market supply pressure. Oil prices spiked 3% after an oil pipeline attack, raising inflation expectations and reinforcing the logic for rate hikes, continuously suppressing risk assets. Overall, the funding situation is bearish, with no significant incremental buying indications observed.
Key attack and defense points. The first resistance level above is around 76,892, which is the position of the 1-hour EMA55 and the TPV system's bull-bear dividing line. The price must close above this level for two consecutive 1-hour candlesticks to consider a potential trend change. The first support level below is around 75,700, which is the recent low point repeatedly tested at the 1-hour level. The second support level below is at the psychological significant level of 75,000. The third support level below is around 74,000, where if 75,000 is effectively broken, this position may become the next target. Jiang Zhuoer mentioned that 76,500 is a key observation point in the short term; if the price accelerates below this level, it could trigger a chain sell-off.
Trading thoughts. Direction: bearish. The current TPV system confirms that the price is below the 1-hour EMA55, with 8 consecutive candlesticks closing below EMA55, marking a clear bearish trend, prioritizing short opportunities. Entry conditions: when the price rebounds into the range of 76,300 to 76,600, a long upper shadow or top formation at the 1-hour level occurs, alongside the MACD histogram starting to shorten or RSI falling from a high, meet the conditions of pressure resistance and weak rebound before entering short. If the price directly breaks below 75,700 and confirms a close on the 1-hour candlestick, consider chasing shorts, but manage the position size. Stop loss: set for shorts above 77,100, which is approximately 200 points above the 1-hour EMA55. If the price closes above EMA55 for two consecutive 1-hour candlesticks, the bearish logic fails, and one must exit. Target levels: first target 75,000, second target 74,000, third target 72,800. If there is a significant volume stagnation or bottom formation structure near 75,000, profits can be taken in portions. Note that the current 1-hour MACD has generated a golden cross, suggesting a possible short-term rebound, so do not rush to chase shorts; wait for resistance signal upon rebound before acting.
Risk warning: After CPI exceeded expectations, rate hike probabilities surged; if the Federal Reserve unexpectedly turns dovish or the CLARITY Act is suddenly passed, it could trigger a short squeeze, so always use stop losses when shorting.
Follow Qinglan Crypto Classroom to seize more trading opportunities! Welcome to visit the official website www.qinglan.org
📊 Qinglan TPV Trading Strategy Backtesting Reference
🕒 Last backtesting time 09-16 07:00:01
Total analysis: 4043 Backtests: 4033 Accuracy: 78.6% (3169/4033)
免责声明:本文章仅代表作者个人观点,不代表本平台的立场和观点。本文章仅供信息分享,不构成对任何人的任何投资建议。用户与作者之间的任何争议,与本平台无关。如网页中刊载的文章或图片涉及侵权,请提供相关的权利证明和身份证明发送邮件到support@aicoin.com,本平台相关工作人员将会进行核查。