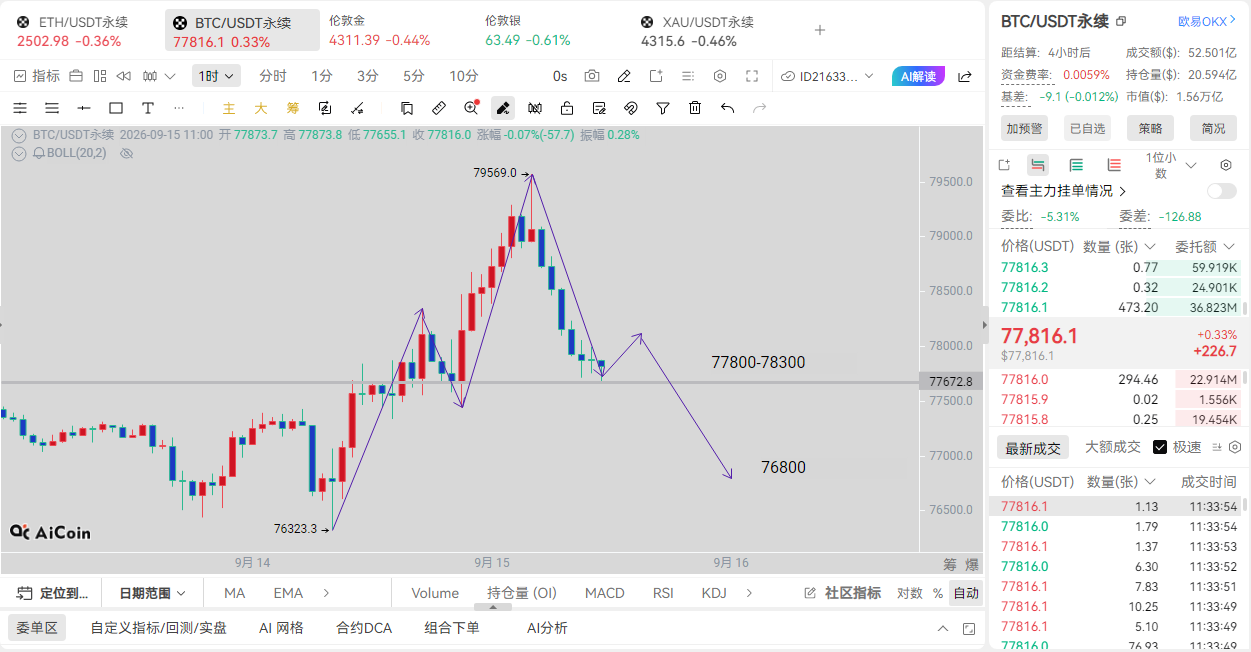
The big pancake started a round of rebound on September 14, peaking close to 79500, forming the top pressure for this round of rebound. After hitting a high, it began to retreat, creating a short-term downward structure with gradually decreasing highs. According to the structure drawn in the chart, 77800-78300 forms the right shoulder of a head and shoulders pattern, and once it breaks down, the next target will point to 76800.
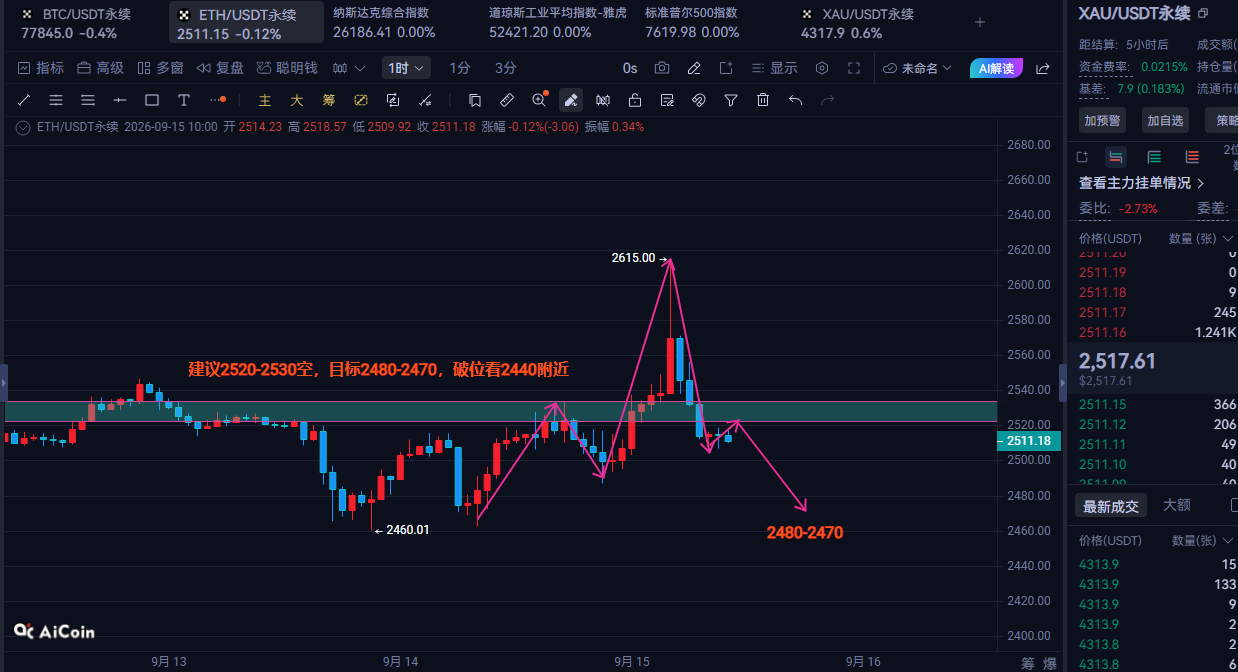
After a significant rise in Ethereum, bullish profit-taking occurred, with it unable to stabilize at the highs of 2615 and 2667. There is heavy selling pressure above. If it wants to strengthen again, it needs to stabilize above 2530 and break through 2615 again; otherwise, the short-term rebound is likely to be a trap for bulls. The hourly chart shows gradually decreasing highs, with the rebound under pressure in the 2520-2530 resistance zone, representing a pullback after rising and falling. As long as the rebound cannot break through 2530, bears will have the advantage, and the price will continue to test the support below at 2480-2470; if 2460 support is effectively broken, it will open up deeper downside space towards 2440.
免责声明:本文章仅代表作者个人观点,不代表本平台的立场和观点。本文章仅供信息分享,不构成对任何人的任何投资建议。用户与作者之间的任何争议,与本平台无关。如网页中刊载的文章或图片涉及侵权,请提供相关的权利证明和身份证明发送邮件到support@aicoin.com,本平台相关工作人员将会进行核查。