Cryptocurrency Expert: 9.14 Ethereum (ETH) High Volatility Trap, Don't Let Short-Term Candlestick Mislead Trading Direction? Latest Market Analysis Reference
Ethereum's current price is 2435, this wave of increase has accumulated a lot of profit-taking, turbulence and consolidation are the norms. Many people always want to catch the top or bottom, this type of speculation carries high risks. When trading, prioritize risk considerations before looking at profit. Technical charts can only serve as probability references, cryptocurrency markets are easily affected by news, and significant price fluctuations can happen at any time. For every trade, think in advance about the maximum loss; once the stop-loss is hit, decisively exit the position, do not hold the position, holding a position is the main reason for significant losses in accounts.
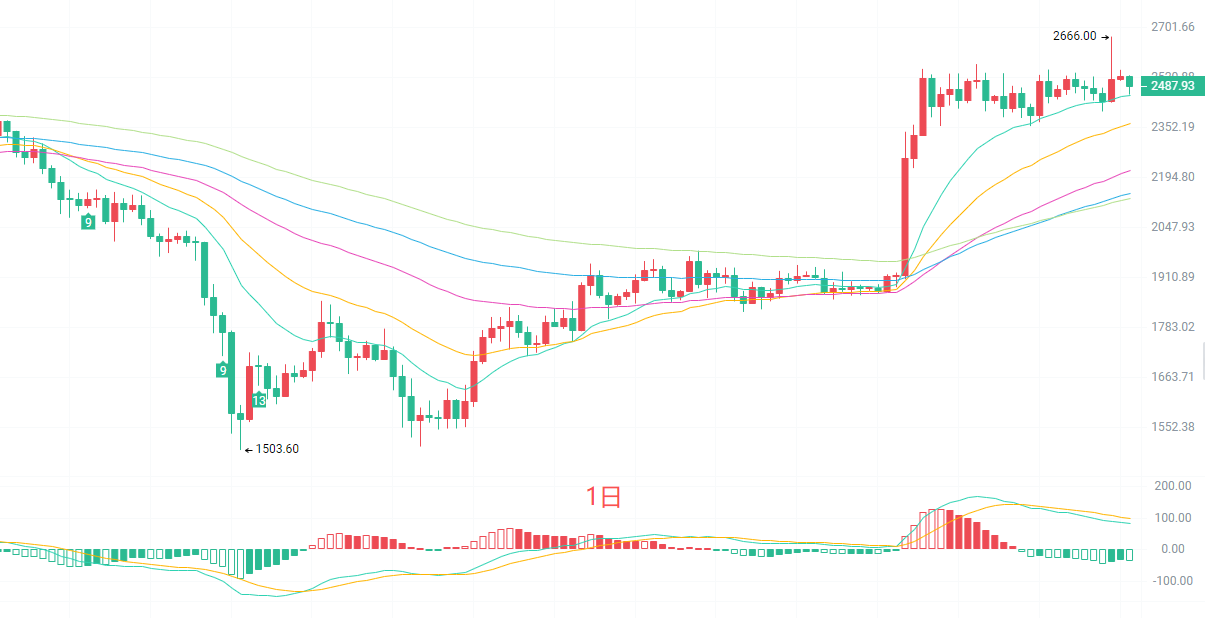
The daily candlestick chart shows a typical bullish profit-taking pattern. The moving average system is still in a bullish arrangement, with short-term EMA15 and EMA30 providing support below, indicating that the broader uptrend has not been completely broken. The MACD indicator's DIF has crossed below DEA, the red bars continuously shrink, and bullish momentum is clearly diminishing. After the Bollinger Bands opened, they are starting to converge, with the price retreating to near the middle Bollinger line. Currently, on the daily chart, we are in a high-level consolidation after a large increase, with strong resistance at 2666 above and key support at around 2365 below. If this level is broken, the structure of this round of increase will be challenged.
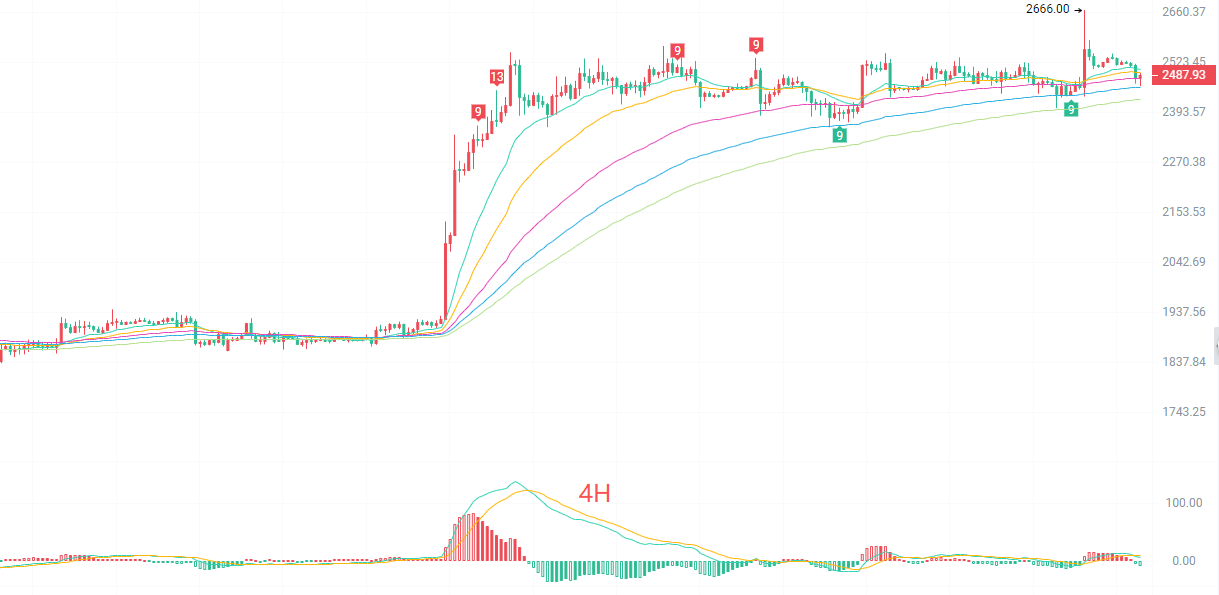
The four-hour candlestick shows horizontal fluctuation near several EMA moving averages. EMA15 and EMA30 are intertwined and flattening, balancing the forces of bulls and bears. MACD's DIF and DEA are slowly declining, the indicator is in a weak zone, but there has been no significant bearish volume. The middle Bollinger line is around 2496, and the current price is closely following this middle line. The upper line at 2569 serves as short-term resistance, while the lower line at 2423 acts as a defensive position below. There has been no one-sided decline; it belongs to high-level consolidation and repair, with a high probability that the short-term market will fluctuate back and forth within a range, so do not rush to chase a one-sided move.
Short-term Reference:
If it does not break below 2430 to 2400, aim upward, stop-loss at 40 points, target at 2550 to 2580.
If it does not break above 2580 to 2620, aim downward, stop-loss at 40 points, target at 2530 to 2490.
Specific operations are primarily based on real-time market data. For more information and details, you can consult the author. The article is published with a delay, so it is recommended to use it for reference only; risk is to be borne by the reader.

Warm Reminder: The above content is created solely by the author of the official account. The advertisements at the end of the article and in the comment section are unrelated to the author, please identify them carefully. Thank you for reading.
免责声明:本文章仅代表作者个人观点,不代表本平台的立场和观点。本文章仅供信息分享,不构成对任何人的任何投资建议。用户与作者之间的任何争议,与本平台无关。如网页中刊载的文章或图片涉及侵权,请提供相关的权利证明和身份证明发送邮件到support@aicoin.com,本平台相关工作人员将会进行核查。