It was a rough day to be an investor in risk assets. The S&P 500 dropped 0.59%, the Nasdaq fell nearly 1%, and Bitcoin gave back some of its recent gains as August's Producer Price Index came in hotter than expected, reviving fears the Federal Reserve might hike rates rather than cut them.
In general terms, almost 85% of all crypto assets today in the top 100 by market cap have lost ground in the last 24 hours. Oil pushing above $100 a barrel amid ongoing U.S.-Iran tensions isn't helping the inflation math either. Treasury yields spiked to multi-year highs on the news, squeezing anything that isn't a Treasury bond.
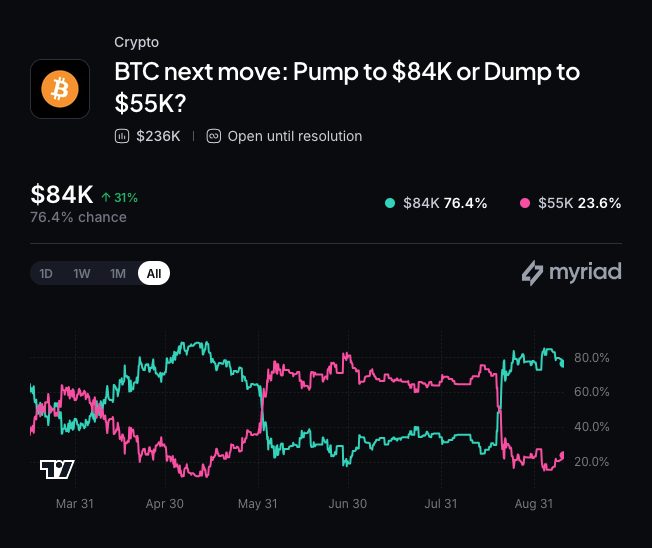
Myriad: Bitcoin's next move? Click to make your prediction.
With Friday's Consumer Price Index report and the Fed's September 15 meeting both looming, markets are bracing for more volatility before the week is out.
It may look dicey in the near term, but investors who zoom out will find that, on the Bitcoin chart at least, there's a pattern beginning to form that's been historically a very bullish signal.
Bitcoin price: What the charts say
Bitcoin opened today at $78,282 and touched an intraday high of $78,526 before sellers took over, dragging the price of BTC down to a low of $76,651. It is currently trading at $77,323, down $959, or 1.22%, on the day.
That's a pullback from last week's rally above $80,000, but zoom out and the bigger picture still looks constructive—Bitcoin remains up sharply from its August lows near $64,000.
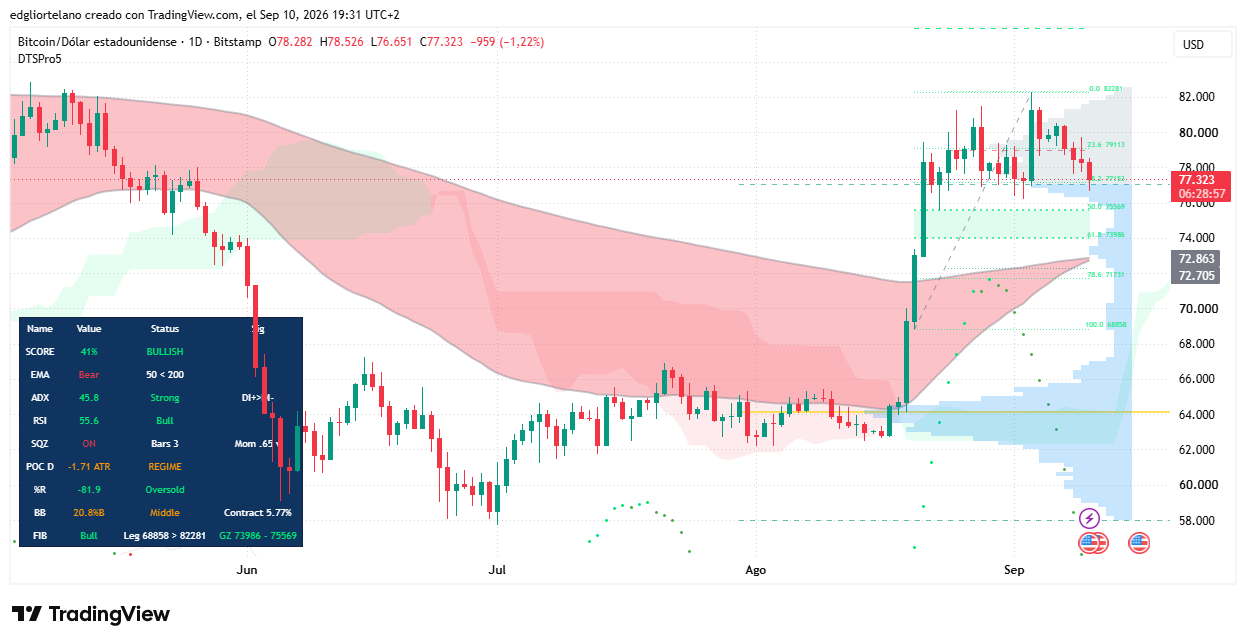
Bitcoin price data. Image: Tradingview
The Average Directional Index, or ADX, which measures how strong a trend is regardless of direction, sits at 45.8—well above the 25 threshold traders use to confirm a real trend is in place. That's a strong reading, and combined with the Relative Strength Index at 55.6—comfortably in bullish territory without flashing overbought—it suggests the recent uptrend still has some gas left, even after today's red candle.
The moving averages remain in a technically bearish setup for now, with the 50-day EMA still trading below the 200-day EMA. But that gap has nearly closed. The crossover—known as a golden cross, when the shorter-term average overtakes the longer-term one—is projected to confirm in the next couple of days unless something really bad happens.
It would be Bitcoin's first golden cross since November 2025's bearish crossover kicked off the current cycle's drawdown.
The Squeeze Momentum Indicator is “on,” which is a classic sign that volatility is compressing before a bigger move, up or down. If the stars align and Bitcoin maintains its bullish trend, the compression may break to the upside, confirming the golden cross.
Why the golden cross matters more than today's dip
A single red day driven by a macro inflation surprise doesn't erase a multi-week uptrend, and today's selloff hit stocks just as hard as crypto. What's different for Bitcoin is the moving-average setup building underneath the price action.
U.S. spot Bitcoin ETFs pulled in $3.8 billion in net inflows over the past three weeks, their strongest stretch of 2026, with total net assets reaching $101.3 billion—a sign institutional demand hasn't slowed even as the asset digests today's macro-driven pullback.
Still, traders shouldn't treat a golden cross as a guarantee. It's a lagging indicator built off past price data, and history shows it has occasionally reversed within weeks of forming. With Friday's CPI print and next week's Fed decision both still ahead, Bitcoin's next major move is more likely to be dictated by whether inflation data cools off than by where two moving average lines happen to intersect.
The views and opinions expressed by the author are for informational purposes only and do not constitute financial, investment, or other advice.
免责声明:本文章仅代表作者个人观点,不代表本平台的立场和观点。本文章仅供信息分享,不构成对任何人的任何投资建议。用户与作者之间的任何争议,与本平台无关。如网页中刊载的文章或图片涉及侵权,请提供相关的权利证明和身份证明发送邮件到support@aicoin.com,本平台相关工作人员将会进行核查。


