Cryptocurrency Circle Academician: On September 11, Ethereum (ETH) market momentum has exhausted, what is the truth behind the trend of sideways consolidation? Latest market analysis reference
The current price of Ethereum is 2435, it is not rising and not falling deeply, oscillating back and forth to hit stop losses, both longs and shorts are suffering. Many friends have been asking whether this rebound has come to an end, whether the next move is to continue to rise or to deeply retrace. From the perspective of the market, the larger trend still leans towards bullish, but short-term bullish momentum has obviously weakened, and selling pressure continues to be released from above.
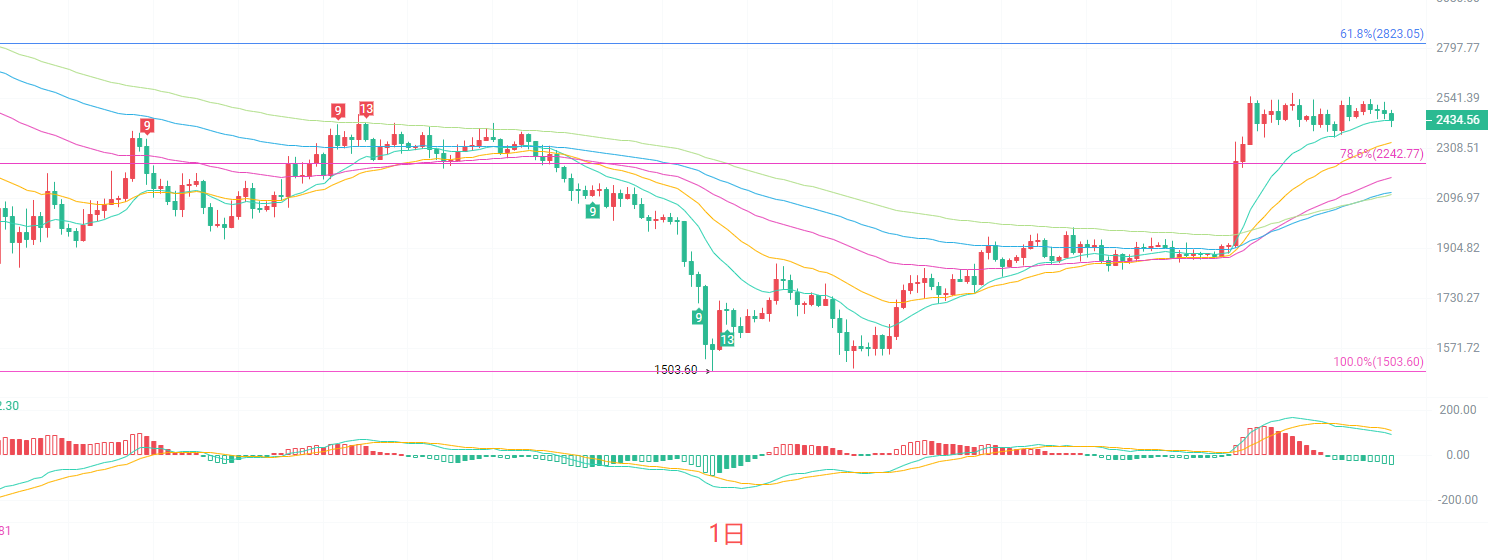
The daily K-line battle between bulls and bears is very intense. EMA30 and EMA60 continue to trend upward, the mid-to-long-term moving averages have not broken the bullish structure, and the larger trend still retains the potential for upward movement. The MACD indicator's red bars continue to shrink, and the DIF has turned down, indicating that bullish strength is gradually weakening. The middle band of the Bollinger Bands is at 2462, and the lower band is at 2393.98. The price has fallen below the middle band of the Bollinger Bands and is under short-term pressure. The daily level is in a consolidation phase after a rise, with no trend reversal signals appearing, but short-term caution is needed for a retest of the support below.
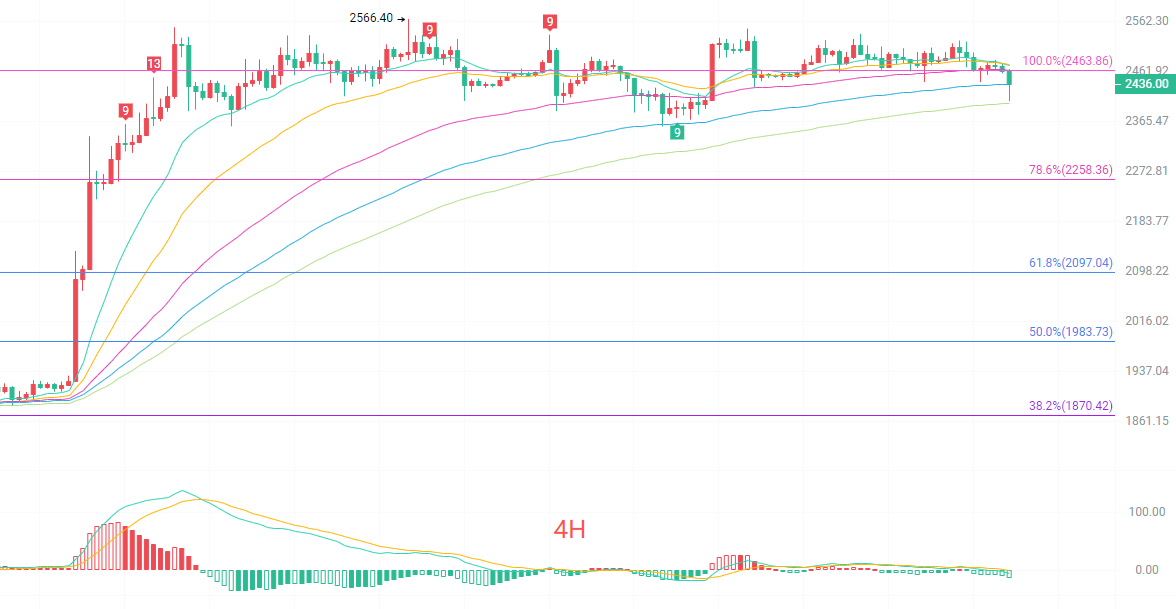
The four-hour K-line has already broken below the EMA15 cycle moving average, indicating a short-term weakening. EMA30 remains upward, mid-term support is still intact, and there is no continuous bearish arrangement formed. The MACD's DIF has crossed below the DEA forming a death cross, and the green bars have slightly enlarged, indicating that short-term bearish strength is dominant. The middle band of the Bollinger Bands is around 2480, and the lower band is near 2448, with prices gradually approaching the lower band of the Bollinger Bands. The trend is in the retracement phase after a high double top, with 2566 above as the high point of this rebound, multiple failed attempts to rise have formed an obvious pressure zone, entering a short-term correction and digestion phase.
Short-term reference:
If the price does not break below 2430 to 2400, it can go up, with a stop loss of 40 points, targeting 2450 to 2480.
If the price does not break above 2470 to 2490, it can go down, with a stop loss of 40 points, targeting 2450 to 2420.
Specific operations should rely on real-time data from the market. For more detailed information, you can consult the author. The publication of the article has a delay, so it is advised to use it for reference only, and risks are borne by the reader.

Warm reminder: The above content is solely created by the author of the public account. The advertisements at the end of the article and in the comments section are unrelated to the author. Please discern carefully, thank you for reading.
免责声明:本文章仅代表作者个人观点,不代表本平台的立场和观点。本文章仅供信息分享,不构成对任何人的任何投资建议。用户与作者之间的任何争议,与本平台无关。如网页中刊载的文章或图片涉及侵权,请提供相关的权利证明和身份证明发送邮件到support@aicoin.com,本平台相关工作人员将会进行核查。