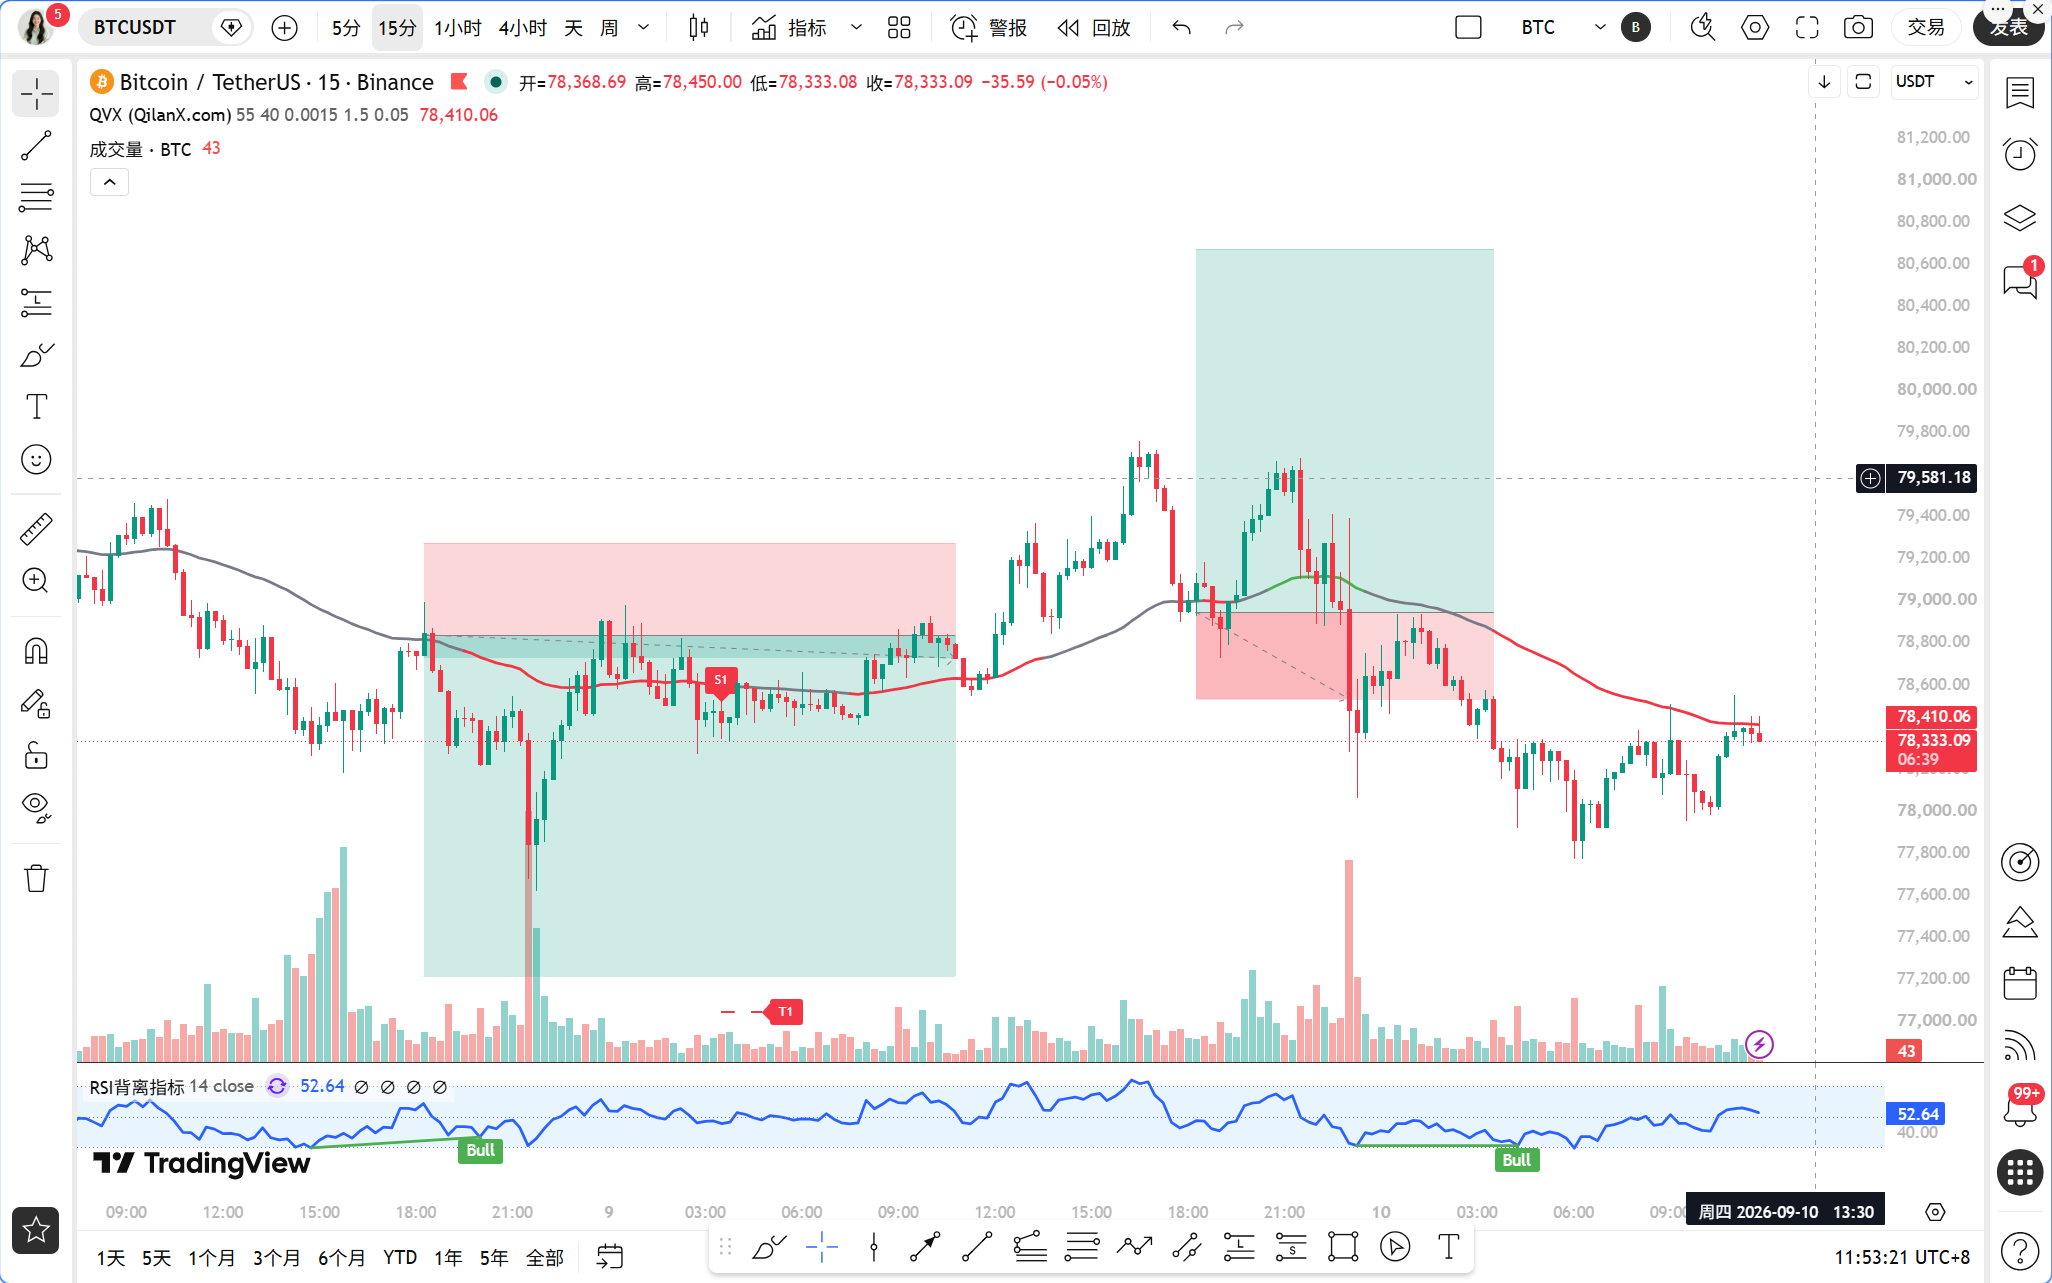
The yield on U.S. Treasury bonds has surged to 5.3%, putting pressure on the three major U.S. stock indices, and at the same time, the conflict between the U.S. and Iran continues to escalate, with Brent crude oil nearing $100, reigniting inflation concerns. The combination of these two pieces of news is clearly suppressive to the cryptocurrency market. However, another piece of news is also noteworthy: Binance's market share in the RWA perpetual contracts has exceeded 50%, indicating that leading exchanges dominate this sector and that traditional funds' interest in on-chain real assets has not waned due to short-term fluctuations. On one hand, there is an expectation of tightening macro liquidity; on the other hand, there is a long-term narrative of compliance and the entry of traditional funds. BTC finds itself caught in the middle, trading at 78,333 USDT today.
The current time is September 10, 11:52, with BTC priced at 78,333 USDT, a 24-hour decrease of 1%, with a market share of 58.56%, and a fear and greed index of 69, still in the greed range. The greed index has not collapsed, yet the price is falling, which itself indicates that market sentiment is still holding up, but funds have been quietly making selections.
First, let's examine the multi-timeframe status. On the daily level, MA5 is at 78,909.83, MA10 at 79,009.11, and the price has already broken below these two short-term moving averages. MA30 is still far at 74,666.68. The daily MACD histogram value is negative at -565.96, with DIF at 2,410.30 and DEA at 2,976.26. The daily momentum is decaying, but the overall structure has not completely turned bearish. On the 4-hour level, MA5 is at 78,559.18, MA10 at 78,651.71, and MA30 at 79,213.37, with all three moving averages above the price. The 4-hour MACD histogram value is -60.73, with DIF at -254.79 and DEA at -194.06, clearly in a bearish arrangement. On the 1-hour level, MA5 is at 78,254.42, MA10 at 78,231.46, and MA30 at 78,722.39, with the price hovering near MA5 and MA10, but EMA55 is at 78,773.34, showing a 0.56% gap from the price. The 1-hour MACD histogram value is -35.55, with DIF at -183.88 and DEA at -148.33, and RSI at 35.02, close to oversold but not entering an extreme zone. On the 15-minute level, MA5 is at 78,367.49, MA10 at 78,243.26, and MA30 at 78,203.97, with the price entangled near the 15-minute moving averages. The MACD histogram value is positive at 39.20, with DIF at 1.39 and DEA at -37.80, showing slight stabilization in the 15-minute horizon, RSI at 50.36, neutral.
Now let's use the TPV system to verify the signals. First, EMA55 conditions. The current price is 78,333, with the 1-hour EMA55 at 78,773.34, and the price is below EMA55. In the past 8 1-hour candlesticks, the closing price was greater than EMA55 0 times, and the crossover occurred 0 times. This means all 8 consecutive 1-hour candlesticks closed below EMA55, clearly indicating a bearish trend area, without any controversy. Second, pattern conditions. The price is stabilizing near 78,300 and showing slight rebound on the 15-minute level, but there have been no clear signals of long lower shadows, bottom formations, or volume surges on the 1-hour and 4-hour levels, as the rebound strength is insufficient to form a supportive bullish pattern. Third, momentum conditions. Although the 1-hour MACD histogram is negative, it needs to be observed for consecutive shrinkage. Currently, both DIF and DEA are in negative territory, with a histogram value of -35.55, and there has been no clear signal of consecutive two-period shrinkage. RSI at 35.02 has slightly rebounded from a low position but has not returned above 30 to form a valid reversal. Overall, the three long conditions of the TPV system are all unmet, while the short conditions show the price under pressure below EMA55, but the resistance pattern and weak momentum signals are not clear enough. In judging the volatility, the closing price of the past 8 1-hour candlesticks was greater than EMA55 0 times, with a crossover of 0 times, at a distance of 0.56% from EMA55, not meeting the volatility threshold, the system deems it a unilateral trend, but the momentum is not sufficient to trigger a new short signal. The conclusion is that it is currently in a bearish trend area, but the signals are incomplete, requiring patience.
From the on-chain and funding perspective, the fear and greed index is at 69, with greed still present, but BTC's 24-hour decrease of 1% indicates that the price is falling without panic in sentiment, which often suggests that the decline is not over yet because panic selling has not occurred. BTC's market share of 58.56% indicates no significant fund flow into altcoins, putting the market in a defensive state. On-chain news suggests normal inflow of Bitcoin into CEX, with no major selling pressure signals during the rebound, indicating no signs of large whales dumping in the short term, but also lack of big buying drivers. The surge in U.S. Treasury yields and rising oil prices are currently the largest macro pressures, with an approximately 60% probability of interest rate hikes, reinforcing expectations of tightening liquidity.
Key attack and defense points. The first resistance level above is near 78,773, the 1-hour EMA55, which is the boundary line of the TPV system's long and short division. The price must close above this position with two consecutive 1-hour candlesticks to consider the return of the bullish trend. The first support level below is at the psychological level of 78,000. If broken, the next support to look at is the 77,500 to 77,600 area, which is a dense area of previous lows. The current price of 78,333 is just in the middle ground, with space both upward and downward, but the direction is unclear.
Trading ideas. Direction: The current TPV system is determined to be in a bearish trend area, but the short signal is incomplete, and the long conditions are completely unmet, so today's main strategy is to wait and not open positions actively. Entry conditions: If the price rebounds to the 78,700 to 78,800 area, close to the 1-hour EMA55, with a long upper shadow or top formation appearing, while the 1-hour MACD histogram shows two consecutive periods of shrinkage and RSI falls from a high position, a light short can be taken. If the price falls to the 77,500 to 77,600 area, with a long lower shadow or bottom formation appearing, while the 1-hour MACD histogram shows two consecutive periods of shrinkage and RSI rebounds from below 30, a light long can be taken. Stop loss: The short stop loss is set above 79,200, while the long stop loss is set below 77,000. Target levels: The first target for shorting is 78,000, the second is 77,500. The first target for longing is 78,700, the second is 79,200. In terms of position management, the current signals are incomplete, and it is recommended to limit positions to no more than one-third of normal positions, and to increase positions only after the TPV system signals are complete.
Risk warning: If U.S. Treasury yields and oil prices continue to surge, BTC may directly break below the 77,500 support. Do not blindly bottom-fish just because the greed index is high.
Follow Qinglan Crypto Classroom for more trading opportunities! Welcome to visit the official website www.qinglan.org
📊 Qinglan TPV Trading Strategy Backtest Reference
🕒 Last backtest time 09-10 07:00:02
Total analysis: 3908 Backtest: 3904 Accuracy: 79% (3085/3904)
免责声明:本文章仅代表作者个人观点,不代表本平台的立场和观点。本文章仅供信息分享,不构成对任何人的任何投资建议。用户与作者之间的任何争议,与本平台无关。如网页中刊载的文章或图片涉及侵权,请提供相关的权利证明和身份证明发送邮件到support@aicoin.com,本平台相关工作人员将会进行核查。