Friends who trade should have heard of the term "large order." Those significantly prominent orders in the order book are our core tools for grasping the real intentions of substantial funds — whether they are brokers, institutions, or whales.
The major large order feature in AiCoin is to track large buy and sell orders in real-time and visually mark them on K-line charts or in the order book. Simply put, it allows you to focus directly on the core: which price levels have large orders piled up, whether these orders ultimately get executed, and what the price reaction is post-execution.
However, I want to emphasize: large orders may come from institutions, large fund traders, or other significant participants, but they do not equate to 100% directional signals. They are more like a spotlight, helping you highlight price levels in the market that deserve close attention.
Let’s first teach you how to adjust the [Major Large Order] indicator onto the K-line. The operation is particularly simple; just follow the steps. Step one: open the K-line chart in the software, look at the top left corner of the interface, and find the entry point for [Indicator Library]. Step two: find [Major Large Order] in the pop-up indicator list, or you can directly search for these four characters. Once you find it, simply click [Display on K-line].
Once set up, you will notice that there are suddenly many horizontal colored blocks on the K-line, some red, some green, some deep, some light, some thick, and some thin.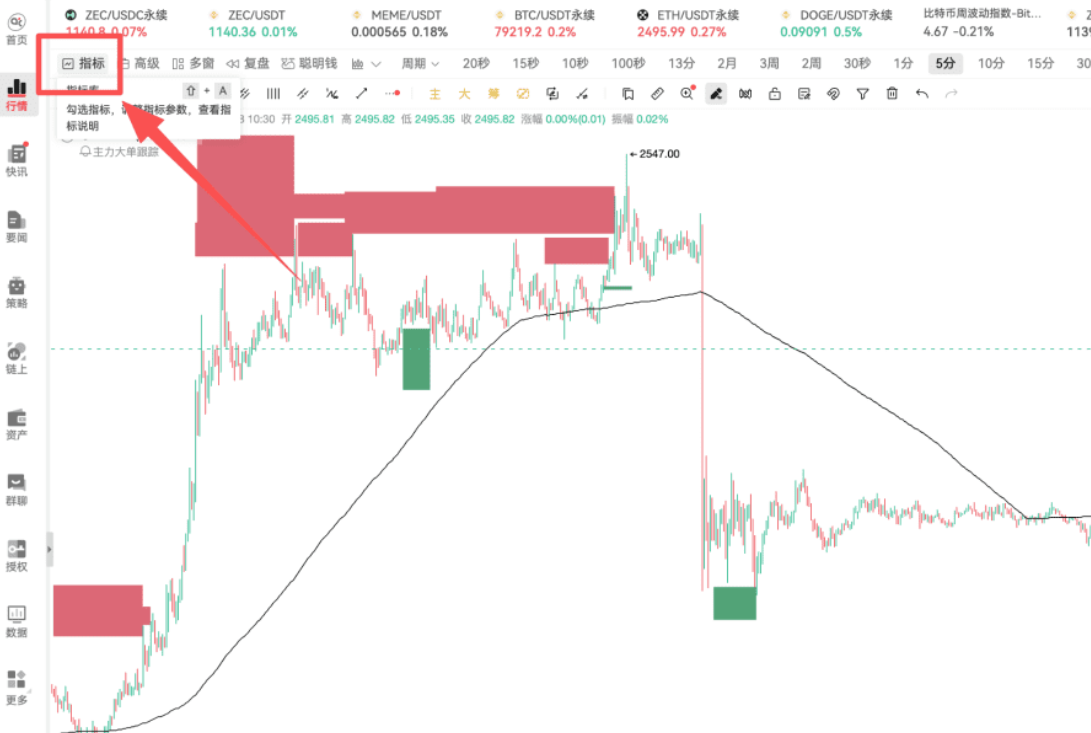
I summarize the characteristics of large orders into three core aspects: length, thickness, and color intensity.
First, let's look at length: the longer the horizontal line, the longer this order has been hanging in the order book. If a line stretches across a long portion of the K-line, it indicates that the operator has been waiting with that order for a while; it is a prepared setup, not a temporary flash of a fake order, and it also means that large funds were paying attention to this price level earlier and more clearly.
Next, let's consider thickness: the thicker the line, the larger the order amount. A thick line indicates a much larger volume compared to a thin line. For instance, a very thick red line above likely represents a sell order in the tens of millions of USD range putting pressure here.
The third aspect is color intensity: lighter colors generally indicate that the large order hasn't been executed yet and is still in an open order state; darker colors mean that a real transaction has occurred. This distinction is particularly important — open orders that haven’t moved and those that have executed with real money have completely different market significances (Figure 5).
An example will make it clear: Suppose there are two lines on the K-line — Line 1: thick, dark in color, spanning across three hours; Line 2: thin, light-colored, only appearing for five minutes. Clearly, Line 1 has much higher reference value: it has a large amount, has been open for a long time, and has had real transactions, representing high-quality traces of the operator, which will have strong support or resistance on the price.
Next, let’s talk about the five statuses of large orders, which reflect the different meanings behind them in contract trading.
1. Buy to open long: buying contracts, establishing long positions, basically meaning that funds are entering the market betting on price increases.
2. Buy to close short: similarly, buying, but the purpose is to close previously held short positions. One is to establish new bullish positions, while the other is to end bearish positions; although both involve buying, the underlying logic is completely different.
3. Sell to open short: selling contracts, establishing short positions, indicating that funds are laying out for a bearish direction.
4. Sell to close long: closing previously held long positions, either taking profits or stopping losses.
5. Operator turnover: positions transferring between operator accounts, for instance, a long order from Account A moving to Account B, while the overall market position remains unchanged.
So, even for "buy orders," by combining changes in positions, you can discern whether it is opening a new position or closing an old one. Buying and selling tell you the direction, while opening and closing positions help you understand the underlying positioning behavior.
Next, I’ll break down the relevant terminologies on the function page; it’s normal to feel overwhelmed by the jargon when encountering it for the first time, but it won’t be difficult once you break it down (Figure 6).
● Order price: the price at which this large order is placed, which is essentially the position we need to focus on moving forward.
● Initial order: the original order quantity when the system first tracked this large order.
● Executed quantity: the actual amount that was executed at this price.
● Execution ratio: executed quantity ÷ order quantity × 100%. Sometimes during the hanging order process, new orders might be added, resulting in the final execution being greater than what was initially tracked, causing the ratio to exceed 100%.
● Maximum quantity: the maximum order volume this price level has reached since the system began tracking it. This is used to review how much order pressure has piled up at this position in the past.
● Position change: records how much the total position of the relevant contract has changed from the start to the end of this large order. This helps to assess whether the overall market position has increased or decreased — even with large orders, a significant increase or decrease in positions indicates a completely different market state, and it must be viewed comprehensively with the trend.
The value of the member features lies in this: data is integrated on the page, allowing you to verify each item in the large order details directly when reviewing, without having to rely on memory.
Having discussed the indicators and parameters, the most critical aspect is how to leverage it to make money in actual trading. Here are two high-value advanced tips.
Tip 1: Make good use of order duration to filter market noise. There are thousands of small orders bouncing around in the order book every second; trying to see all of them will tire your eyes. We can use order duration to perform "noise filtering." The longer an order has been hanging, the more the operator has anticipated that the price will reach this level, indicating an earlier setup. For instance, in the BTC/USDT perpetual contract, if you set the order duration to "greater than 1 hour," you are effectively only looking at those large orders that have been executed after hanging for more than an hour. The benefit is filtering out a large number of short-lived, quickly withdrawn, low-impact orders, making the chart much cleaner. What remains are the long-standing orders, which are often the price areas truly worth paying attention to. After all, a large order hanging there early on indicates that this price level is being closely watched.
But note, it is "possible," not definite. The correct usage is: large orders help you pinpoint positions, while price trends provide confirmation. Adjusting the order duration to greater than 1 hour will make the chart look much more refreshed. Generally, after a large order is executed, if the price breaks above the top of the executed K-line, it often leads to a small market trend, which is the power of the large order.
Some might ask: sometimes, even when you clearly see a large sell order executed above, why is the price still rising?
Here’s a method for judgment: observe whether the price immediately reverses after the sell order is executed. If the price doesn’t even break the bottom of the executed K-line, it indicates that this sell order could not hold back the buyers and was directly consumed by them, effectively fueling the rise!
Tip 2: The law of attraction of the order wall. Large hanging orders can act not only as support or resistance but also, under specific market psychology and algorithmic trading influences, they can function like magnets, pulling prices towards these levels. For instance, if multiple platforms' operators are placing dense buy orders at a certain price level, they usually intend to create support or accumulate funds at this position. The market will typically dip first, and when the price actually hits the large buy orders, they will hold the price up like a concrete wall. If the buy orders are genuinely executed and strong enough, the price will rebound at this position. Conversely, the same logic applies to sell order walls.
If you encounter any issues during usage, feel free to click the link below to join the group chat and ask questions directly there; we will respond in a timely manner. You are also welcome to chat about the market, share trading insights, and discuss with more friends in the group. Group chat link: https://www.aicoin.com/link/chat?cid=enjLWN3pz
Currently, there are live broadcasts every day; we welcome you to stay updated with AiCoin friends! Reserve in advance 👇
https://www.aicoin.com/zh-Hans/live/list?tab=upcoming
Join our community, let’s discuss and get stronger together!
Official Telegram community: https://t.me/aicoin_support
AiCoin Chinese Twitter: https://x.com/AiCoinzh
Aster commission:
https://www.asterdex.com/zh-CN/referral/9C50e2
Hype commission:
https://app.hyperliquid.xyz/join/AICOIN88
Binance commission [Referral Code: aicoin668]:
https://jump.do/zh-Hans/xlink-proxy?id=3
Coinbase commission [ Referral Code: Y8L23JL ]:
https://jump.do/xlink?checkProxy=true&proxyId=25
免责声明:本文章仅代表作者个人观点,不代表本平台的立场和观点。本文章仅供信息分享,不构成对任何人的任何投资建议。用户与作者之间的任何争议,与本平台无关。如网页中刊载的文章或图片涉及侵权,请提供相关的权利证明和身份证明发送邮件到support@aicoin.com,本平台相关工作人员将会进行核查。