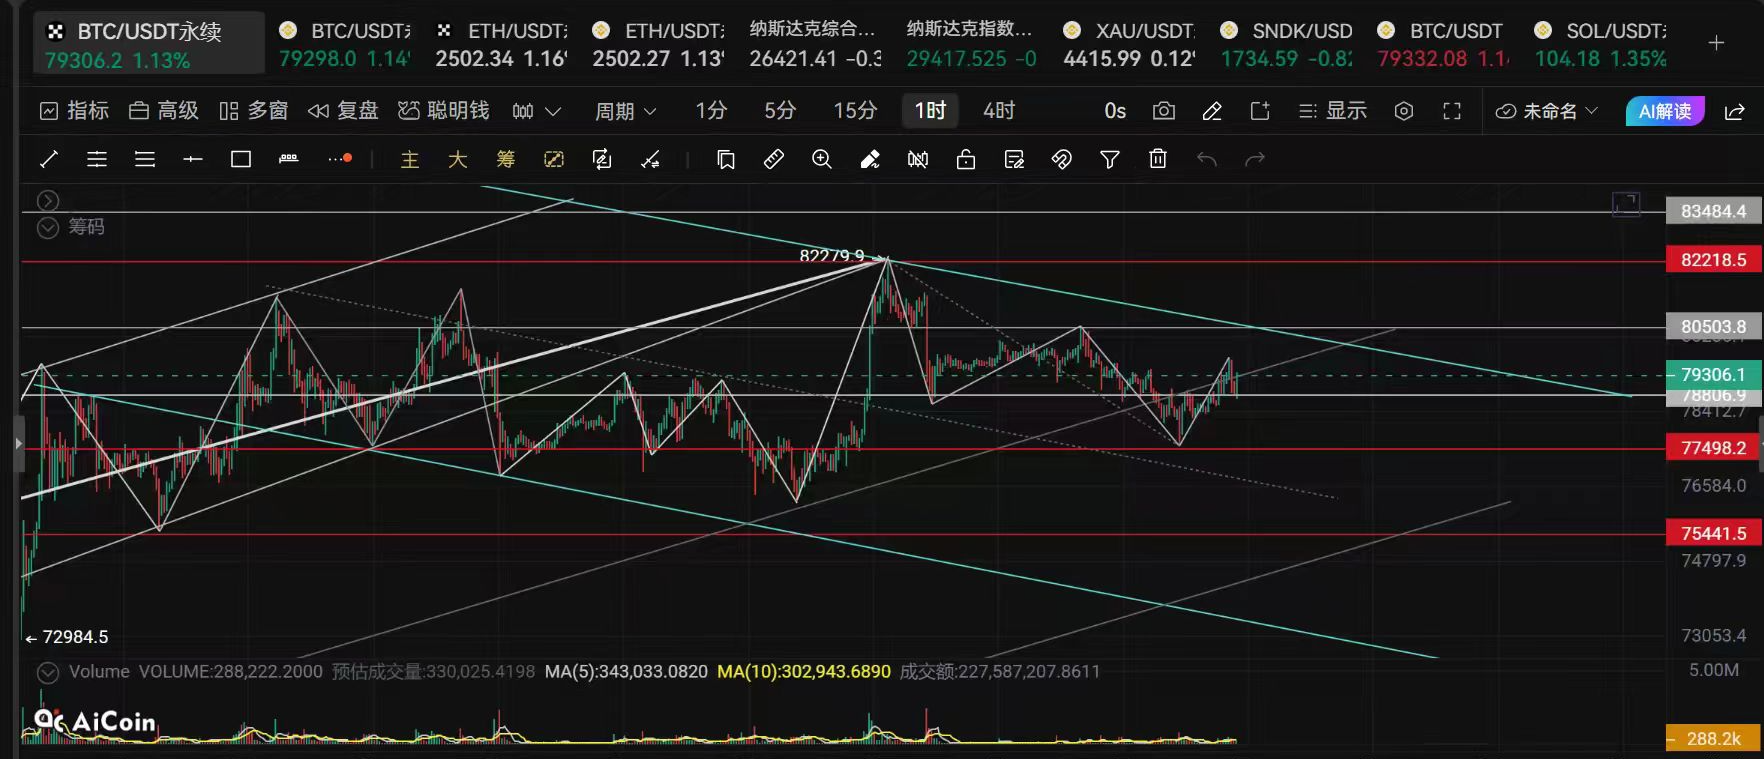
Crypto Circle Academician: On September 10, the Ethereum (ETH) upward continuation pattern is confirmed, what is the core reasoning behind the short-term game of Ethereum? Latest market analysis reference.
Ethereum's current price is 2490. The hardest part of trading is not understanding the market, but controlling the urge to enter. In a volatile market, there seem to be many opportunities, but most are false signals. Don’t always try to anticipate a breakout; wait for the market to establish its direction before following. Preserving your capital and patiently waiting is the key to long-term survival in the market.
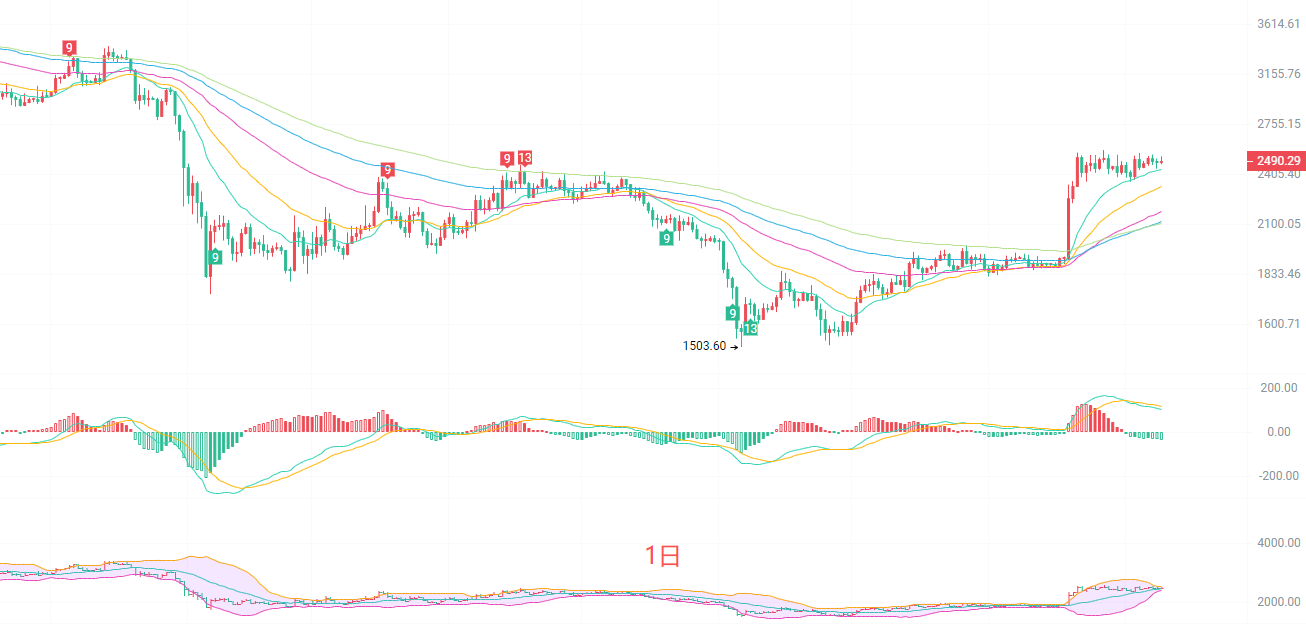
The daily candlestick is firmly above multiple EMA moving averages, with medium to long-term moving averages continuously supporting the market, indicating that the overall bullish trend is not broken. The Bollinger Bands are narrowing, with the upper band at 2538 and the lower band at 2395, compressing the market to oscillate within the channel. The MACD red bars are gradually decreasing, and the DIF and DEA are still above the zero axis, indicating that bullish momentum is slowing but has not turned bearish. Strong resistance is concentrated near previous highs, while support relies on the 20-day moving average. In the short term, it is highly likely to continue high-level consolidation, waiting for direction selection.
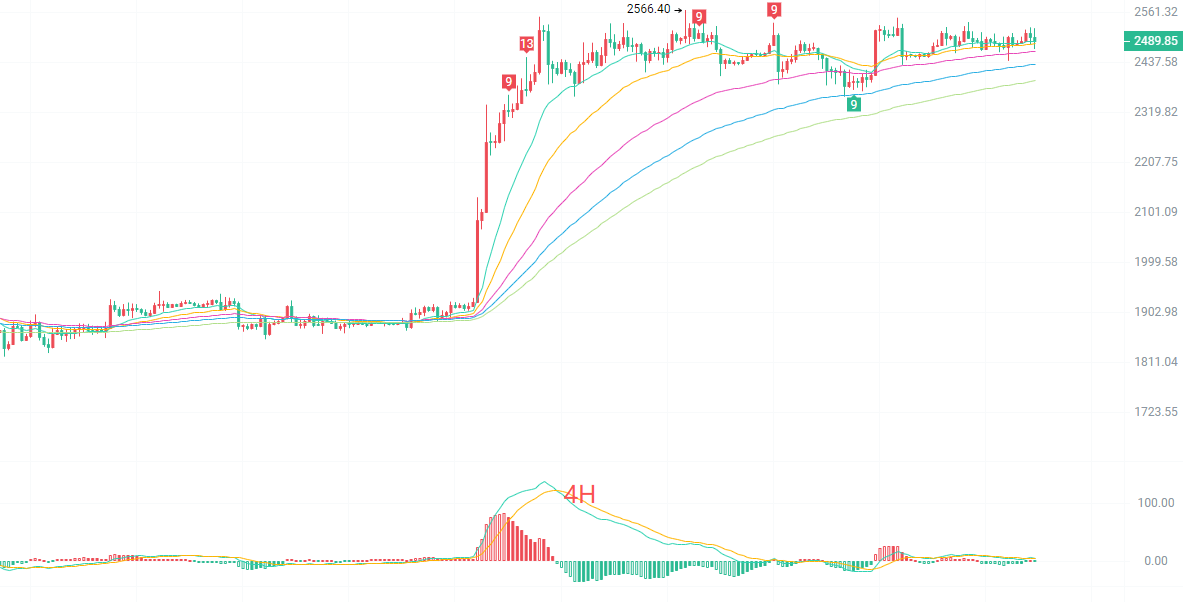
On the four-hour chart, the short-term EMA15 and EMA30 are intertwined and have flattened out, with bulls and bears repeatedly battling here. The Bollinger Bands are narrowing, with the upper band at 2511 and the lower band at 2467, confining the market to fluctuate within the Bollinger channel. The MACD indicator shows that the DIF has crossed below the DEA to form a death cross, with green bars slightly released, indicating a need for short-term pullback and power accumulation. The price has tested upper highs multiple times with no success; a rise meets selling pressure, and a drop finds support from the moving averages, creating a typical oscillation structure. Do not predict breakouts in the short term; prioritize a high-sell, low-buy strategy.
Short-term reference:
If the price does not break below 2470 to 2460, go long with a stop loss of 40 points, targeting 2510 to 2570.
If the price does not break above 2510 to 2530, go short with a stop loss of 40 points, targeting 2480 to 2460.
Specific operations should be based on real-time market data. For more information, you can consult the author. There may be delays in the article publication, and the suggestions are for reference only; risk is to be borne by yourself.

Warm reminder: The above content is solely created by the author on the public account. The advertisements at the end of the article and in the comments are unrelated to the author. Please exercise caution in distinguishing this; thank you for reading.
免责声明:本文章仅代表作者个人观点,不代表本平台的立场和观点。本文章仅供信息分享,不构成对任何人的任何投资建议。用户与作者之间的任何争议,与本平台无关。如网页中刊载的文章或图片涉及侵权,请提供相关的权利证明和身份证明发送邮件到support@aicoin.com,本平台相关工作人员将会进行核查。